Our team looks at a lot of research throughout each day. A few charts that caught our eye this week, and how they help fill the puzzle of evidence:
John Luke: This year already ranks with some of the worst modern markets for the frequency of big down days
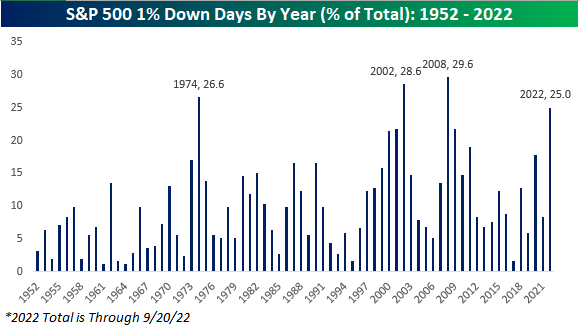 Source: Bespoke
Joseph: …largely a function of equity valuations resetting in the face of yields surging
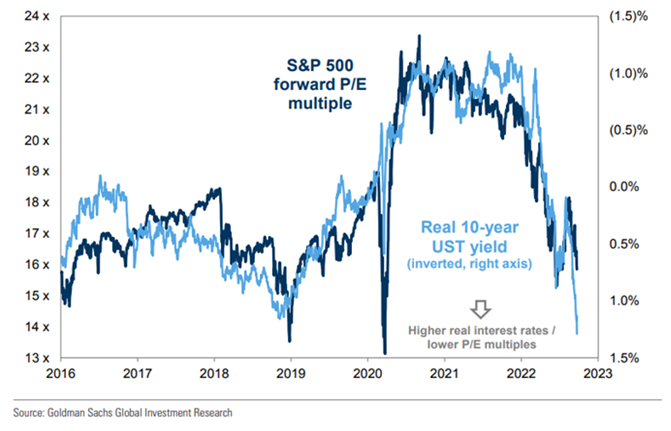 Data as of 09.22.2022
Brad: Price/earnings compression due to rates is approaching the tech bottom
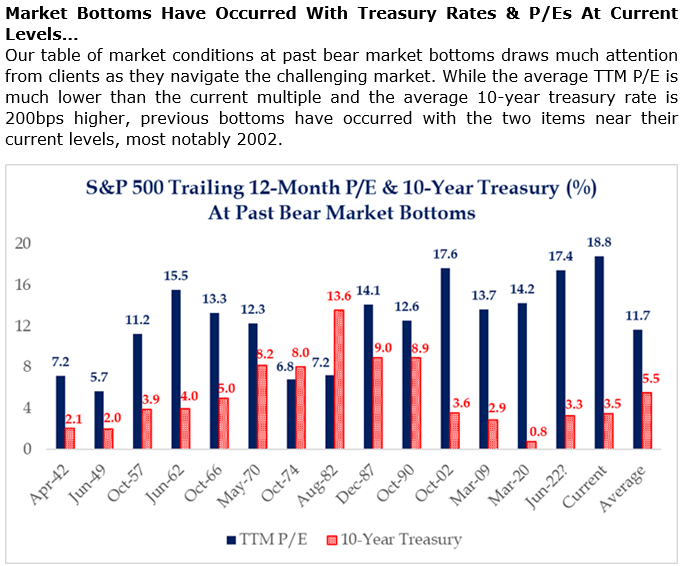 Source: Strategas as of 09.20.2022
Brad: …but nowhere near historic lows if you measure the same by the Consumer Price Index (CPI)
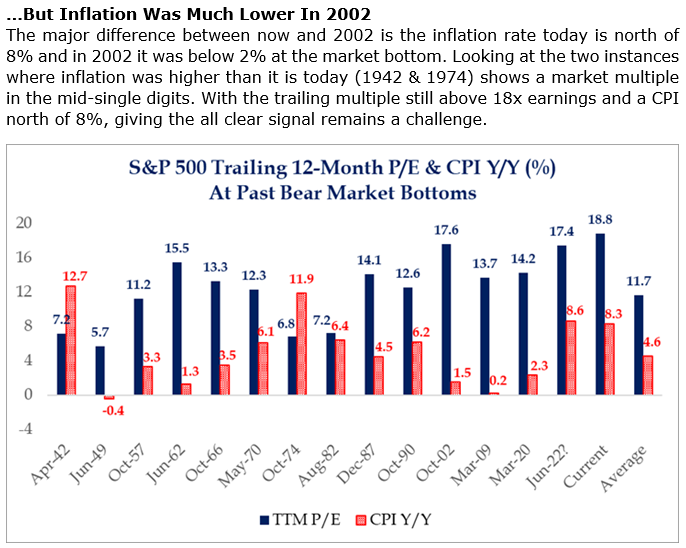 Source: Strategas as of 09.20.22
John Luke: The new FOMC dot plot shows a bump in rate expectations
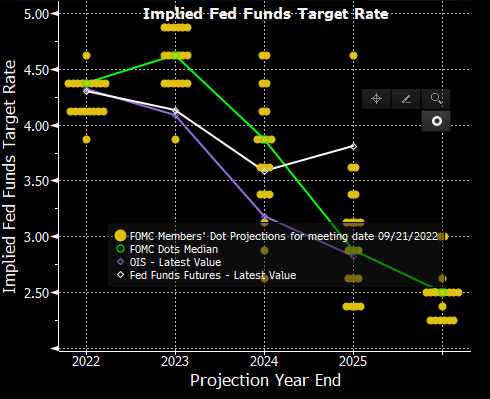 Source: Bloomberg as of 09.21.2022
Dave: …but let’s be honest, the best description for the accuracy of FOMC forecasting might be “LOL”
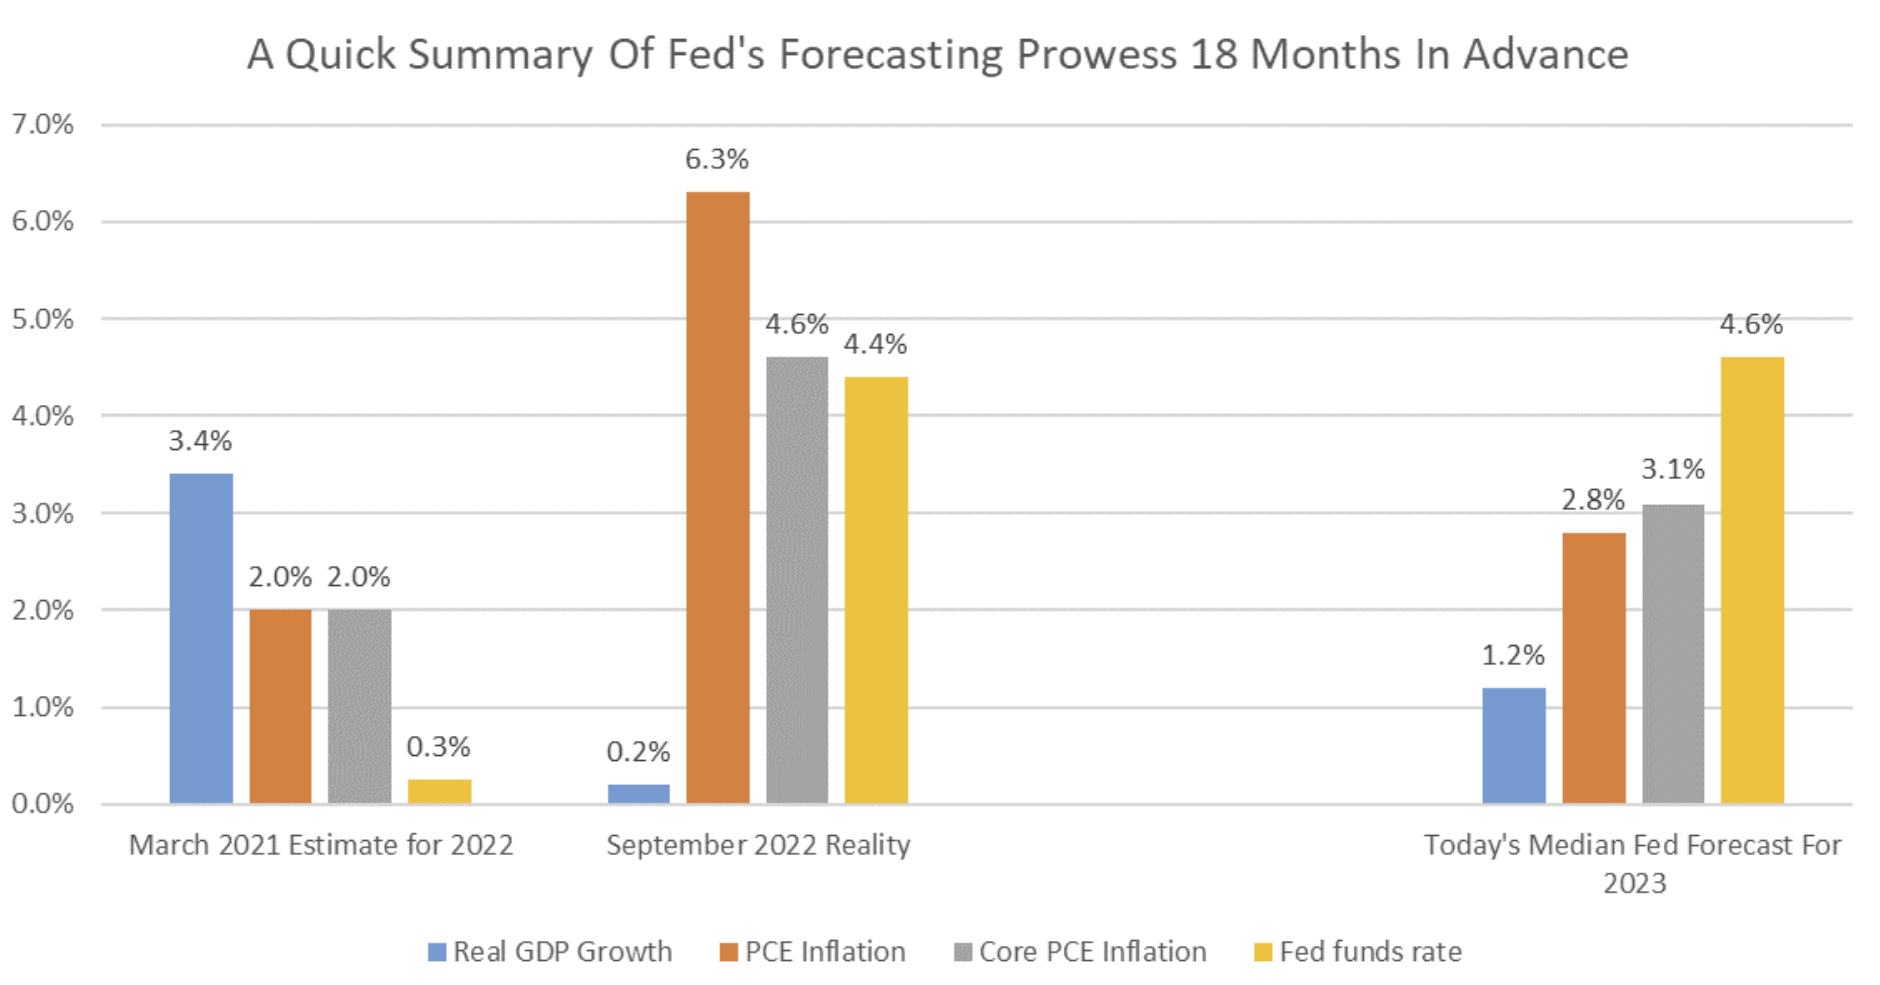 Source: Raymond James as of 09.20.2022
Dave: No longer a TINA (There is No Alternative) world, as T-bills yield more than even yield-heavy sectors
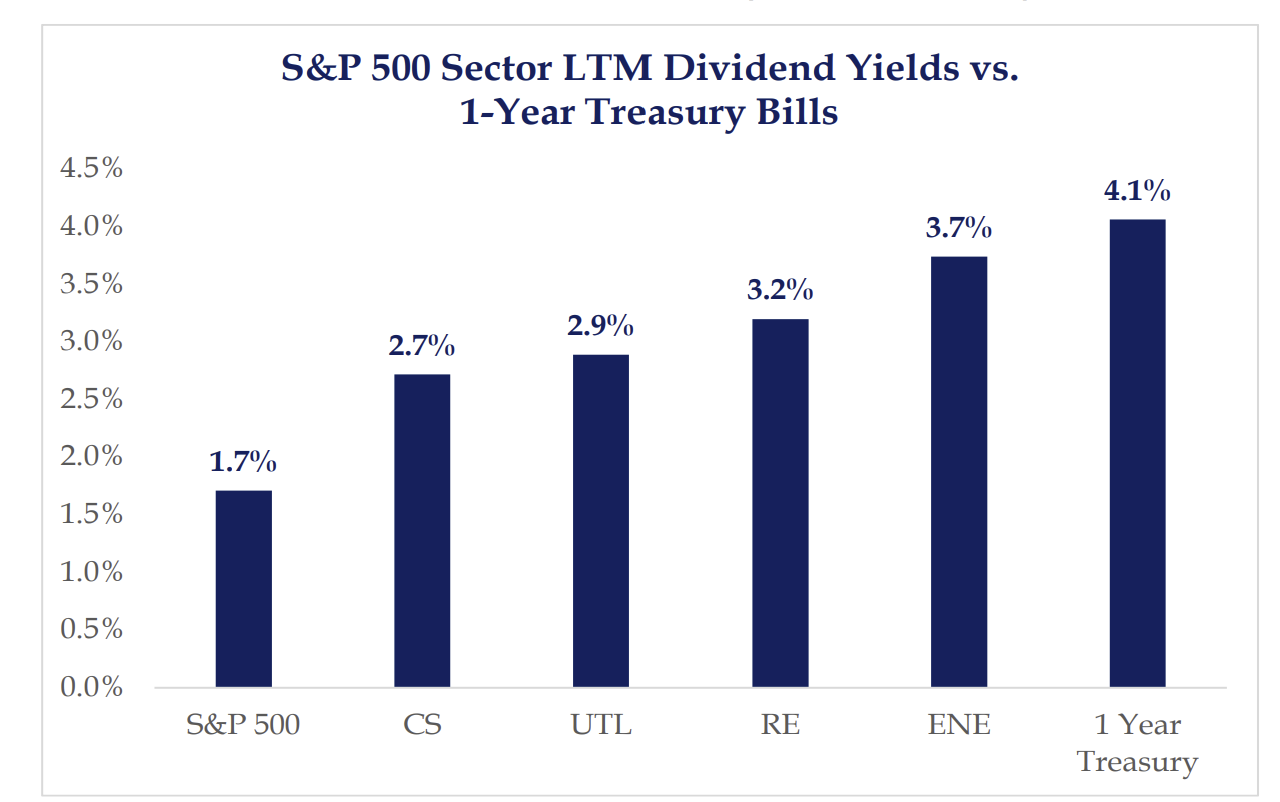 Source: Strategas as of 09.22.2022
John Luke: …yet High Yield investors remain uncompensated for the risk environment
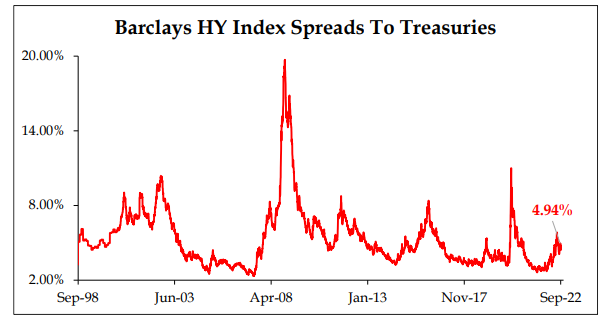 Source: Strategas as of 09.19.2022
Dave: Federal Interest Costs in the US are already rising
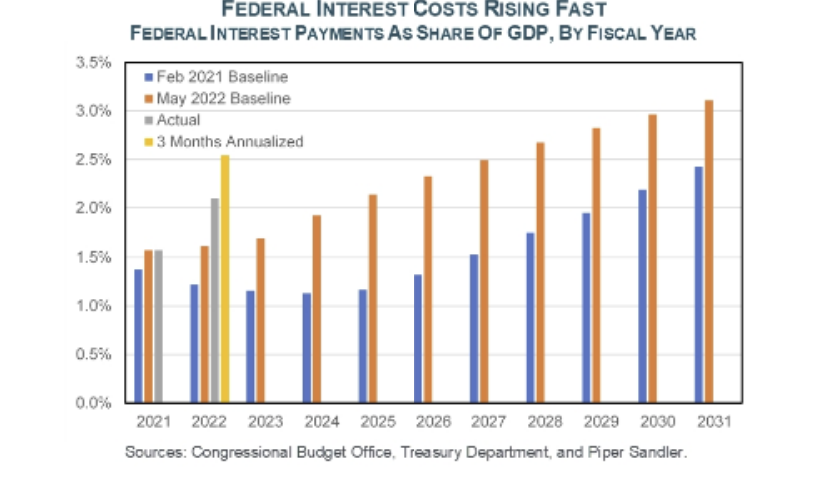 Source: PSC as of 09.21.2022
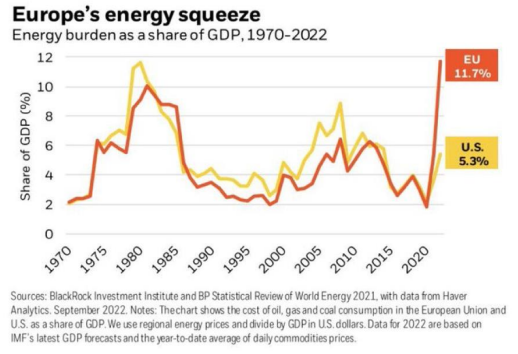
John Luke: …and Europe is facing an ugly winter with unprecedented energy costs
Beckham: Owners’ equivalent rent is just now starting to impact official inflation readings
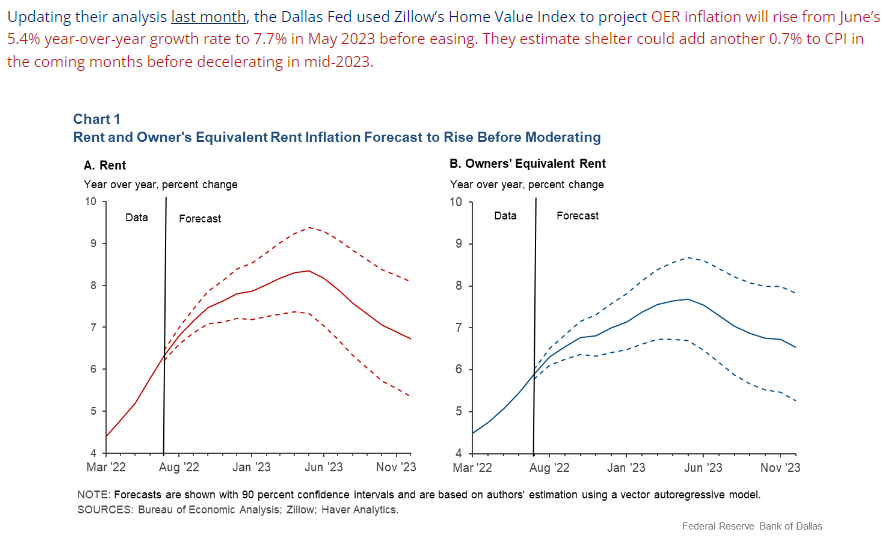 Source: Bianco as of 09.21.2022
Dave: …but optimists hope that money supply reduction starts to dent some of the inflation we’ve seen
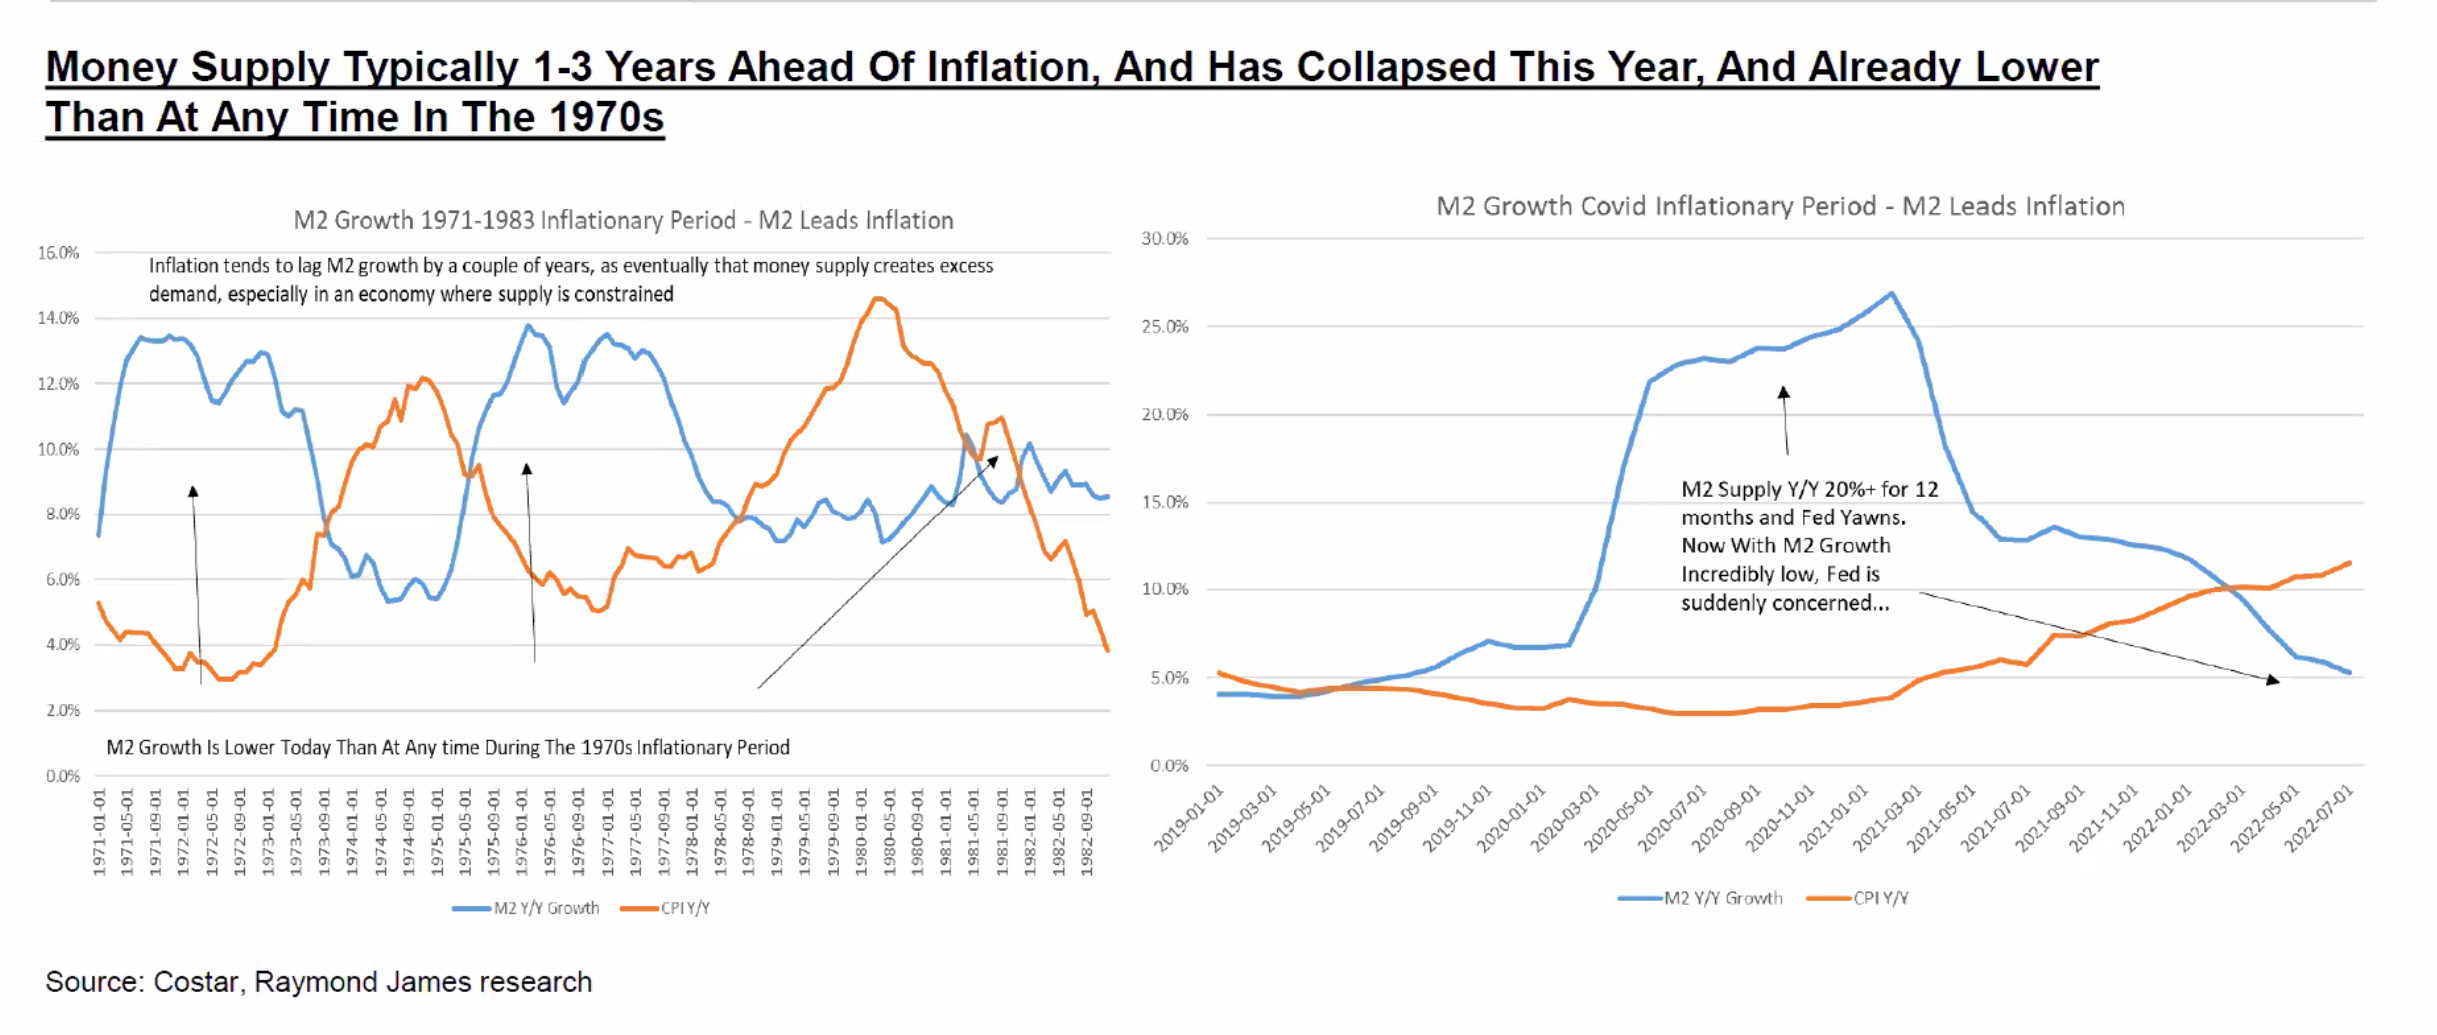 Data as of 09.16.2022
Disclosures
Past performance is not indicative of future results. This material is not financial advice or an offer to sell any product. The information contained herein should not be considered a recommendation to purchase or sell any particular security. Forward looking statements cannot be guaranteed. Projections or other forward-looking statements regarding future financial performance of markets are only predictions and actual events or results may differ materially.
This commentary offers generalized research, not personalized investment advice. It is for informational purposes only and does not constitute a complete description of our investment services or performance. Nothing in this commentary should be interpreted to state or imply that past results are an indication of future investment returns. All investments involve risk and unless otherwise stated, are not guaranteed. Be sure to consult with an investment & tax professional before implementing any investment strategy. Investing involves risk. Principal loss is possible.
The S&P 500® Index is the Standard & Poor’s Composite Index and is widely regarded as a single gauge of large cap U.S. equities. It is market cap weighted and includes 500 leading companies, capturing approximately 80% coverage of available market capitalization.
Advisory services are offered through Aptus Capital Advisors, LLC, a Registered Investment Adviser registered with the Securities and Exchange Commission. Registration does not imply a certain level or skill or training. More information about the advisor, its investment strategies and objectives, is included in the firm’s Form ADV Part 2, which can be obtained, at no charge, by calling (251) 517-7198. Aptus Capital Advisors, LLC is headquartered in Fairhope, Alabama. ACA-2209-22.
