Our team looks at a lot of research throughout each day. A few charts that caught our eye this week, and the way they fit the unfolding puzzle of evidence:
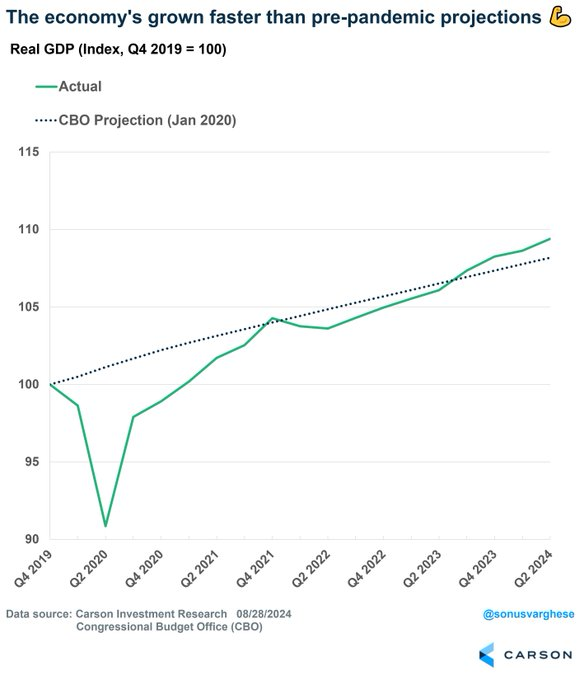
Brian: Despite a rough start to the decade, US growth has actually exceeded pre-COVID projections
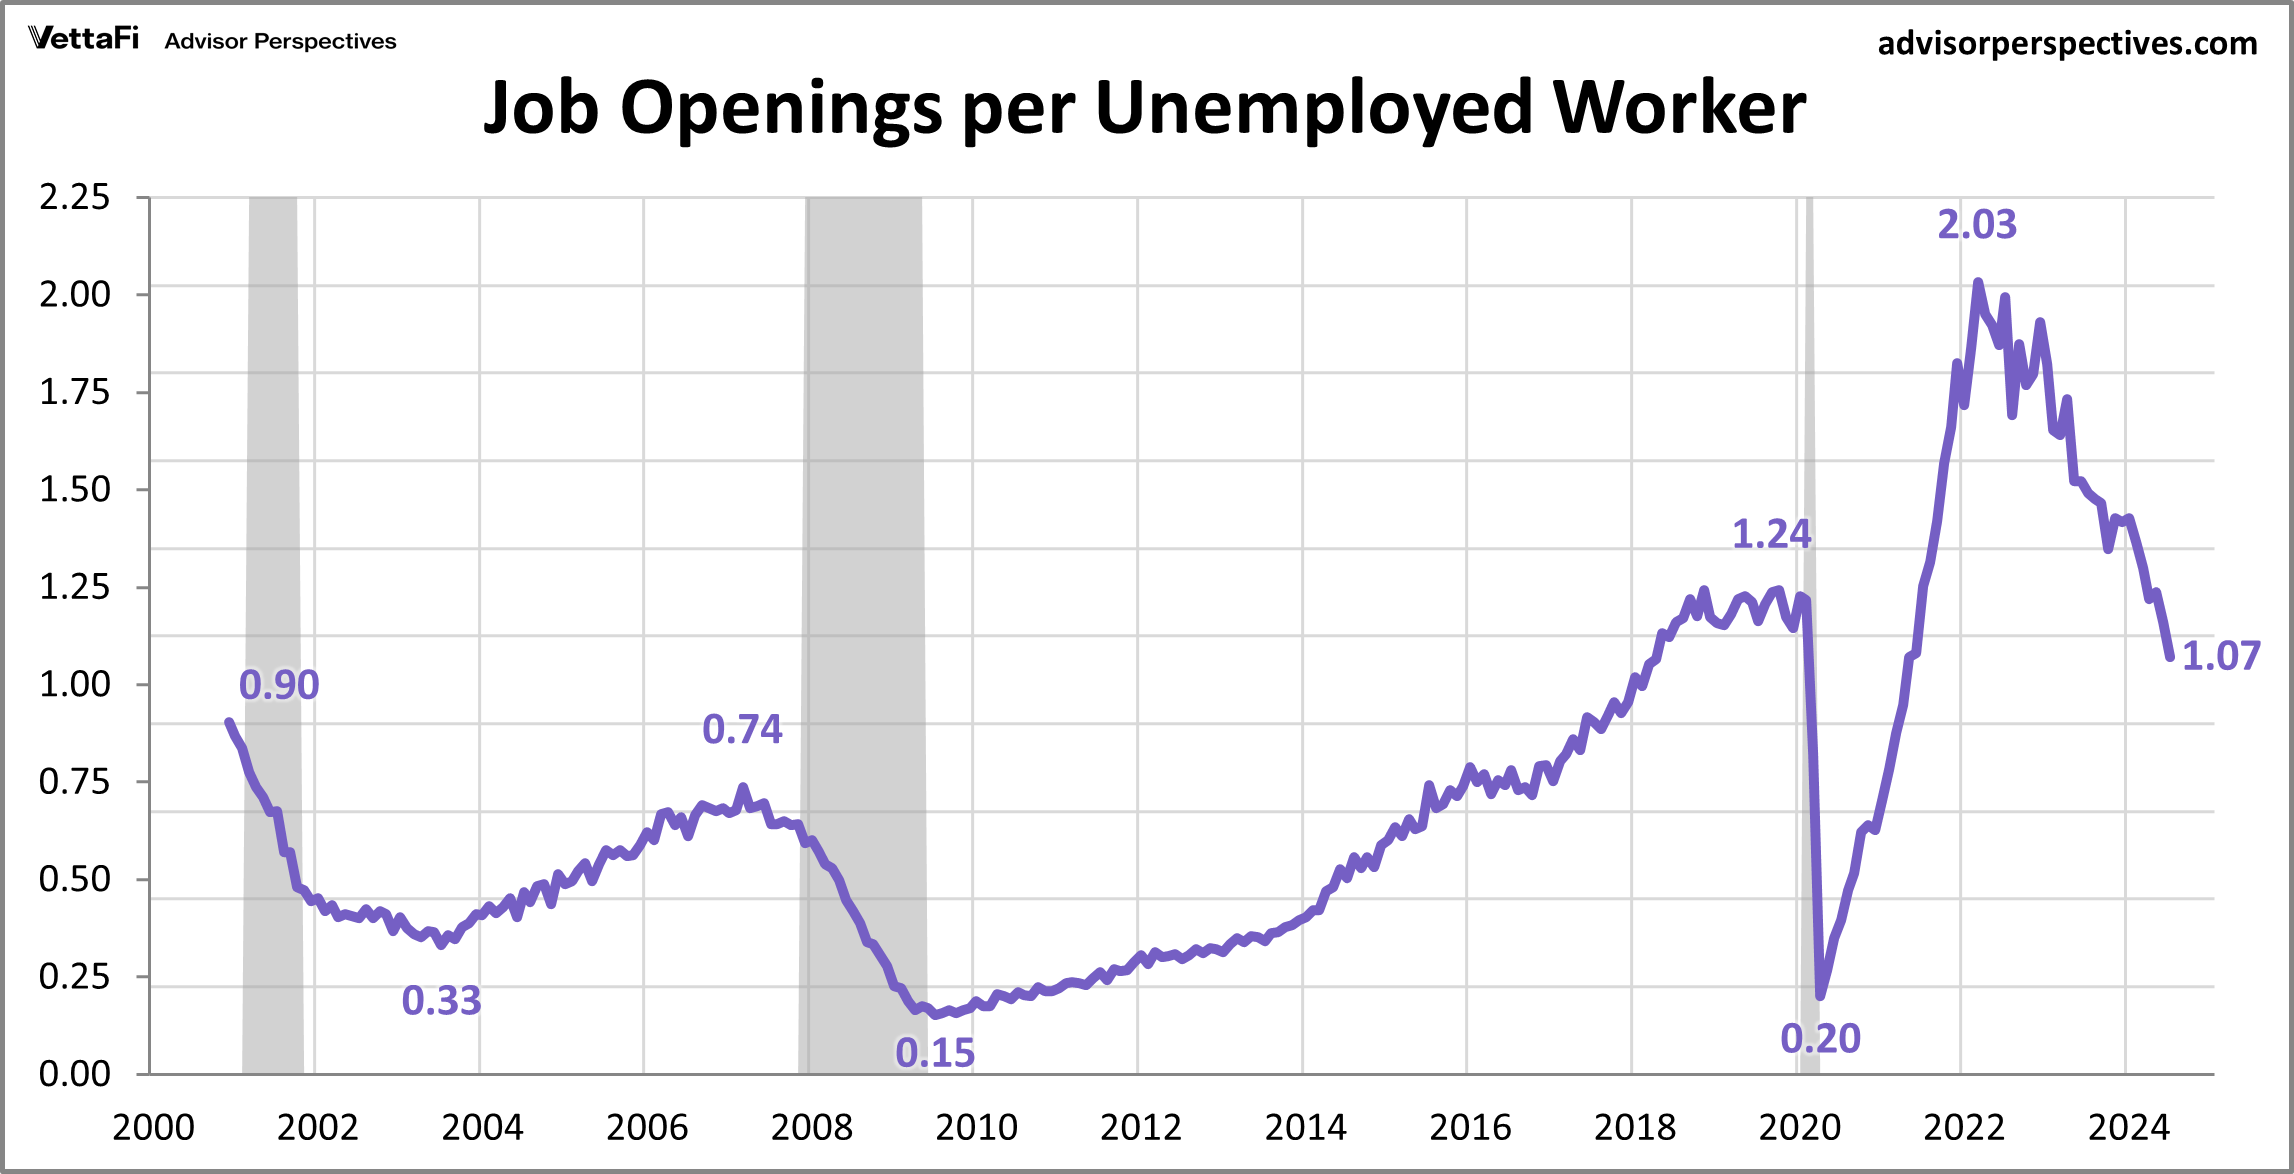
Beckham: though we’ve worked off most of the labor shortage in the past two years
 Data as of August 2024
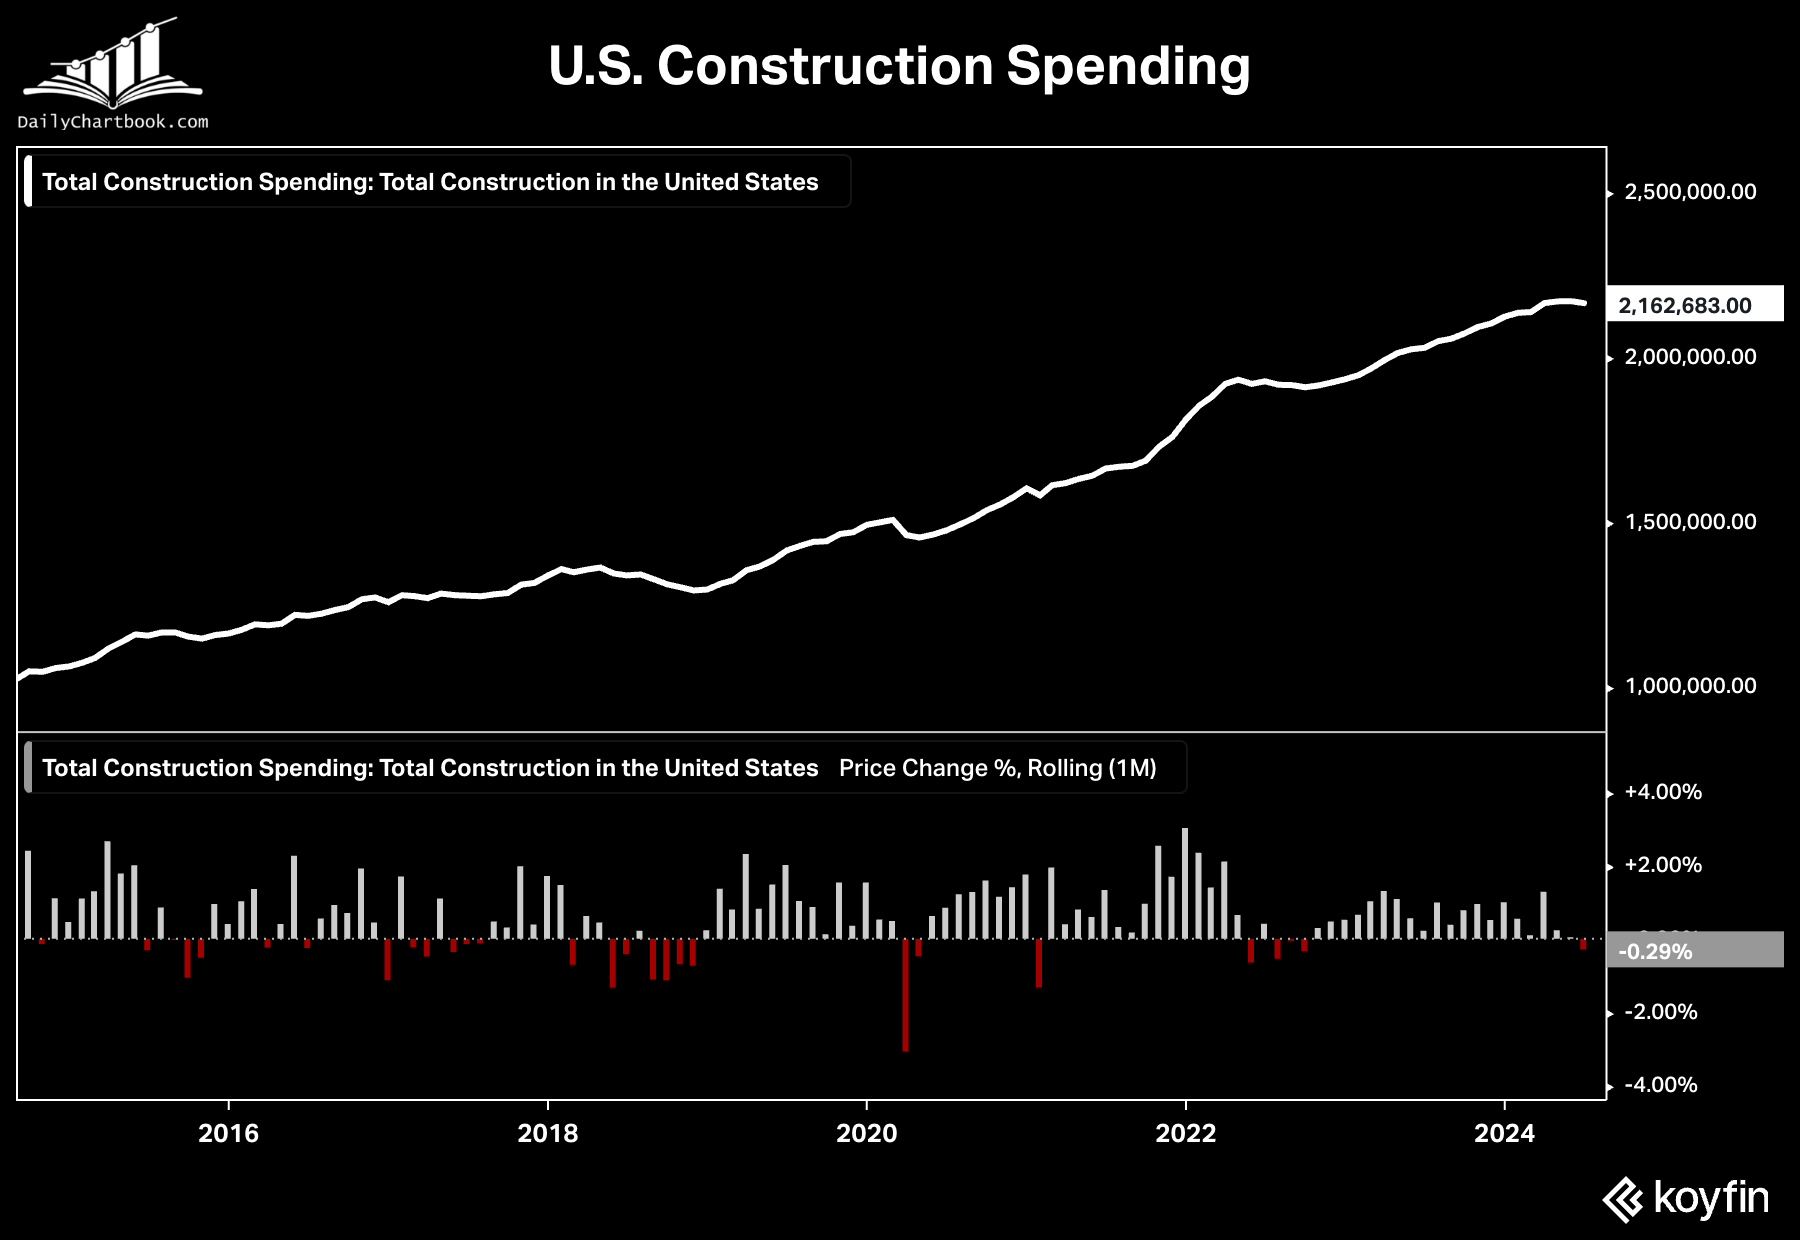
Arch: Construction spending fell in August for the first time since October 2022
 Source: Daily Chartbook as of 09.04.2024
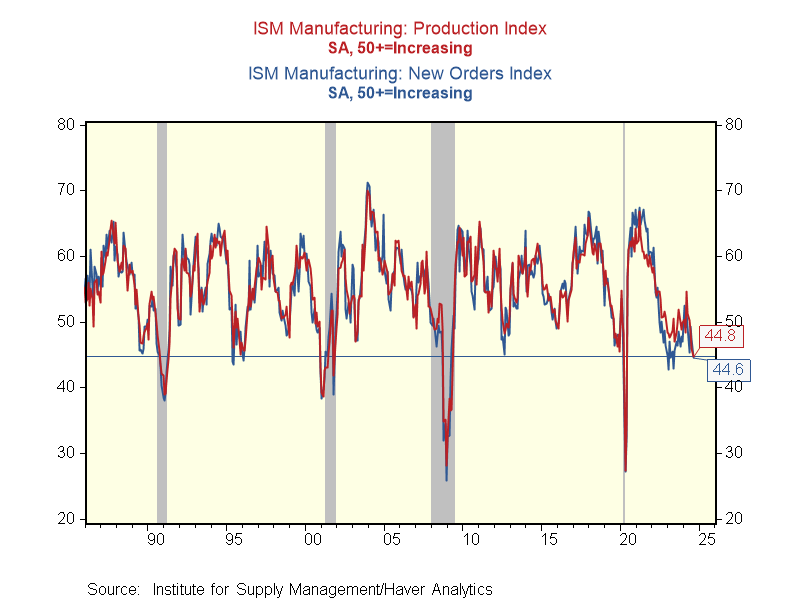
Brett: and signs of weakness are starting to show up in manufacturing data
 Data as of 09.03.2024
John Luke: that said, survey data has often forecasted economic weakness that hasn’t followed through
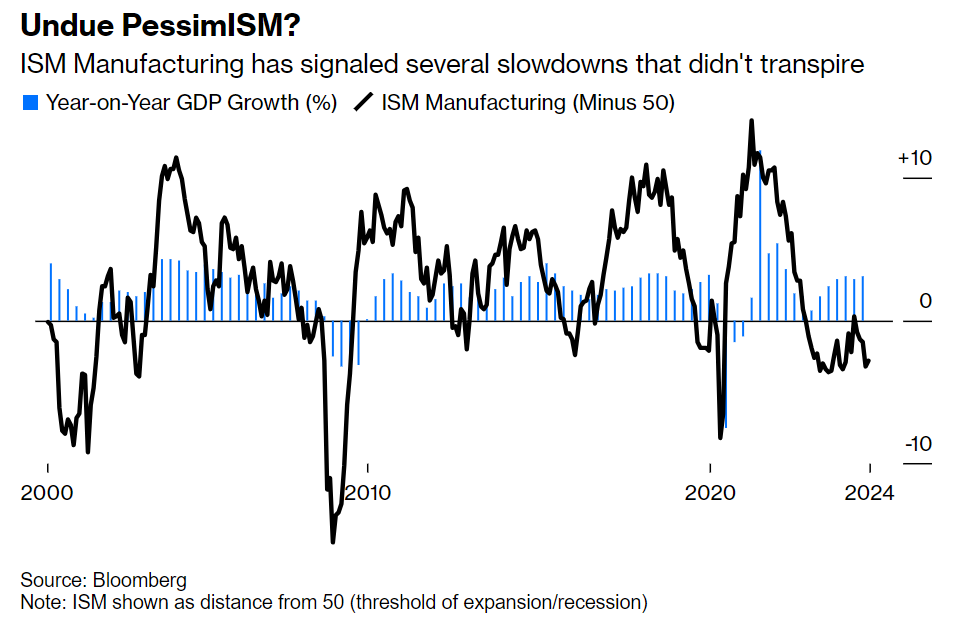 Data as of 09.04.2024
John Luke: With most of the pre-FOMC data behind us, markets are sticking to forecasts of at least 100 bps of cuts this year and another 100 next year
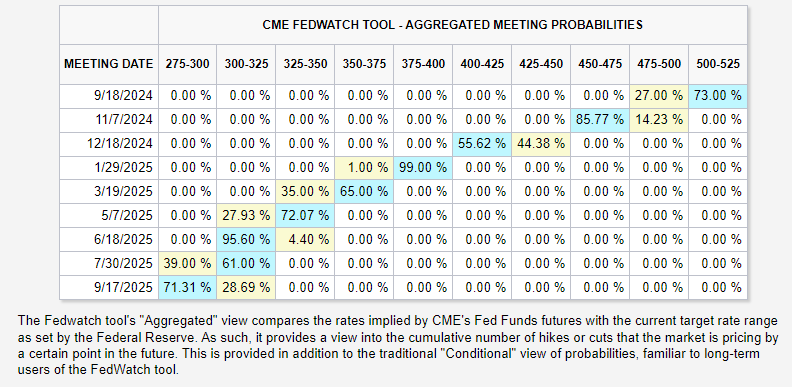 Source: CME FedWatch Tool as of 09.06.2024
Dave: what’s interesting about that is the tendency for actual rate cuts to far exceed initial expectations
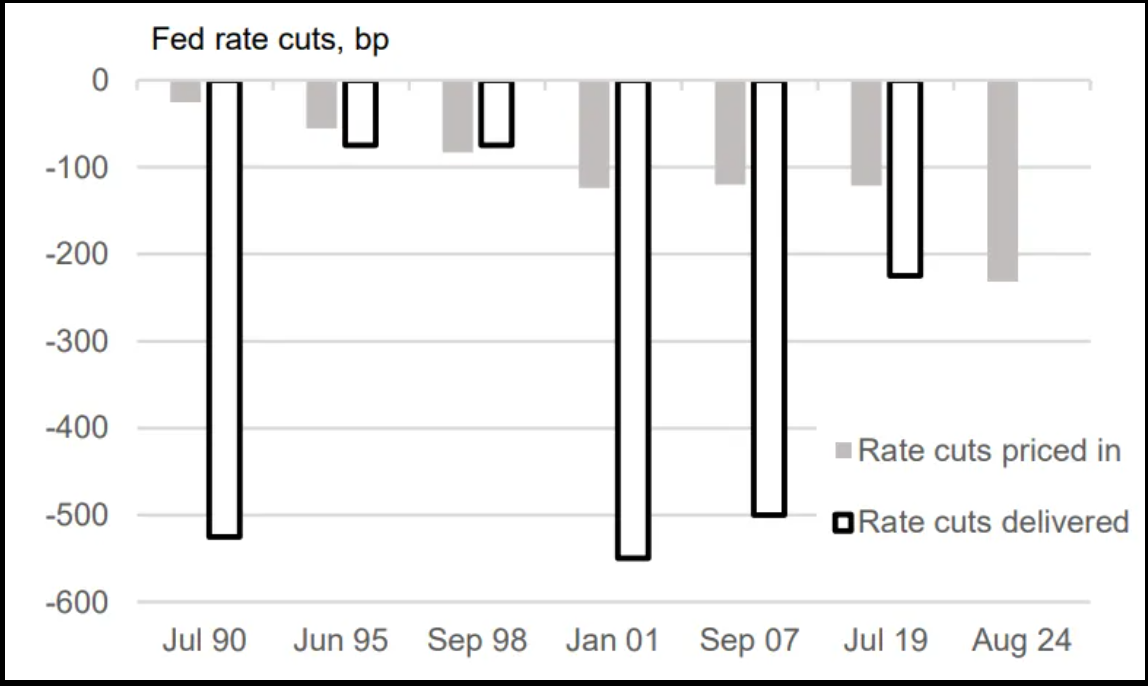 Source: Bloomberg as of 09.05.2024
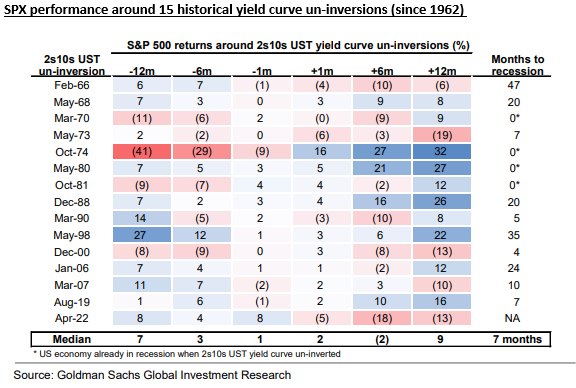
John Luke: The closely-watched 2yr/10yr yield curve has finally broken its lengthy inversion
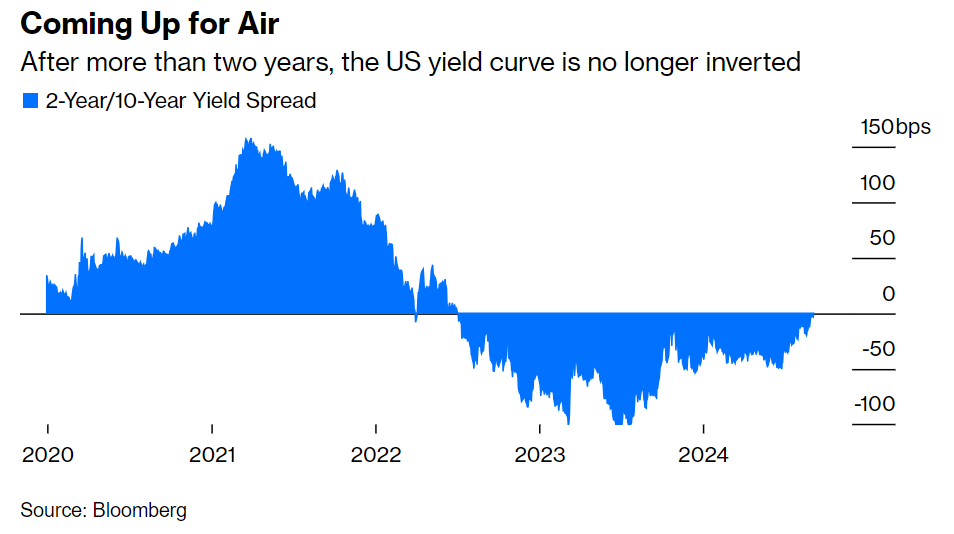 Data as of 09.05.2024
Brian: and the historic record for stocks after breaking the inversion is mixed
 Data as of 09.03.2024
Brad: that said, history also says that where the economy lands is the most likely factor in good vs. bad outcomes for stocks
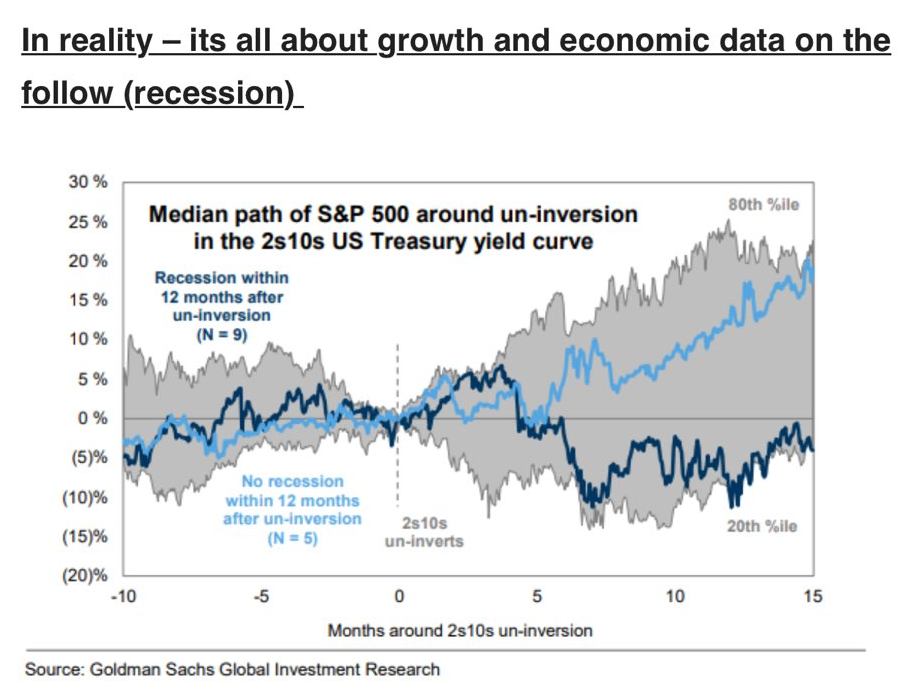 Data as of August 2024
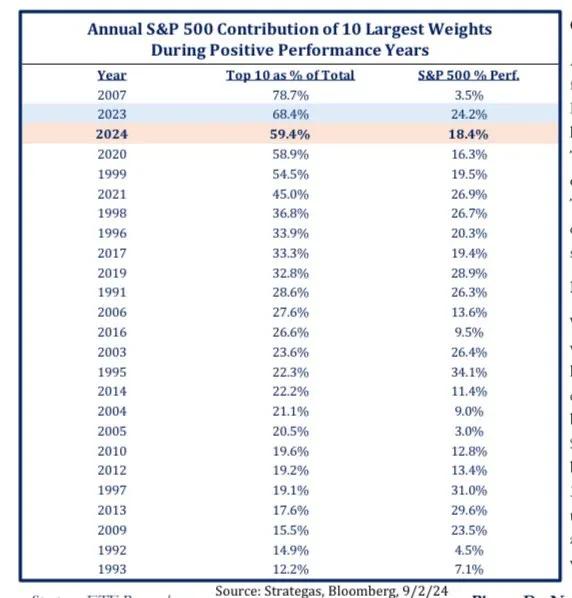
Joseph: The infamous megacap tech stocks are not dominating the broader market the way they had
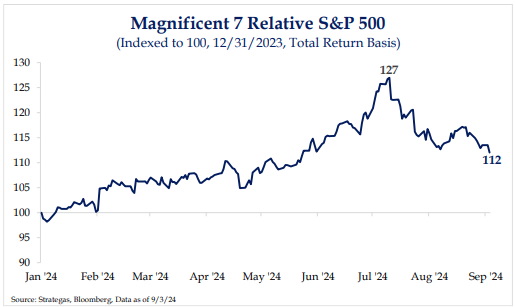
Dave: though they’ve contributed the lion’s share of gains in 2023 and 2024
Joseph: Crude oil is trading near its lowest levels of the past few years
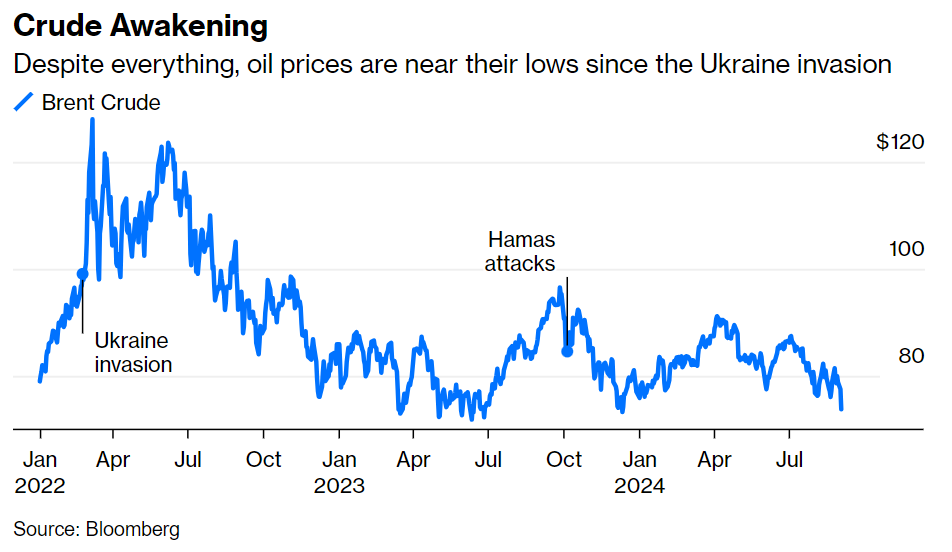 Data as of 09.04.2024
Joseph: partly due to global growth concerns but also from major efficiencies gained in the production process
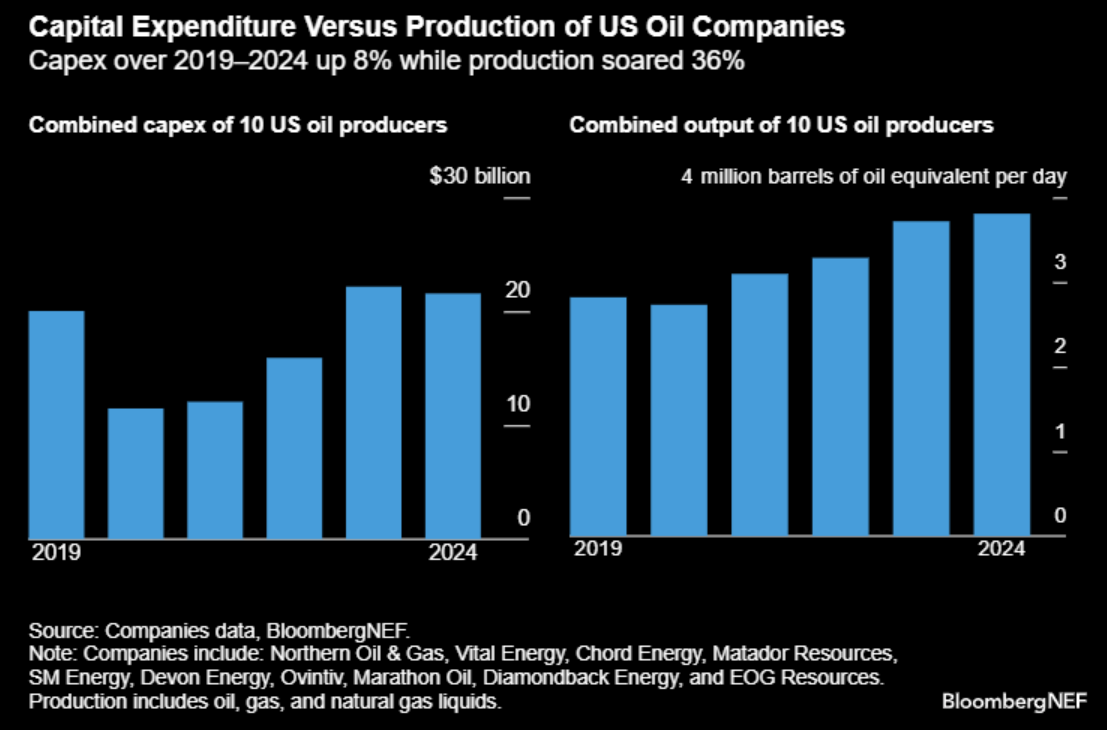 Data as of 09.03.2024
Brad: Q2 earnings season delivered the most volatile company reactions in years
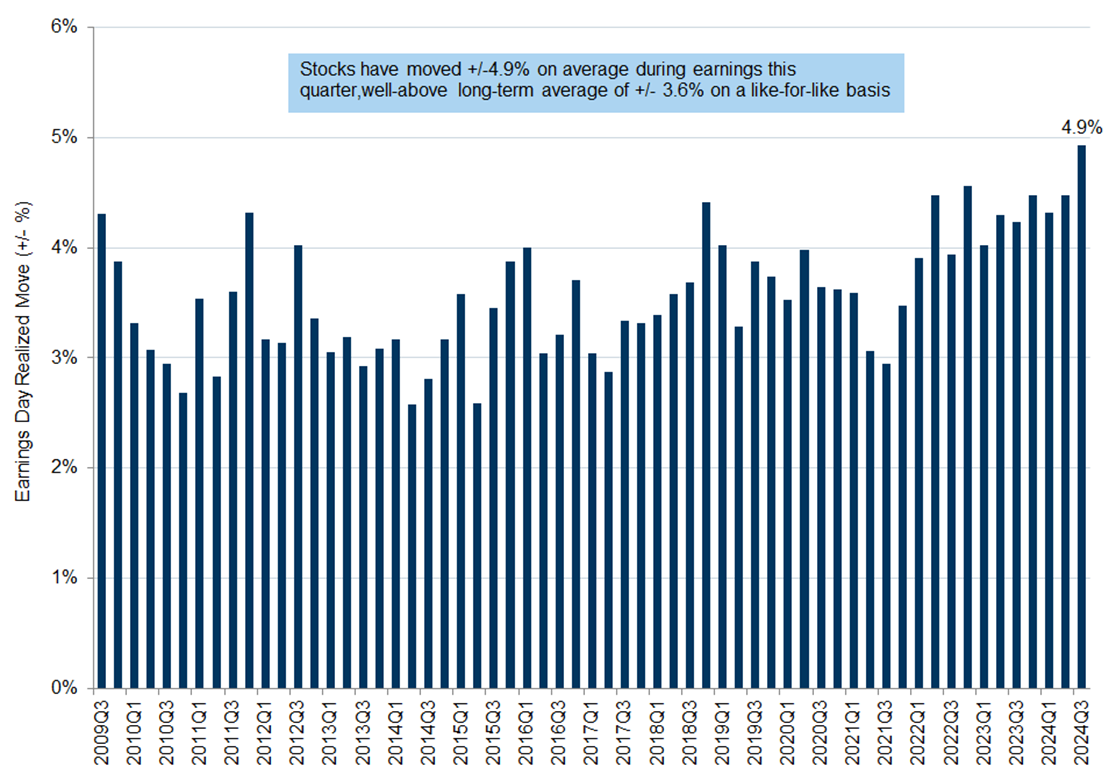 Source: Goldman Sachs as of 08.30.2024
JD: speaking of volatility, leveraged ETFs are among the clearest examples of the “volatility tax” eating away at investor returns
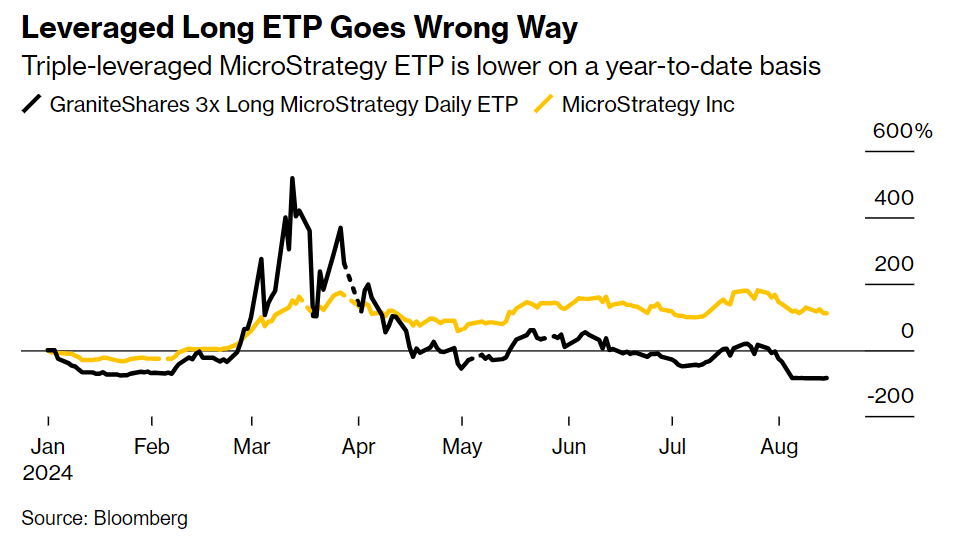 Source: Bloomberg as of 09.03.2024
Disclosures
Past performance is not indicative of future results. This material is not financial advice or an offer to sell any product. The information contained herein should not be considered a recommendation to purchase or sell any particular security. Forward-looking statements cannot be guaranteed.
Projections or other forward-looking statements regarding future financial performance of markets are only predictions and actual events or results may differ materially.
This commentary offers generalized research, not personalized investment advice. It is for informational purposes only and does not constitute a complete description of our investment services or performance. Nothing in this commentary should be interpreted to state or imply that past results are an indication of future investment returns. All investments involve risk and unless otherwise stated, are not guaranteed. Be sure to consult with an investment & tax professional before implementing any investment strategy. Investing involves risk. Principal loss is possible.
Advisory services are offered through Aptus Capital Advisors, LLC, a Registered Investment Adviser registered with the Securities and Exchange Commission. Registration does not imply a certain level or skill or training. More information about the advisor, its investment strategies and objectives, is included in the firm’s Form ADV Part 2, which can be obtained, at no charge, by calling (251) 517-7198. Aptus Capital Advisors, LLC is headquartered in Fairhope, Alabama. ACA-2409-11.
