I’ll start off by reposting JD’s message from the most recent monthly note – it’s a must read on how to mentally handle the current volatility – Thinking Well. Two Parts today:
- Assessing the Market Carnage and Volatility in the Market, and
- Some Firepower to Help with Worried Client Calls
The Market Has Witnessed Record Volatility Lately:
Investors have been on a roller coaster ride of volatility as markets recalibrated expectations for this Federal Reserve tightening cycle. Last Wednesday, Jerome Powell talked down the potential for a 75-basis point hike within the next few meetings, which sent the market higher in an immediate short-covering relief rally. Yet, the next day, investors reassessed the commitment to consecutive 50 basis point hikes at the next ‘couple’ meetings and the 10-year bond yield soared almost 20 basis points over two days, well past 3.0% – we currently sit at just below 3.0%.
The increase in the 10-year bond yields have been increases in the real rate—as the 10-year TIPS yield, which had been sharply in negative territory (-1%) at the beginning of the year, went positive at the end of last week. The higher move in real bond rates cascaded into stock valuations, with more expensive and higher duration growth stocks down the most. Increasing discount rates impacts valuations of all stocks – something we’ve continued to see all year.
It’s no secret that markets have been gyrating over the last few days, as investor’s attention has been focused on inflation. In our opinion, volatility will continue for a while, at least until it becomes clear that we have seen some sort of peak inflation – obviously the timing for that is up for debate – and today’s CPI print likely muddied the water.
I know that we’ve continued to have volatility this week, but let’s focus on last week’s move as it exemplifies the environment we are in, specifically the truly historic moves in the equity market we witnessed last week. The following data doesn’t even include Monday’s -3% move. Stock prices rose 3% last Wednesday after the market read Powell’s comments at the press conference as very dovish, i.e., “we are not considering a 75bps hike”, only to drop 3.6% the following day as unexpectedly high unit labor costs rekindled expectations of a hawkish Fed. Only seven other times since 1970 has the S&P 500 swung more over a two-day period – and this isn’t even taking into consideration the move from Monday.
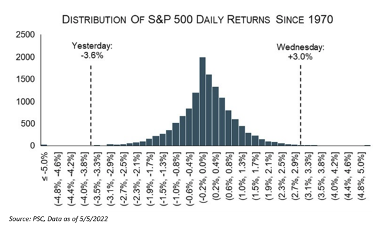
As many of you could imagine – we saw a few of those gyrations during the covid-induced correction. In fact, three of the eight times occurred during that period. Another three periods came during the month following the Lehman collapse in 2008. The final episode was in October 1987 – basically, we are in rarified air.
Furthermore, US Treasury Yields also moved a bunch – but from a comparable standpoint, it was much less volatile than equities. For example, the US 10YR Treasury fell 11bps on Wednesday, only to bounce 10bps the next day. Back-and-forth moves like this happen more often.
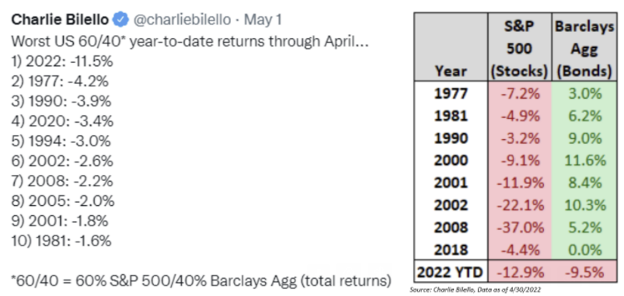
But, when you combine these two events, the last few days were an unprecedented event. It was the first time since 1970 that both equities and treasuries rose so much one day and dropped so much the following day. As John Luke has noted multiple times, during inflationary periods stocks and bonds tend to be more correlated.
THIS TABLE IS WILD:
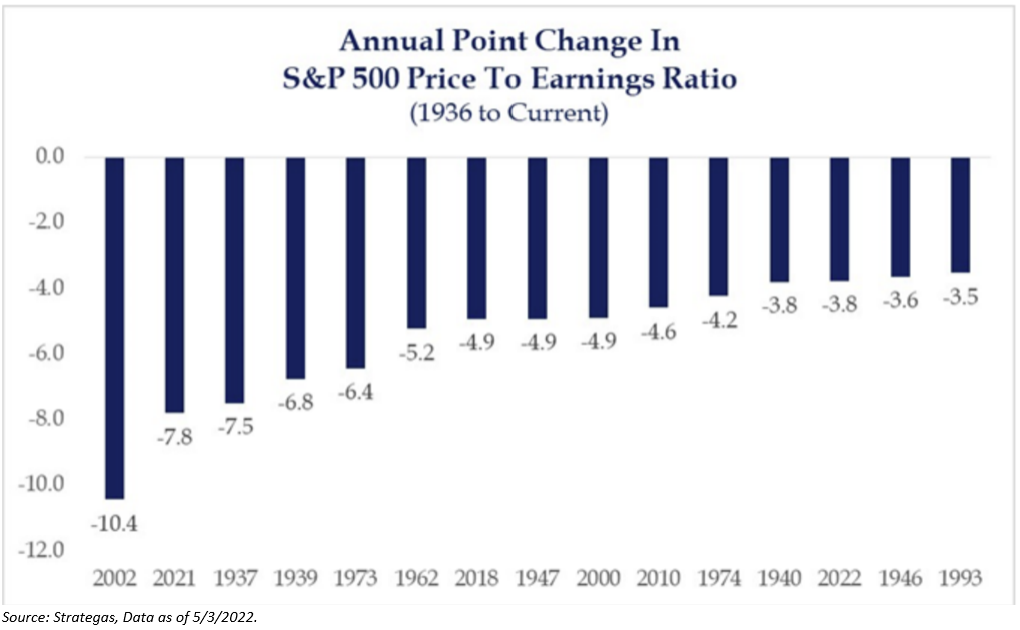
Moving forward, as many of y’all have heard us say, we believe that the “Fed Put” is gone for the foreseeable future. Last year, the Fed took a bet on estimating where inflation would be – they were wrong. Both politically and from a trust standpoint, The Fed can no longer do that, thus it’s likely that the Fed will continue to raise rates – tightening policy – until its preferred measure of inflation, the Core PCE, is closer to their longer-term target. John Luke has said it best – The Fed’s credibility is dependent on its ability to control the problem that they are partially responsible for creating. As we’ve said for quite some time, in the most immediate term, this will likely continue to affect valuations at the market level. For 2022, the S&P 500 multiple has already declined by almost 4.0x turns – multiple contraction is 100% to blame for this year’s pull back.
If there is a continued sell-off in stocks, earnings do seem like the obvious catalyst. As many of you read on a previous musing, many sell-side analysts haven’t lowered EPS estimates – since the beginning of the year, 2022 EPS expectations have increased by almost 7%. One could wonder if current valuations are already pricing in a less rosy slowing EPS expectation.
The market is in unchartered waters right now – this is no secret. As mentioned above, and also during our ’22 Outlook, we believe that volatility is here to stay until the market believes that inflation has peaked. Volatility tends to be associated with downturns, but remember, the market can be volatile to the upside too. Luckily, we are prepared for volatility if it goes in either direction – both at the fund level, and also at the asset allocation level.
The Failure to Stay Invested:
We understand, given Monday’s market move, that everyone is most likely seeing an increase of inbound calls. We know that we beat a dead drum here, but it’s always a good reminder to go over the importance of staying in the market.
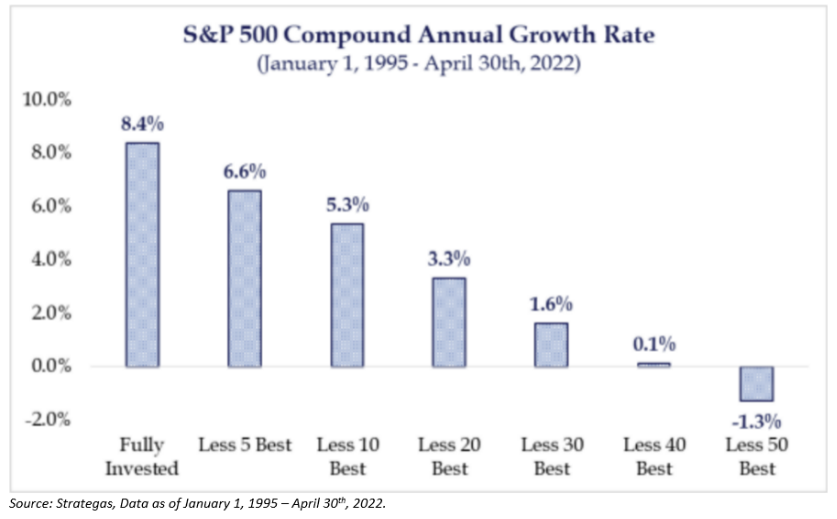
- It Pays to Remain Invested – There may be a myriad of reasons for not staying invested, but we believe it is typically an individual’s fear of a large drawdown, or an attempt to time the market. Both can be detrimental to portfolio returns and increase longevity risk within portfolios. To prove this – just look at the chart below depicting returns if we exclude some of the best days in the market:
- Remember to Expand Your Time Horizon – No one ever knows that the market is going to do – especially on a daily basis – we know that volatility tends to breed more volatility – whether it’s up or down. In our view, investors also tend to focus too much on the short-term “noise” in the market. There is usually great deal of variability in the day-to-day, with different economic, geopolitical, and company-specific news constantly moving markets. We believe the best method for loss avoidance is to expand your time horizon. Let’s take another look at the numbers:
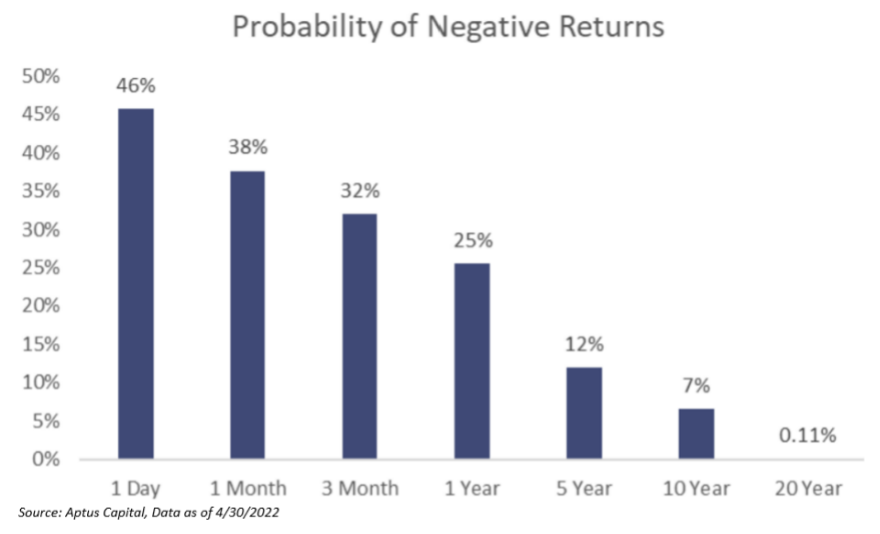
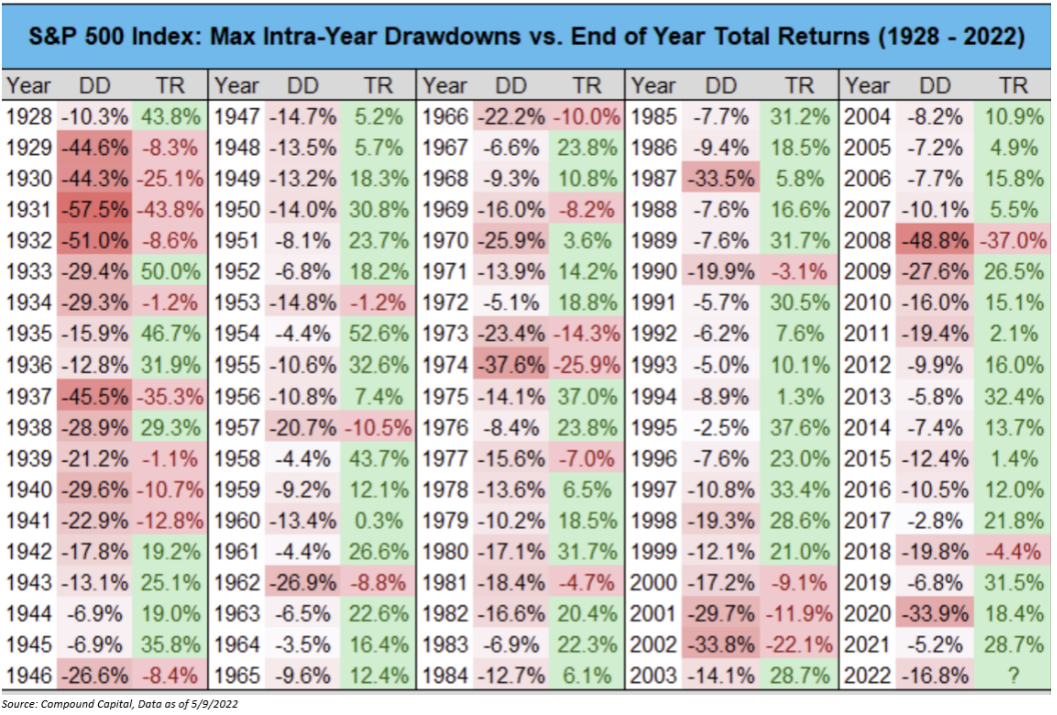
- These Max Intra-Year Drawdowns are Normal – The S&P 500 has returned 10% annualized since 1928 with an average intra-year drawdown of -16.3% (we’re at -16.8% this year). There’s no upside without downside, no reward without risk. Maintain the plan.
Investor behavior is exceedingly difficult to change. We believe the numbers are clear, but these are complex behavioral and financial decisions – volatility in one’s hard earned assets is emotional – that’s why JD’s Thinking Well piece is so important.
Disclosures
Past performance is not indicative of future results. This material is not financial advice or an offer to sell any product. The information contained herein should not be considered a recommendation to purchase or sell any particular security. Forward looking statements cannot be guaranteed.
This commentary offers generalized research, not personalized investment advice. It is for informational purposes only and does not constitute a complete description of our investment services or performance. Nothing in this commentary should be interpreted to state or imply that past results are an indication of future investment returns. All investments involve risk and unless otherwise stated, are not guaranteed. Be sure to consult with an investment & tax professional before implementing any investment strategy. Investing involves risk. Principal loss is possible.
The S&P 500® is widely regarded as the best single gauge of large-cap U.S. equities. There is over USD 11.2 trillion indexed or benchmarked to the index, with indexed assets comprising approximately USD 4.6 trillion of this total. The index includes 500 leading companies and covers approximately 80% of available market capitalization.
The Bloomberg Barclays U.S. Aggregate Bond Index is a broad-based benchmark that measures the investment grade, U.S. dollar-denominated, fixed-rate taxable bond market. This includes Treasuries, government-related and corporate securities, mortgage-backed securities, asset-backed securities and collateralized mortgage-backed securities
The core PCE price index measures the prices paid by consumers for goods and services without the volatility caused by movements in food and energy prices to reveal underlying inflation trends.
No representation is being made that any model or model mix will achieve results similar to that shown and there is no assurance that a model that produces attractive hypothetical results on a historical basis will work effectively on a prospective basis.
Advisory services are offered through Aptus Capital Advisors, LLC, a Registered Investment Adviser registered with the Securities and Exchange Commission. Registration does not imply a certain level or skill or training. More information about the advisor, its investment strategies and objectives, is included in the firm’s Form ADV Part 2, which can be obtained, at no charge, by calling (251) 517-7198. Aptus Capital Advisors, LLC is headquartered in Fairhope, Alabama. ACA-2205-12.
