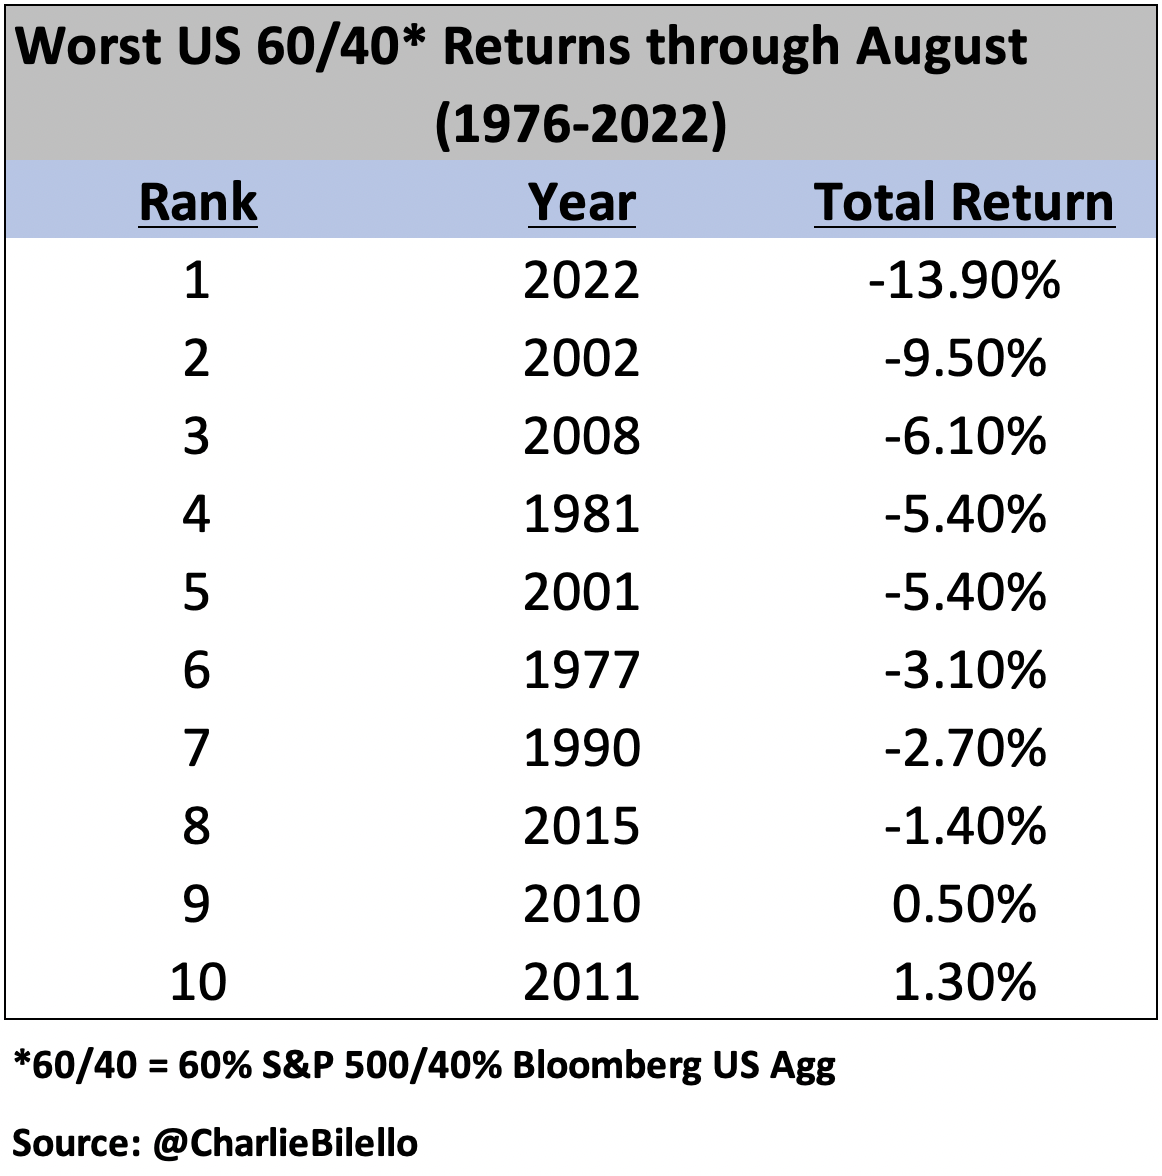
With stocks and bonds both down year-to-date (YTD), there have been very few places for investors to hide. In fact, through August, the 60/40 portfolio is having its worst year ever going back to 1976 (data as of 8/31/22):
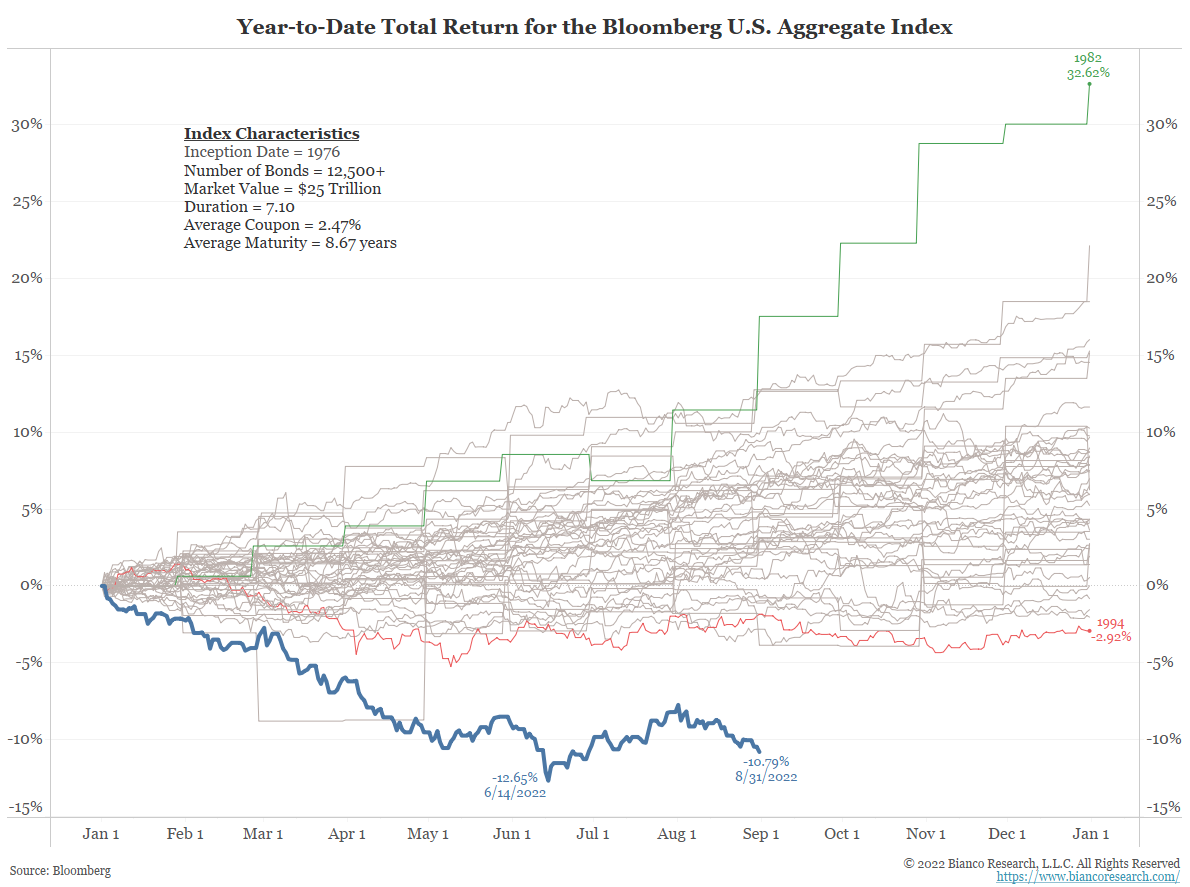
Specifically, within fixed income, duration-sensitive bonds have been crushed. The entire interest rate curve has experienced an extreme shift up in rates, sending the Bloomberg US Aggregate Bond index (6.4yr duration) down 10.79% through August. The two-year treasury entered the year yielding 73bps; by the end of August, it had climbed to 3.49%, a high going back to 2007!
 Data as of 09/01/22
Coming in to 2022, the combination of expected rate increases and low current yields (the 12-month yield on AGG at year-end 2021 was 1.77%) sent some investors into shorter-duration High Yield, which on a relative basis, proved to be a good call.
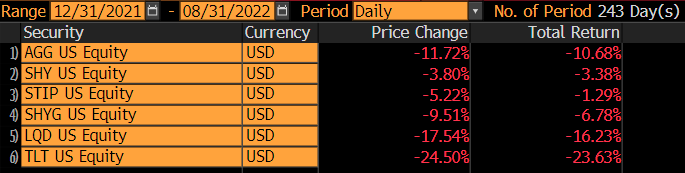 Source: Bloomberg, LP, highlighting YTD returns as of 8/31/22; AGG – iShares Core US Aggregate Bond; SHY – iShares 1-3 Year Treasury Bond; STIP – iShares 0-5 Year TIPS Bond; SHYG – iShares 0-5 Year HY Corporate Bond; LQD – iShares iBoxx IG Corporate Bond; TLT – iShares 20+ Year Treasury Bond
High Yield spreads haven’t necessarily been spared this year, having widen from ~300bps to ~600bps, though they have since come in to around 500bps.
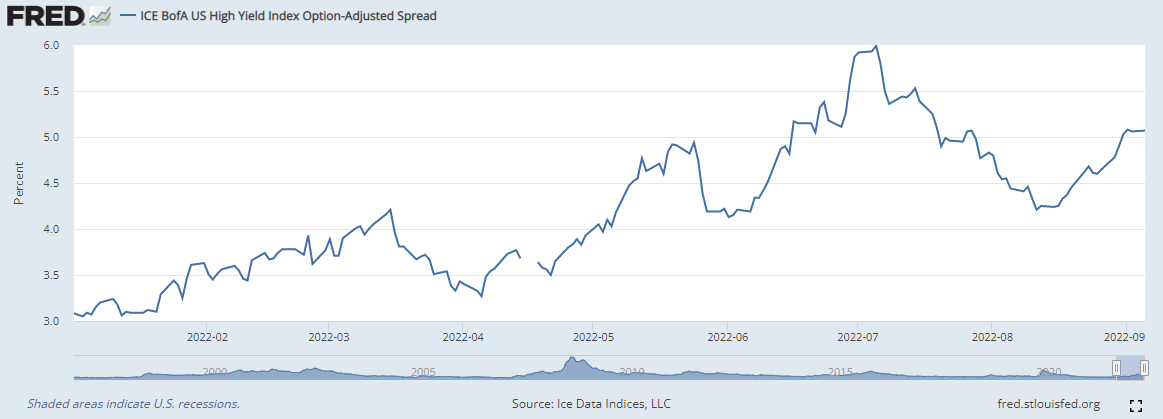 Highlighting YTD HY Option-Adjusted Spread movements through 9/6/22
With that said, we’d be hesitant to pour into High Yield at this juncture. For starters, many indicators are flashing signs of economic caution, from a severely inverted yield curve, to declines in PMI data (Purchasing Managers Index, currently 52.8, down from 63.7 in March 2021), to negative analysts’ earnings revisions for this year and next, to declining commodity prices (Bloomberg Commodity Index -14% from its June 9th high through September 6th). While spreads moving +200bps YTD may seem punishing, it doesn’t approximate the type of move seen in past recessionary periods.
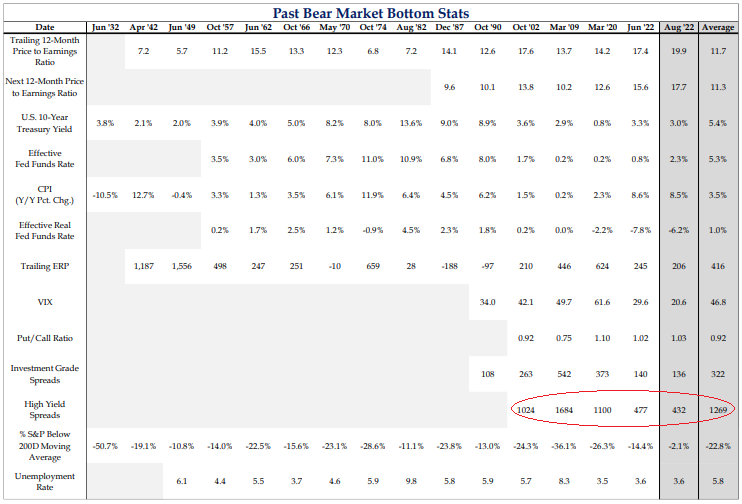 Source: Strategas Securities, LLC 8/22/22; emphasis added
Second, the Federal Reserve has just begun its endeavor into unwinding the massive balance sheet additions it accumulated since 2020. This process, known by market participants as Quantitative Tightening, is set to increase to $95B in securities per month starting in September. PGM Global points out, “As QT starts to take full effect in the coming weeks, investors should position for tighter conditions in the HY market, especially if oil prices continue to fall.” (PGM notes oil prices because energy sector HY debt has been remarkably resilient over the last 12 months after having trailed within junk credit since 2014.) Historically, tighter conditions have been a harbinger for higher spreads.
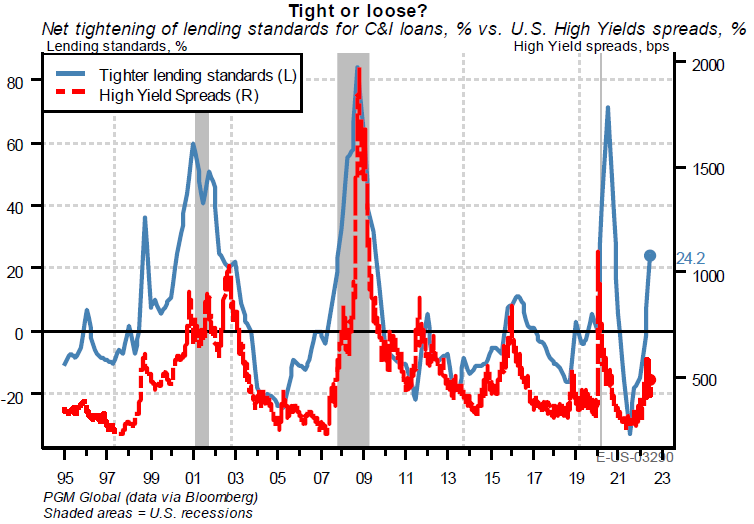 Highlighting lending standards vs HY spreads, as of 9/1/22
Within High Yield, we’d especially caution exposure to the most dicey cohort of credits, those rated single-B and below. While interest coverage ratios among BB issuers appear especially healthy, CCC credits are near the lows seen over the past couple decades.
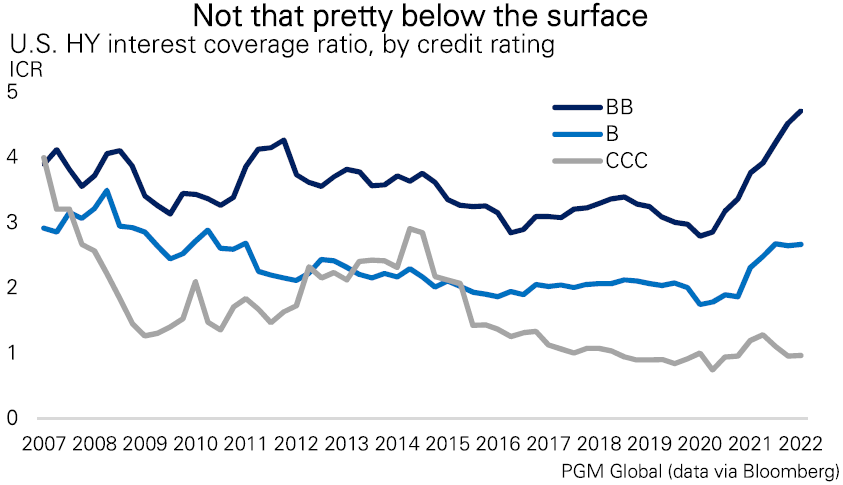
Highlighting interest coverage ratio, as of 2Q’22
Even single B rated bonds, which have shown an uptick in balance sheet quality, aren’t worth the risk when compared to their BB brethren.
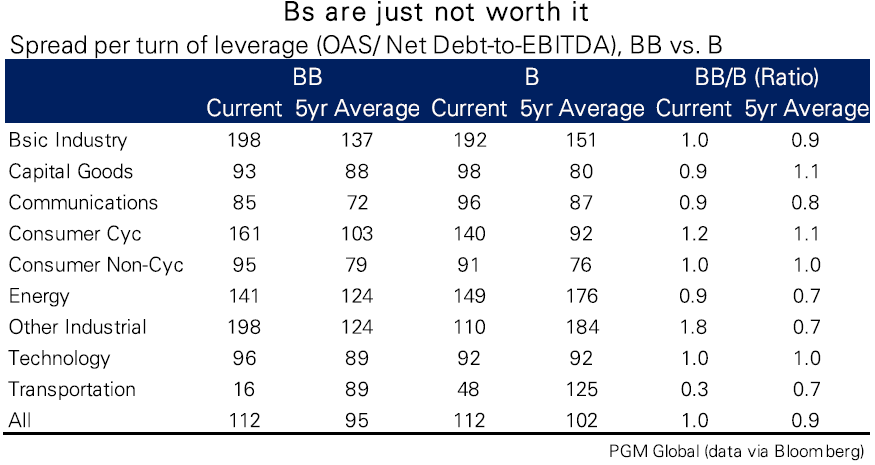 Source: PGM Global 09.01.22. Highlighting HY Option-Adjusted Spread (as of 9/1/22) vs Net Debt-to-EBITDA (as of 2Q’22)
Conclusion
In closing, let’s review the four drivers of fixed income returns:
- Duration: bond price sensitivity to an immediate 1% move in interest rates
- Convexity: change in duration based on a change in interest rates
- Coupon: interest income paid by the issuer
- Credit: interest spread paid over the risk-free rate to compensate for the borrowing quality of the issuer
We’ve discussed duration, how rising interest rates have led to big losses in fixed-rate bonds YTD, contributing to historic losses in the 60/40 portfolio. Given the cracks showing up in economic data and the Fed’s stated intent to crush inflation by tightening financial conditions, we don’t believe credit-sensitive fixed income currently has a place within a prudent investor’s portfolio.
While credit spreads have widened YTD, and are therefore more attractive than they were entering 2022, we believe that history shows there is more pain to come. If that ends up being the case, high yield won’t be the place to hide; the slightly higher juice (coupon) being paid won’t be worth the squeeze.
Disclosures
Past performance is not indicative of future results. This material is not financial advice or an offer to sell any product. The information contained herein should not be considered a recommendation to purchase or sell any particular security. Forward looking statements cannot be guaranteed.
This commentary offers generalized research, not personalized investment advice. It is for informational purposes only and does not constitute a complete description of our investment services or performance. Nothing in this commentary should be interpreted to state or imply that past results are an indication of future investment returns. All investments involve risk and unless otherwise stated, are not guaranteed. Be sure to consult with an investment & tax professional before implementing any investment strategy. Investing involves risk. Principal loss is possible.
Material presented has been derived from sources considered to be reliable, but the accuracy and completeness cannot be guaranteed.
The Bloomberg Barclays US Aggregate Bond Index is a broad-based flagship benchmark that measures the investment grade, US dollar-denominated, fixed-rate taxable bond market. The index includes Treasuries, government related and corporate securities, MBS (agency fixed-rate pass-throughs), ABS and CMBS (agency and non-agency).
Bloomberg Commodity Index (BCOM) is calculated on an excess return basis and reflects commodity futures price movements. The index rebalances annually weighted 2/3 by trading volume and 1/3 by world production and weight-caps are applied at the commodity, sector and group level for diversification.
Advisory services are offered through Aptus Capital Advisors, LLC, a Registered Investment Adviser registered with the Securities and Exchange Commission. Registration does not imply a certain level or skill or training. More information about the advisor, its investment strategies and objectives, is included in the firm’s Form ADV Part 2, which can be obtained, at no charge, by calling (251) 517-7198. Aptus Capital Advisors, LLC is headquartered in Fairhope, Alabama. ACA-2209-7.
