In some ways, the midterm elections have been demoted in importance as investors have been concentrating on Federal Reserve policy. It has been well-documented how markets have fared during previous midterm election years. However, the macro backdrop is quite dissimilar from recent midterm elections – high inflation, an ultra-strong dollar, as well as an unheard-of pace of rate tightening by the Fed. Traditionally speaking, the incumbent party has the most to lose, so we’ll see if this year is any different relative to years previous.
What is At Stake?
What a difference four years make! There has been an absolute sea-change to the macro-outlook for the US ahead of the Midterms. Roaring inflation has replaced Disinflation, the Fed is Hawkish and not cautious while a Democratic President is in the White House. The 2022 US Midterms ballots will include:
- All 435 House Seats,
- 35 of the 100 Senate Seats, and
- 36 out of the 50 States will elect governors.
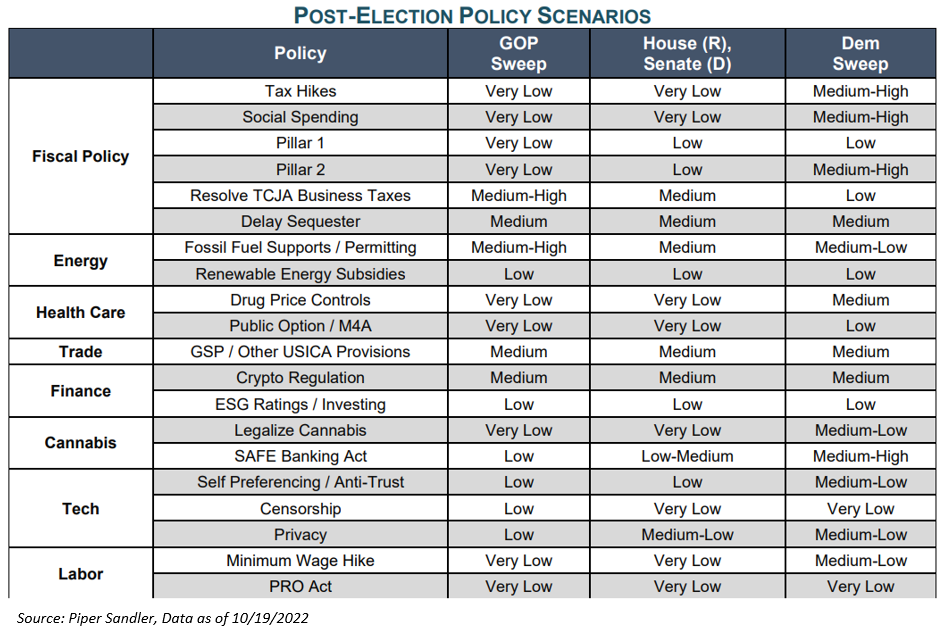
In general, the incumbent party (the Democrats) would be expected to lose ground, and given the more difficult backdrop for US households, the Democrats would be anticipated to perform poorly. However, recent polls have shown the Democrats holding up well in the Senate, while most have them losing the House. Possible outcomes:
- Democrats Sweep – Tax hikes to pay for social spending are back on the table.
- Republicans Sweep – Defense spending could go up more and a modest energy infrastructure permitting bill and extension of certain business tax breaks is incrementally more likely.
- Republicans Win Only the House – Tax hikes are dead in the water and defense spending is likely headed higher.
- Significant GOP Gains in both House & Senate – This could make a Democratic sweep in 2024 a long shot, which could lift a cloud over the entire health sector as Medicare for All / the public option would have no chance of passing for the foreseeable future.
The Market and Midterms
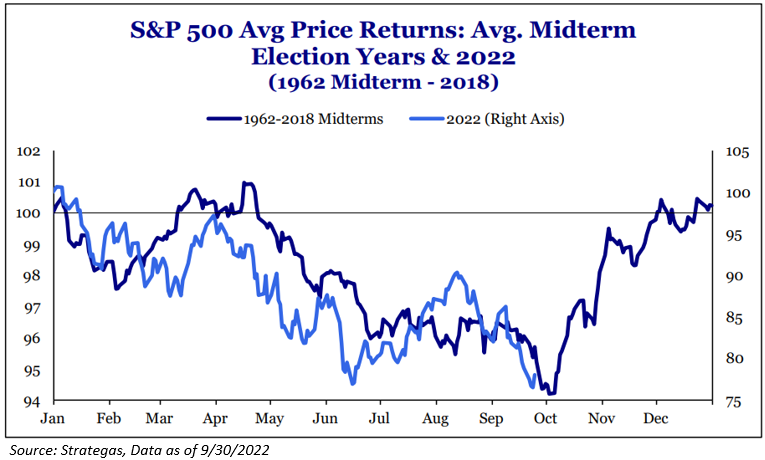
Midterms have historically been the most volatile year for stocks in the four-year election cycle. The average intra-year decline for the S&P 500 in a midterm election year is ~19%, much higher than the 12%-13% average in the first, third, and fourth years of the cycle. When you put this year’s drawdown of 25% into context, it’s not completely out of the norm. But we would like to state that it’s the third worst YTD period heading into an election – only being beaten by 2002 (-28.99%) and 1974 (34.86%).
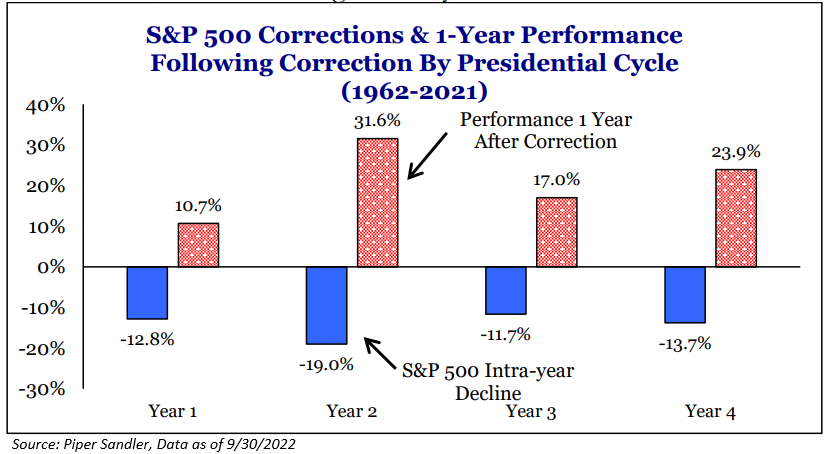
The good news is that midterm election year volatility has usually turned into an opportunity for investors, with the S&P 500 positive in the 12 months following a midterm election every time since 1942. Why do we think this happens? Historically, midterm election years have coincided with tightening monetary policies and residing Presidents tend to pursue an anti-growth policy to rally their bases. Then, Presidents tend to suffer large midterm election losses, and the equity market begins to anticipate better monetary and fiscal policy in the year following a midterm election.
Let’s play devil’s advocate, the big question is whether this time is different. Investors argued in September 2010, 2014, and 2018 that “other factors” would prevent this from being the case, and, in each case, stocks were higher one year later. But these events happened with low inflation. Monetary and fiscal policy is far more constrained to help the economy today with inflation elevated. The two major instances when stocks did not rally into the midterms are 1974 and 1978, both periods of increasing inflation. Still, stocks were higher one year later from their midterm election dates.
Let’s review that last fact – “stocks have always been higher in the following twelve months after a midterm election”. I’ve always been a skeptic of chart crimes, so let’s look at this data. First, there has never been a recession in the third year of the four-year election cycle. This obviously could skew the data. But is this a coincidence? Possibly. Or could it be the fact that Presidents historically lose 29-30 House seats in their first midterm election. This loss can make the president begin to think about their own re-election in two years, and lead to efforts to prime the fiscal pump in year 3.
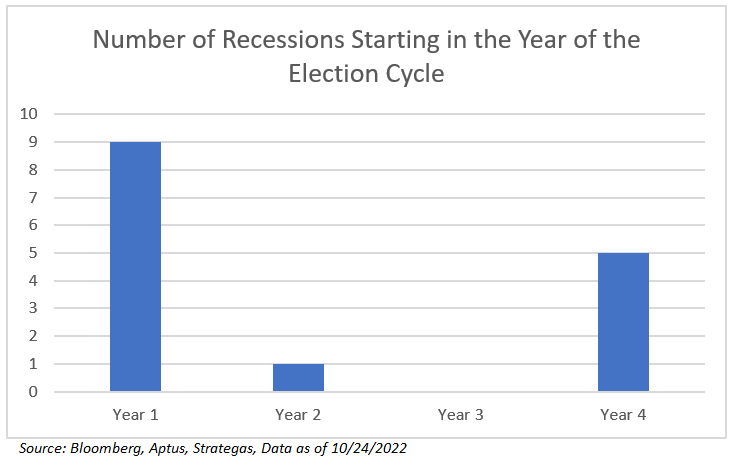
Better fiscal and monetary policy post-election has helped avoid recessions, but, as many of us know, there is less flexibility for policy in an elevated inflation environment like we have today. So, we’ll see if this time is any different.
Remember, Politics and the Markets Don’t Mix
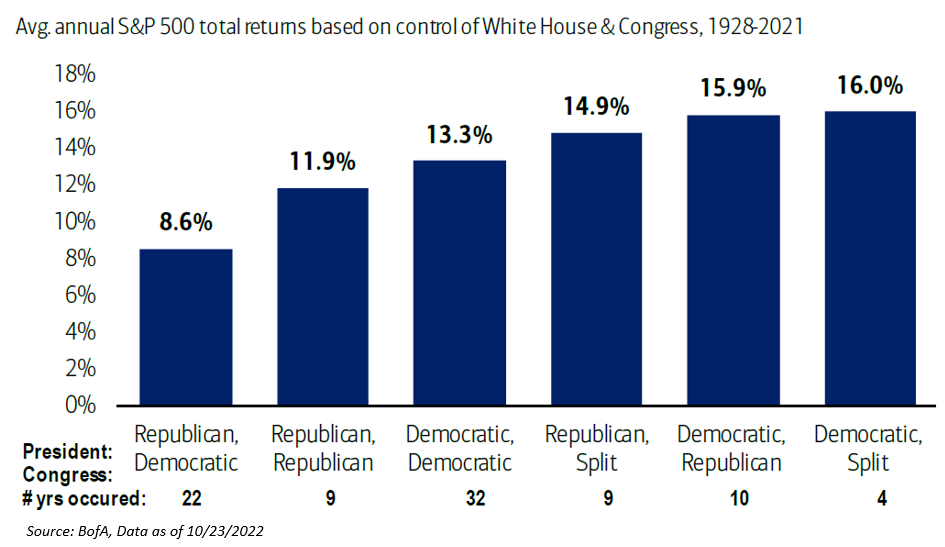
Historically, a split government under a Democratic president has been the best set-up for equities, with average annual returns of 16.0%. Not only that, but stocks have posted their biggest gains in years after the President’s party lost both chambers in a midterm. But, look at the chart below – it just doesn’t matter. Never invest or try to time the market based on politics. I know that I will catch some slack for that comment, but just look at the data below. The other macro factors in the market are more important, i.e., inflation, QT, etc.
Stick to your playbook.
Disclosures
Past performance is not indicative of future results. This material is not financial advice or an offer to sell any product. The information contained herein should not be considered a recommendation to purchase or sell any particular security. Forward looking statements cannot be guaranteed.
The opinions expressed are those of Aptus Capital Advisors, LLC Investment Team. The opinions referenced are as of the date of publication and are subject to change due to changes in the market or economic conditions and may not necessarily come to pass. Forward looking statements cannot be guaranteed.
This commentary offers generalized research, not personalized investment advice. It is for informational purposes only and does not constitute a complete description of our investment services or performance. Nothing in this commentary should be interpreted to state or imply that past results are an indication of future investment returns. All investments involve risk and unless otherwise stated, are not guaranteed. Be sure to consult with an investment & tax professional before implementing any investment strategy. Investing involves risk. Principal loss is possible.
The S&P 500® Index is the Standard & Poor’s Composite Index and is widely regarded as a single gauge of large cap U.S. equities. It is market cap weighted and includes 500 leading companies, capturing approximately 80% coverage of available market capitalization.
Advisory services are offered through Aptus Capital Advisors, LLC, a Registered Investment Adviser registered with the Securities and Exchange Commission. Registration does not imply a certain level or skill or training. More information about the advisor, its investment strategies and objectives, is included in the firm’s Form ADV Part 2, which can be obtained, at no charge, by calling (251) 517-7198. Aptus Capital Advisors, LLC is headquartered in Fairhope, Alabama. ACA-2210-27.
