Daily leveraged ETFs aim to magnify the returns of an underlying asset or index, often by 2x or -2x the daily return. While appealing for short-term trading, their mechanics often lead to lower long-term returns despite higher risk. Inspired by Corey Hoffstein’s recent blog post, The “Rebalance Drag” Myth in Leveraged ETFs: What Advisors Need to Know1, this post explores why all leverage is not created equal.
Understanding Volatility Drag
The difference between arithmetic and geometric returns helps explain why leveraged ETFs often underperform expectations. Here are some examples of how each is calculated:
Arithmetic Return: A simple average of returns, which does not account for compounding.
-
- Example: The arithmetic return of -10% and +10% is: (−10%+10%) / 2 = 0%
Geometric Return (CAGR): Incorporates compounding and represents the true growth rate of an investment.
-
- Example: The geometric return of -10% followed by +10% is: (1−10%)×(1+10%)=0.99−1=−1%
Since geometric returns account for the compounding effect, volatility negatively impacts long-term performance—this phenomenon is known as volatility drag and is especially relevant for leveraged ETFs.
A simplified formula for the geometric mean return is: Geometric mean = Arithmetic mean – (StdDev² / 2)
Volatility creates a “drag” on returns, which worsens with higher leverage. An example for an asset with 50% volatility:
-
- Unlevered: 50%² / 2 = 12.5% drag
-
- Daily leverage: (50% x 2) = 100%² / 2 = 50% drag
In this example, with 2x leverage the drag quadruples, require exceptionally high arithmetic returns to offset it.
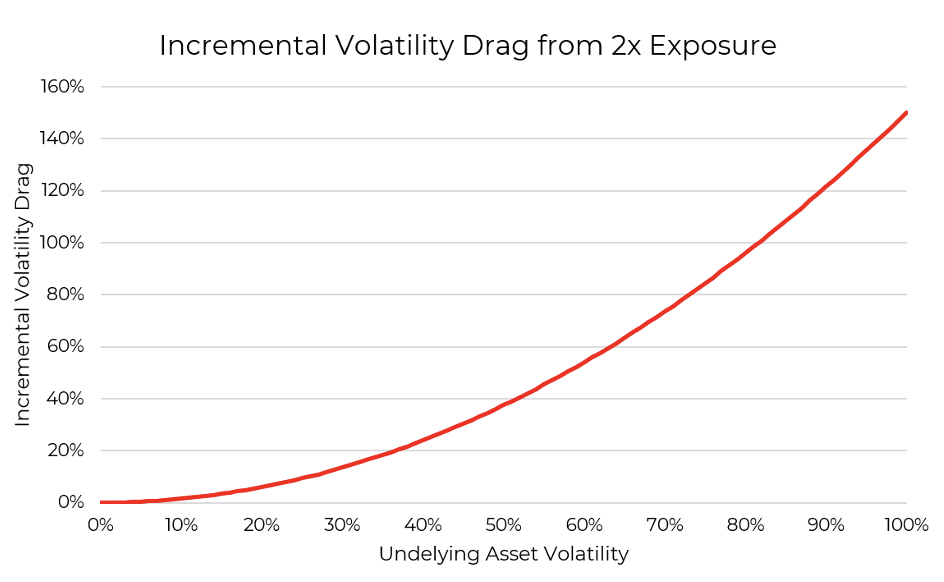 Source: Aptus Conceptual Illustration. See Disclosure for more information*
A Real-World Example: 2x MicroStrategy
Relatively new leveraged single name ETFs provide a case study on the implications of volatility drag with leverage. Let’s look at modeled 5-year annualized returns of Microstrategy (a stock with very popular levered ETFs) with 2x daily leverage, assuming no financing costs or friction as of 1/31/2025:
-
- MSTR (unlevered): 87% annualized return
-
- MSTR (2x leveraged): 44% annualized return
I would note inversing (i.e. shorting) Microstrategy at 2x leverage (yes, there is an ETF for that as well) would have lost an investor -98% of their investment annualized. But focusing on the 2x leveraged long model results; Despite MSTR’s strong arithmetic returns, 2x leverage cuts the levered return by half and nearly eliminates the inverse leveraged return.
 Source: Bloomberg, Aptus as of 01.31.2025
Key Takeaways for Investors
Leveraged concentrated or non-diversified ETFs can be useful for short-term trading, but they are generally ill-suited for long-term investing. Their underperformance is primarily due to volatility drag—a natural result of compounding returns in volatile markets. This issue is amplified when leveraging highly volatile assets, as the drag increases disproportionately with higher leverage.
However, not all leverage is the same. The impact of volatility drag depends on how it’s applied: leveraging a single asset amplifies both returns and volatility, leading to significant drag over time, while leveraging diversifying strategies (e.g., combining uncorrelated return streams) can help mitigate this issue.
For leveraged ETFs to succeed, the underlying asset’s returns must be high enough to overcome the drag—higher for for more volatile and less diversified strategies. Without understanding these dynamics, investors risk holding high-risk products that fail to deliver higher returns.
Footnotes
- The “Rebalance Drag” Myth: Leveraged ETFs underperform not because of “rebalance drag,” but due to volatility drag—a natural result of compounding returns in volatile markets. The impact of volatility drag depends on how leverage is applied:
-
- Leveraging a single asset amplifies both returns and volatility, leading to significant drag over time.
- Leveraging diversifying strategies can mitigate this issue. Combining uncorrelated assets reduces overall portfolio volatility, cushioning the drag.
Visit Corey Hoffstein’s blog post for a much more detailed explanation.
Disclosures
Past performance is not indicative of future results. This material is not financial advice or an offer to sell any product. The information contained herein should not be considered a recommendation to purchase or sell any particular security. Forward looking statements cannot be guaranteed.
*Conceptual Illustration – Information presented in the above charts are for illustrative purposes only and should not be interpreted as actual performance of any investor’s account. As these are not actual results and are examples of incremental volatility drag, they should not be relied upon for investment decisions. Actual results of individual investors will differ due to many factors, including individual investments and fees, client restrictions, different facts and circumstances and the timing of investments and cash flows.
This commentary offers generalized research, not personalized investment advice. It is for informational purposes only and does not constitute a complete description of our investment services or performance. Nothing in this commentary should be interpreted to state or imply that past results are an indication of future investment returns. All investments involve risk and unless otherwise stated, are not guaranteed. Be sure to consult with an investment & tax professional before implementing any investment strategy. Investing involves risk. Principal loss is possible.
Advisory services are offered through Aptus Capital Advisors, LLC, a Registered Investment Adviser registered with the Securities and Exchange Commission. Registration does not imply a certain level or skill or training. More information about the advisor, its investment strategies and objectives, is included in the firm’s Form ADV Part 2, which can be obtained, at no charge, by calling (251) 517-7198. Aptus Capital Advisors, LLC is headquartered in Fairhope, Alabama. ACA-2502-10.
