Where Does the Terminal Rate Need to Go?
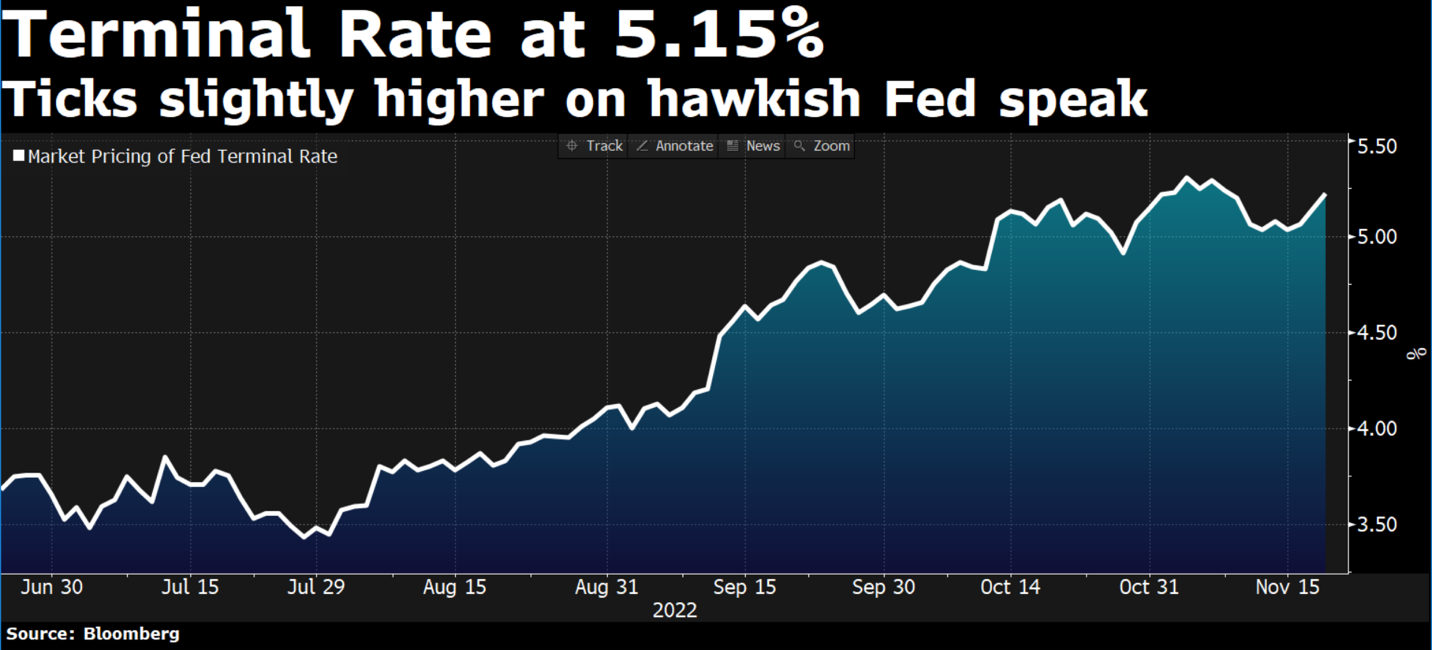 Source: Bloomberg. As of 11/18/22.
It’s pretty clear the pace of rate hikes will slow down soon, although we believe we are far from returning to the easy money policy experienced the last 10+ years. Given the laundry list of unknowns, we thought it might help to take a step back and think about what we do know.
Inflation is still too high but it does appear to be receding. The question remains: HOW FAST DOES IT FALL BACK TO 2%? The Fed has acted aggressively since March with both rate hikes and QT; this action has tightened financial conditions. Monetary policy works with a lag so it’s likely that the faster the Fed goes, the more plausible they will be late to realize the extent of damage the aggressive rate hikes will have on the labor market and the rest of the economy.
Again, this gets us back to, what is the terminal rate? The higher the terminal rate, the higher the likelihood of deteriorating financial conditions. On the other hand, going slower introduces the risk of needing to hike to a higher level if a slower pace proves unwarranted (i.e., persistent inflation).
So Where Does All This Lead Us?
We believe the terminal rate is likely higher today than it was previously thought to be back in September (the last published Dot Plot). Even after the latest data, inflation seems more persistent than what the FOMC thought back in September. We think this means the hurdle for cutting rates in 2023 will be very high.
Inflation has proven to be much more of a problem than it has been for the previous decades (we have to go back to the 70s to find real problematic inflation). We do believe the Fed is determined to avoid the mistake of the early 1980s, when it cut rates too soon, which allowed inflation to roar back. By not anchoring inflation, the result was a double dip recession — an outcome the Fed would very much like to avoid this time.
Time To Tell You How We Really Feel
Back in the 70s, Debt to GDP was much lower than it is today … this made the Volcker policy hikes more feasible. The chart below shows the stark difference faced by today’s Fed versus the Fed back in Volcker’s day.
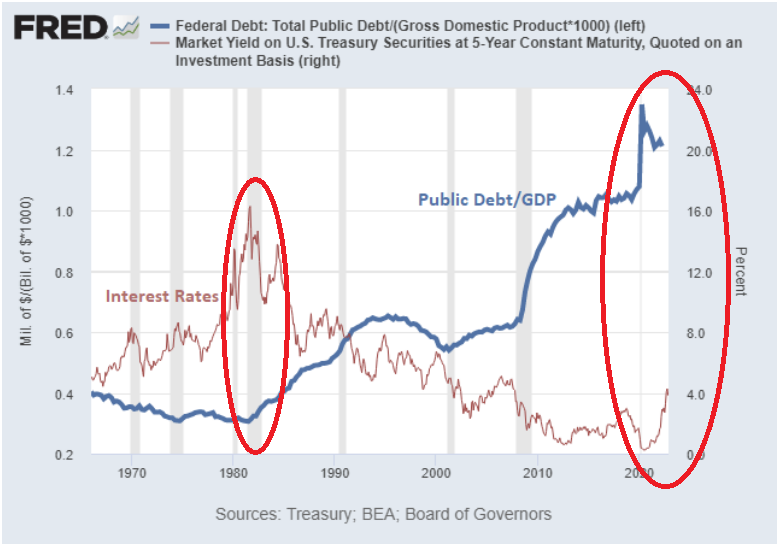 Source: Lyn Alden/Fred. As of 11/21/22.
Gentle reminder: in todays age, Volcker is a hero BUT during his inflation busting hiking campaign, he was much less popular amongst society. Simply put, he literally brought the economy to its knees via his policy actions.
The biggest two questions of today are:
1) How many hikes/how much more tightening of financial conditions can the market handle given the elevated leverage of today (chart below shows the US Gov’t Interest Expense) versus past tightening cycles (we’ve already seen the UK break)?
2) How much inflation is tolerable by the Fed once the tightening (on a lag) flows through to the real economy and slows things down and creates some economic pain?
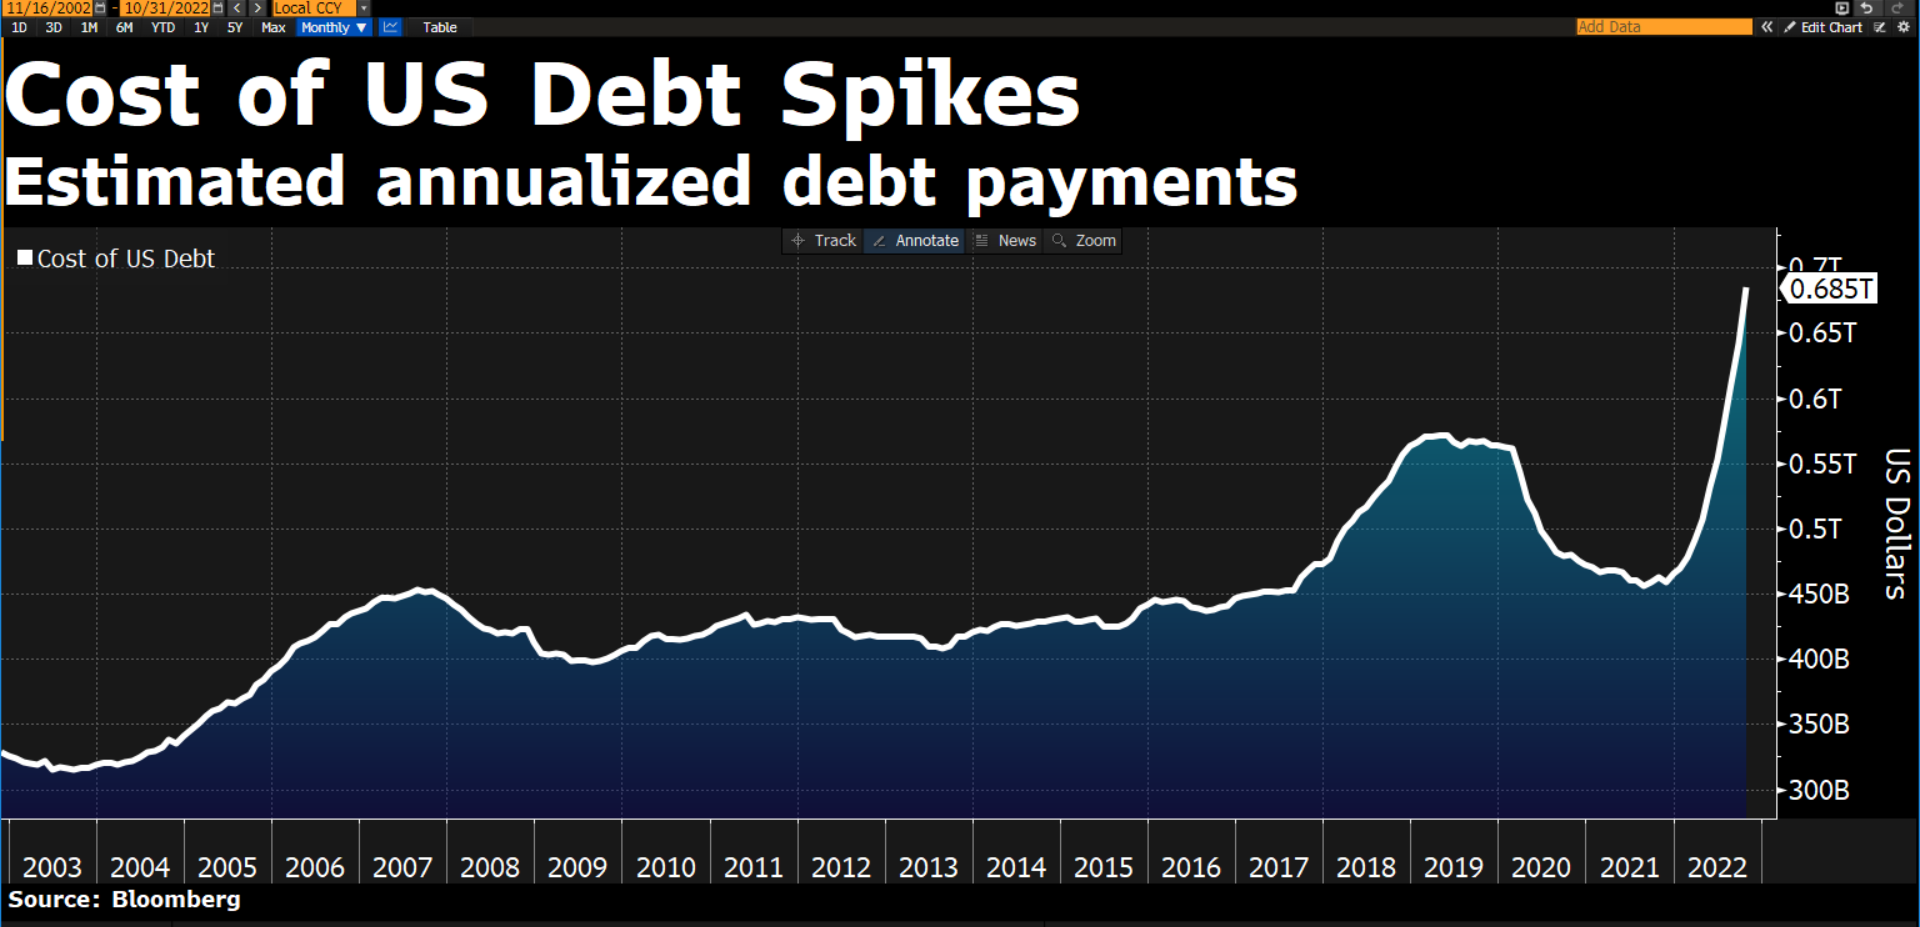 Source: Bloomberg. As of 11/18/22.
What if the Fed doesn’t bring inflation down to 2% before the real economy starts to crack? That could potentially create a political nightmare: high unemployment and a stagnant economy. So the question remains, is it politically feasible to think the Fed can hike (and keep) policy at the levels needed to kill inflation (yes, Bullard threw out a 5-7% Terminal Rate) OR does the Fed declare victory at 3ish% inflation? I think it’s more likely that the Fed lives with higher inflation.
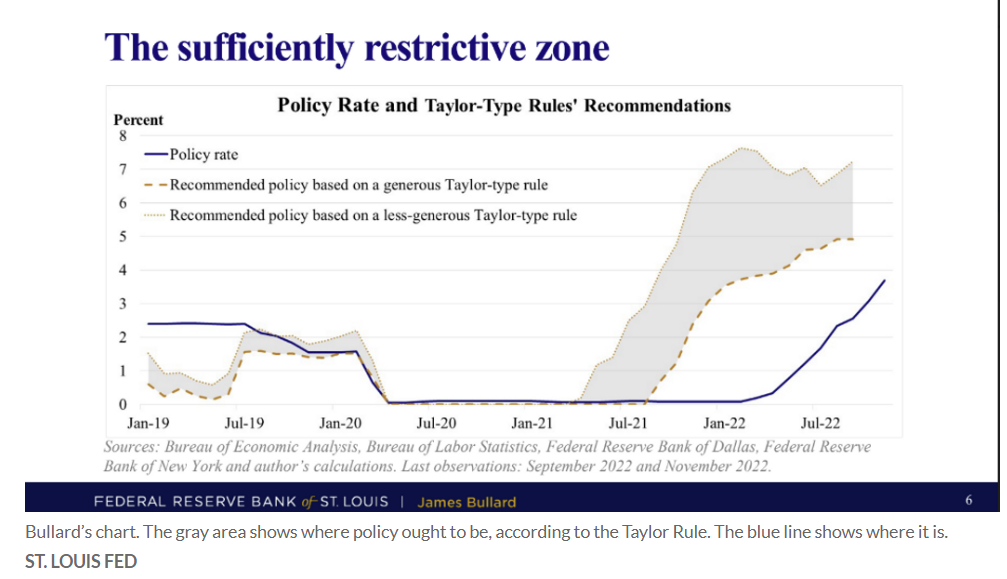
Source: St. Louis Fed. As of 11/18/22. Bullard Presentation indicating he thought a 5-7% Terminal Rate would be “sufficiently restrictive”.
Is the Curve Inversion Worrisome?
As we’ve all heard, the yield curve (measuring the spread between the 10-year Treasury and the 2-year Treasury) is deeply inverted. The level of inversion has actually surpassed the levels seen going into the 2001 and 2008 recessions. The driver remains that expected Fed policy rates will remain elevated, or have even arguably moved higher since September.
While curve inversions have historically been a telltale sign of an impending recession, we could argue that it could also be the recipe for a “soft landing”. Slowing inflation mixed with resilent economic data is just what the Fed is looking for and over the past couple months, they’ve seen a glimpse of it unfolding. Ultimately, both the recession crowd as well as the soft-landing crowd, agree that the yield curve is signaling that the Fed will cut interest rates in the future. The disagreement is about why, and that is what gives us a market!
10s/2s Inversion @ 73bps… Deepest Inversion since 1982.
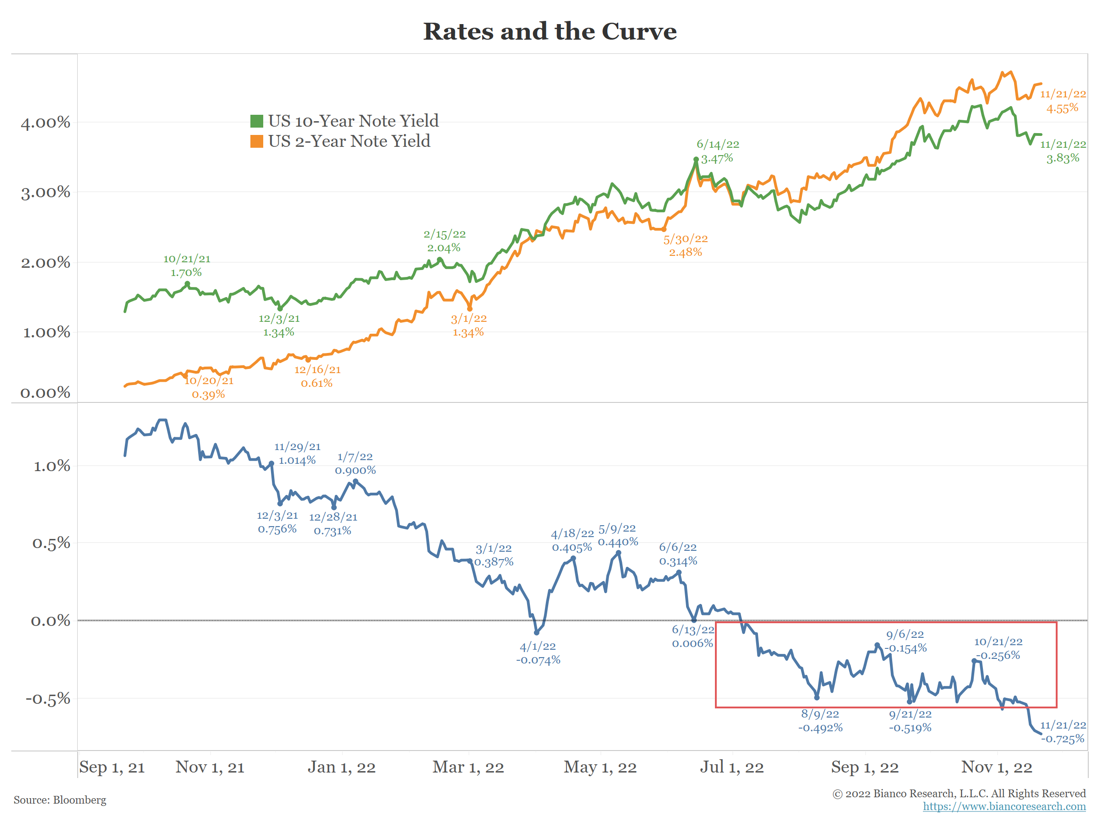 Source: Bianco. As of 11/22/22.
The Fed has already hiked 375 basis points and we expect another 50-basis point hike in December. Even with all that hiking, the 10-year less 3-month yield curve (the Fed’s preferred curve) is only now on the cusp of flashing yellow. While this indicator has successfully called recessions, historically it likely suggests we must still wait several months for a slowdown and subsequent pivot to materialize. In other words, given the inflation backdrop, this signal does not mean the Fed is about to change course.
10Y/3M @ -47bps.
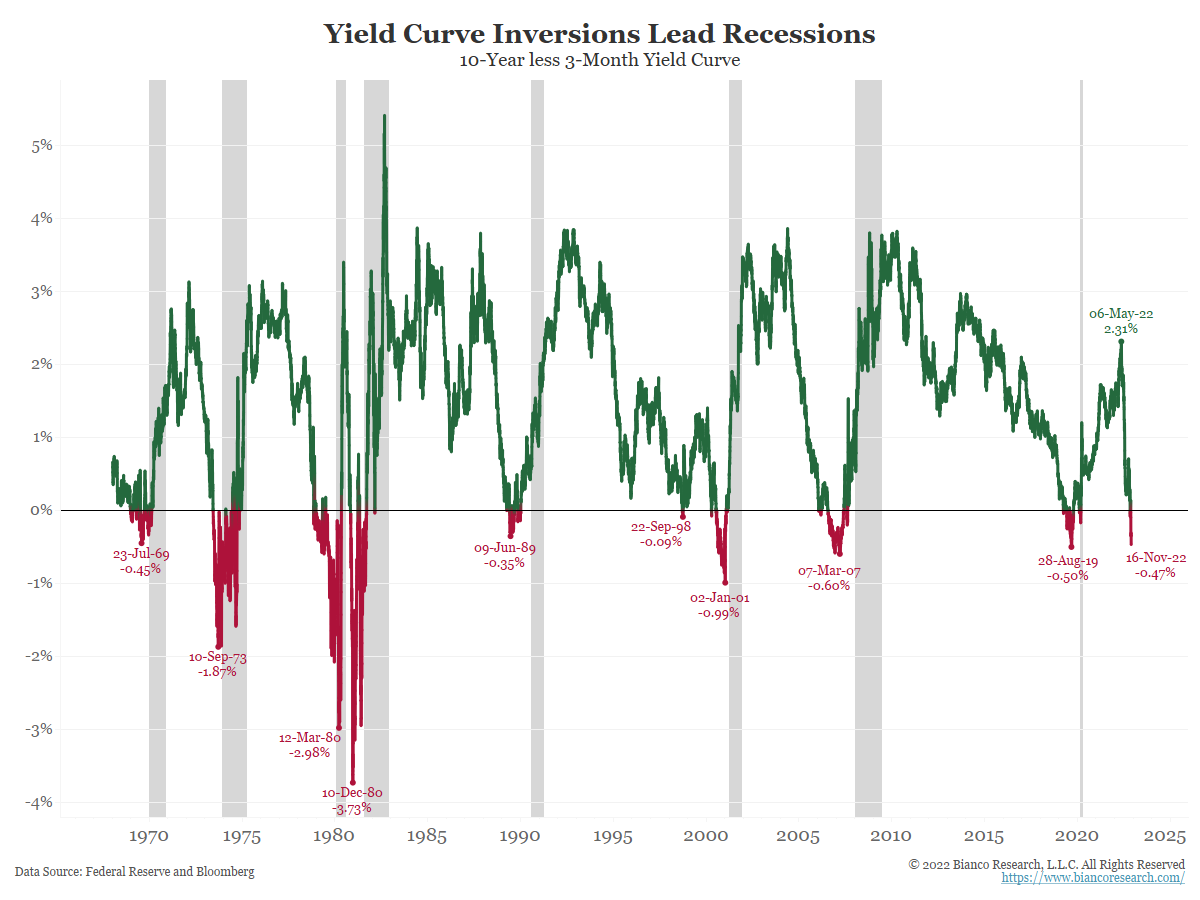 Source: Bianco. As of 11/21/22.
Could the Inversion Deepen?
We believe there is a case for a more inverted yield curve over the coming months. The terminal rate is still several months away, so the very short end of the curve will keep increasing (remember, we expect 2s > Terminal Rate). The two-year rate should keep increasing as well when the market comes to the realization that rate cuts won’t take place any time soon. The long end is much less dependent on nearer-term expectations for Fed policy and should remain rangebound. Our expectation? The recent inversion trend should continue until the spring, when there will be more visibility of how high the terminal rate needs to go.
Disclosures
Past performance is not indicative of future results. This material is not financial advice or an offer to sell any product. The information contained herein should not be considered a recommendation to purchase or sell any particular security. Forward looking statements cannot be guaranteed.
This commentary offers generalized research, not personalized investment advice. It is for informational purposes only and does not constitute a complete description of our investment services or performance. Nothing in this commentary should be interpreted to state or imply that past results are an indication of future investment returns. All investments involve risk and unless otherwise stated, are not guaranteed. Be sure to consult with an investment & tax professional before implementing any investment strategy. Investing involves risk. Principal loss is possible.
When a page is marked “Advisor Use Only” or “For Institutional Use”, the content is only intended for financial advisors, consultants, or existing and prospective institutional investors of Aptus. These materials have not been written or approved for a retail audience or use in mind and should not be distributed to retail investors. Any distribution to retail investors by a registered investment adviser may violate the new Marketing Rule under the Investment Advisers Act. If you choose to utilize or cite material we recommend the citation, be presented in context, with similar footnotes in the material and appropriate sourcing to Aptus and/or any other author or source references. This is notwithstanding any considerations or customizations with regards to your operations, based on your own compliance process, and compliance review with the marketing rule effective November 4, 2022.
The 10-year Treasury Note is a debt obligation issued by the United States government with a maturity of 10 years upon initial issuance. A 10-year Treasury Note pays interest at a fixed rate once every six months and pays the face value to the holder at maturity. The 2-Year Treasury Rate is the yield received for investing in a US government issued treasury security that has a maturity of 2 year. The 10-Year-3-Month Treasury Yield Spread is the difference between the 10-year treasury rate and the 3-month treasury rate. This spread is widely used as a gauge to study the yield curve.
Advisory services are offered through Aptus Capital Advisors, LLC, a Registered Investment Adviser registered with the Securities and Exchange Commission. Registration does not imply a certain level or skill or training. More information about the advisor, its investment strategies and objectives, is included in the firm’s Form ADV Part 2, which can be obtained, at no charge, by calling (251) 517-7198. Aptus Capital Advisors, LLC is headquartered in Fairhope, Alabama. ACA-2211-20.
