As many of you know, we have our ear to the ground with partners across the country – something we are proud to say. Another thing that we are very proud about is bringing Brian Jacobs, CFA on board to help lead us in client and fund development. In fact, today’s topic about current market momentum was based on a recent blog post by Brian so he deserves a lot of credit for this musing.
Continuing the context of talking to partners, there’s a general bias towards market skepticism. Whether it’s current equity valuations, slowing economic data, investors not believing EPS expectations, etc., most investors seem to doubt the amount of upside in equities.
We’ve continued to hear that “after last year, the market cannot go any higher”. Well, in years after an S&P 500 return of 20%+, the following year has an up frequency of 65% w/ an avg. return of +18.8%. In the down years (35% frequency), the avg. price return is (-9.1%). The weighted average return is +8.9% (i.e., very close to LT average for the S&P 500).
So, let’s look at the market’s tendencies after it hits an all-time high and see if there is anything that we can learn from the past.
Can the Market Continue Going Higher?
Simply put, new all-time highs have historically meant lower risk and higher returns.
The S&P 500 has been teetering at all-time highs for over a week now – now sitting almost 4% above the highs reached at the 2021/2022 turn of the year. As we stated in our Q4 Investment Presentation– How bad are things?
Stocks are at all-time highs,
Home values are at all-time highs,
Bonds were up 5% last year after a historical 2YR bear market,
Net wealth is at all-time-highs, and
Personal debt relative to income is nowhere near historic highs.
When put in this context, the current market price of ~4940 may be more believable, but what does this say about the market moving forward? As Brian said in his blog post:
“Contrary to common concerns, approaching or hitting new all-time highs in the equity markets may not be the harbinger of impending downturns that some perceive. In fact, historical data reveals an intriguing trend: stock markets around the globe have generally exhibited stronger performance and lower risk when scaling new heights.”
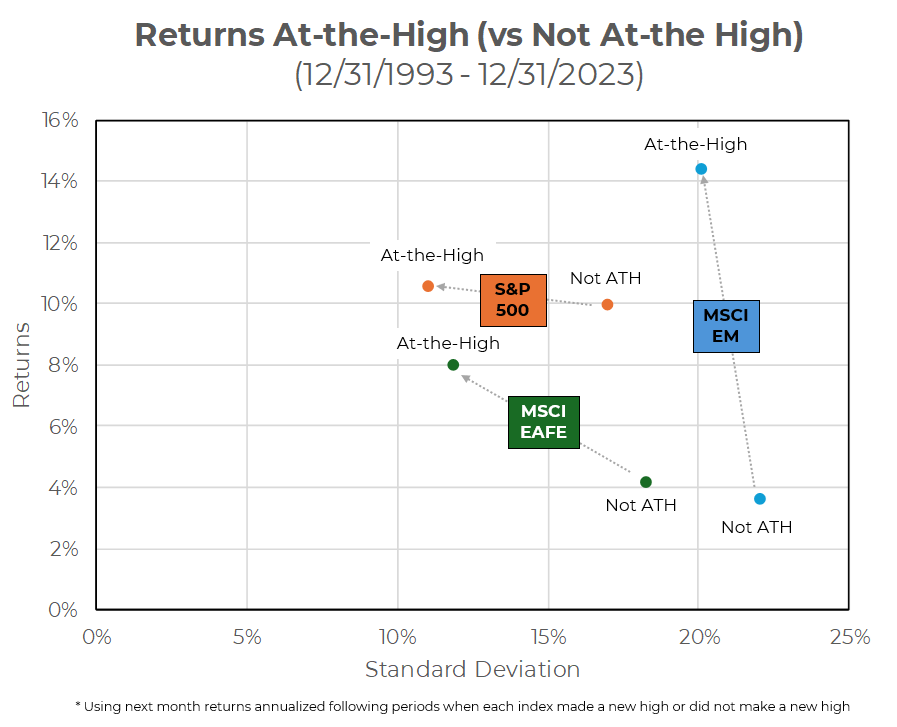
Source: Aptus via YCharts
How cool is that chart?!
This empirical evidence challenges the notion that market peaks should evoke caution or a move out of return-seeking investment strategies. It signals an opportunity for investors to reassess their perspectives on all-time highs and view them not as warning signs, but rather as potential indicators of continued growth and stability in the markets.
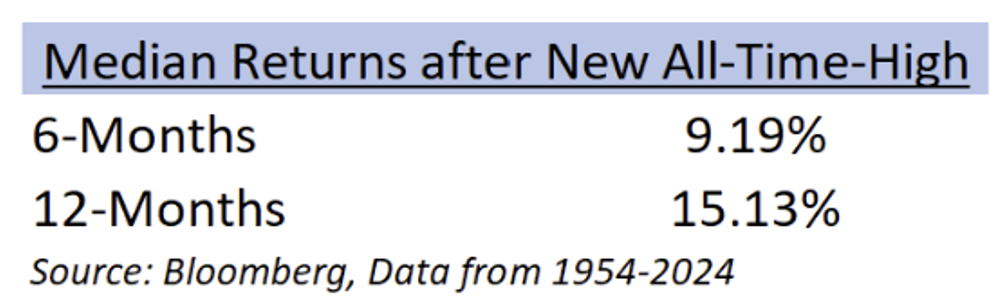
Let’s broaden out this data set by another 40 years to 1950. The results are the same à the market’s forward 6- and 12-month returns have easily beaten historical averages, but the risk is surprisingly lower with smaller drawdowns and muted volatility. Bloomberg did a study where they analyzed months that made new highs after a large market drawdown, specifically the years of: 1958, 1963, 1967, 1972, 1980, 1982, 1989, 2007, 2013, and 2020.
Lower Volatility
Over the following 6-months, the average volatility had an annualized value of 11.92%. This level is much lower than the 14.56% annualized volatility for the market on a monthly basis since 1950. If you analyze the data for the next 12 months, instead of 6 months, the results are quite similar.
Higher Returns
But, the most surprising aspect of the data was that even the worst performance period wasn’t that bad. Of those aforementioned years, the worst period of time (on the 6-month data) was after the May 2007 peak and the market fell by only (-2.23%). Again, if we widen the data out to the following 12 months, the worst period, which was also during May 2007, witnessed a market down only (-6.63%).
While we know the importance of lower volatility at Aptus, we understand that clients want higher compounded returns. JD has done a great job reminding us that clients do not care about your Sharpe Ratio if you don’t meet return targets. We think about volatility differently – we want to excel at reducing volatility during down markets (doing better in the left tail), without compromising upside potential (doing better in the right tail).
During times like these, investors need to remain balanced – don’t get too bullish, and don’t get too bearish.
Disclosures
Past performance is not indicative of future results. This material is not financial advice or an offer to sell any product. The information contained herein should not be considered a recommendation to purchase or sell any particular security. Forward-looking statements cannot be guaranteed.
This commentary offers generalized research, not personalized investment advice. It is for informational purposes only and does not constitute a complete description of our investment services or performance. Nothing in this commentary should be interpreted to state or imply that past results are an indication of future investment returns. All investments involve risk and unless otherwise stated, are not guaranteed. Be sure to consult with an investment & tax professional before implementing any investment strategy. Investing involves risk. Principal loss is possible.
Advisory services are offered through Aptus Capital Advisors, LLC, a Registered Investment Adviser registered with the Securities and Exchange Commission. Registration does not imply a certain level or skill or training. More information about the advisor, its investment strategies and objectives, is included in the firm’s Form ADV Part 2, which can be obtained, at no charge, by calling (251) 517-7198. Aptus Capital Advisors, LLC is headquartered in Fairhope, Alabama. ACA-2402-6.
