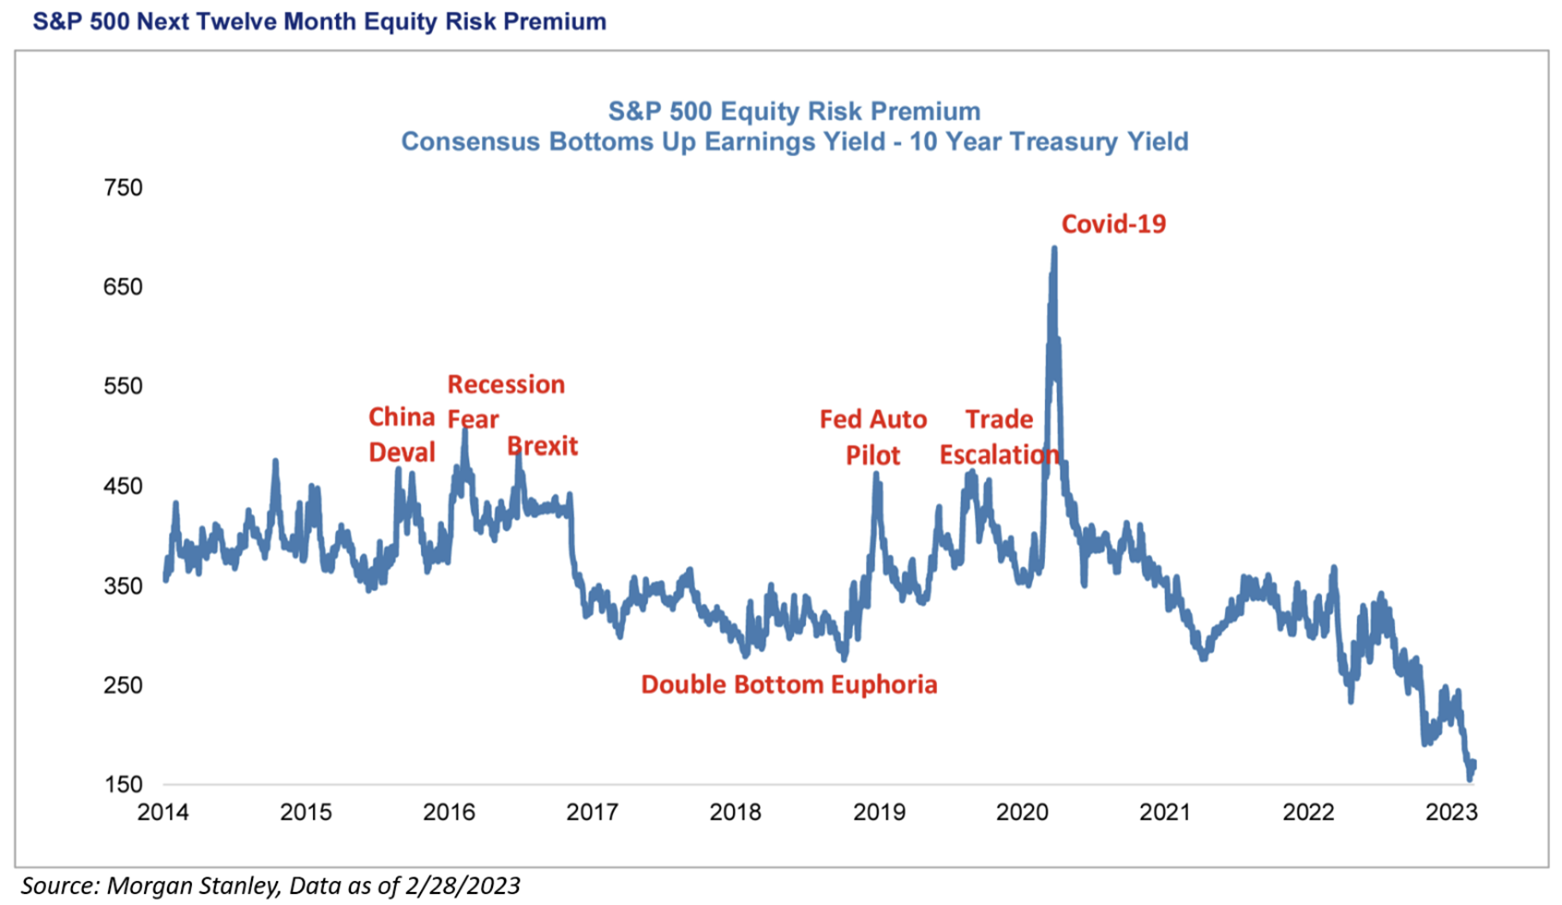
I’ve fielded a few questions regarding Mike Wilson’s (of Morgan Stanley) recent market commentary. Outside of corporate profitability, i.e., margins driving down future earnings, one of his biggest takes is on the current valuation of the S&P 500. As of 3/7/23, the index trades at 19.4x earnings. Specifically, Wilson has been focusing on the “Equity Risk Premium”. Let’s open up our textbooks and go down memory lane with this financial jargon because I’ve seen a lot of this recently:
“The Equity Risk Premium is at 2007 Levels”
The Equity Risk Premium (“ERP”) frames equity valuation in the context of interest rates. Said another way: ERP is what an investor is being paid for the inherent risk in equities versus bonds from an opportunity cost perspective. If you’ve read anything of our material lately, you’ve continued to hear us harp on the fact that we fully believe that the market is in a very different interest rate environment than what investors have been accustomed to over the last forty years.
Let’s dive in.
Equity Risk Premium
Volatility has picked up amid increasingly hawkish chatter from the Fed and stubbornly resilient economic data. These have combined to result in a meaningful rise in yields as the 10-YR Treasury has increased from 3.40% to 3.99% in the last month. Given the different interest rate landscape, the equity risk premium equation is essentially a way to measure how expensive stocks are relative to bonds (or vice-versa). The equation looks to quantify the excess returns that can be expected for taking additional risk in the stock market versus the risk in the Treasury market.
The Equity Risk Premium measures the current earnings yield of the S&P 500 Index against a benchmark “risk free” rate (typically the 10YR US Treasury). To calculate the earnings yield, an investor should simply take the inverse of the P/E ratio.
Step 1 – Calculate Earnings Yield:
Current S&P 500 Level: 4,020
Current FY ’23 Earnings Expectations: $222
Earnings Yield: ($222/4,060) = 5.52%
Step 2 – Calculate Equity Risk Premium:
Earnings Yield: ($222/4,060) = 5.47%
Current 10YR Treasury: 3.97%
ERP = 5.52% – 3.97% = 1.55%
This reading (+1.55%) is one of the lowest readings since 2007:

Key Points = The lower the earnings yield = More expensive, The lower the ERP = Bonds look attractive.
Even though stocks are only 15% off all-time highs (SPX) reached at EOY 2021, the S&P 500 doesn’t appear to be cheap on a cross-asset analysis.
With the Equity Risk Premium at its lowest level since 2007, the risk-reward for stocks appears to be quite poor, particularly with a Fed that is likely far from done, and earnings expectations remain too high for both FY ’23 and FY ’24. An ERP of 1.55% is remarkable by itself, but it’s even more spectacular given that earnings expectations should continue to decline in the future (Please reach out if you’d like our notes here – Why Earnings Remain Too High).
So, What Does This Mean for Markets?
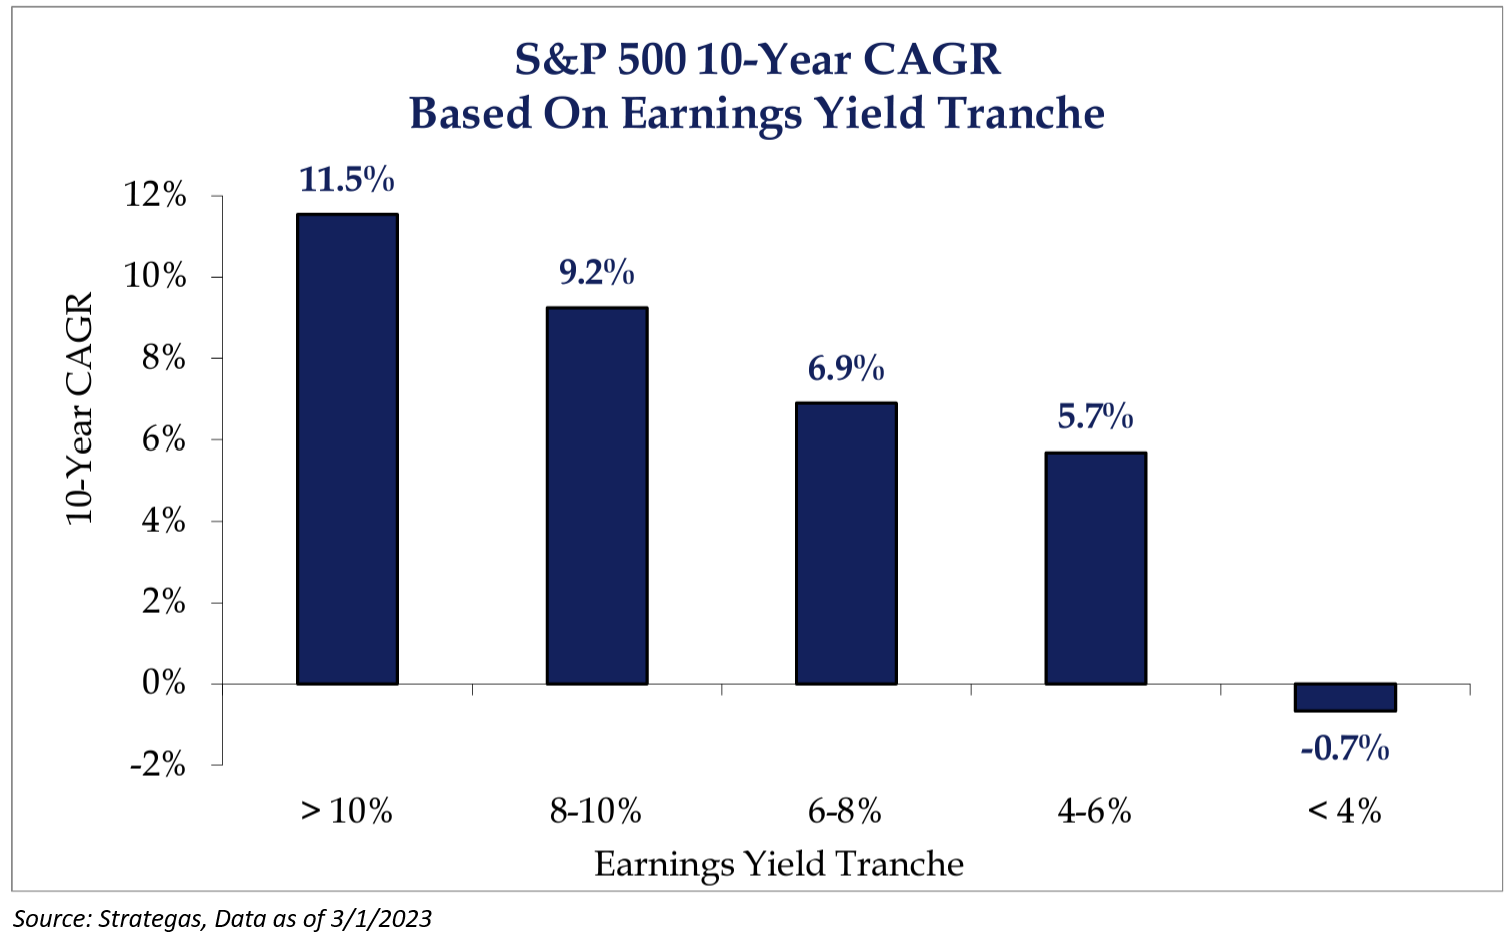
An earnings yield at these levels is associated with lower future returns. With the earnings yield on the S&P 500 sitting right at 5.5%, annual returns over the next 10 years are historically on the lower end of the spectrum. While the worst entry point is when the earnings yield is less than 4%, this further confirms that the competition for capital is that much greater. A 10-year treasury yield at roughly 4% with a significantly lower level of risk becomes attractive even compared to equities.

Asset Allocation Implications
Let’s bring this home. As we all know, from a diversification standpoint, you cannot simply only invest in one asset class. So, let’s talk about how we are attacking this problem head on:
- Owning Guard Rails – Given the necessity for diversification, we know that one needs to continue to have exposure to equities in their allocations. This is why we put such an emphasis on using “guard rails”, i.e., owning volatility as an asset class. Said another way: We are building portfolios that are better in the tails.
- The Types of Equities That We Own – We try owning the highest quality of companies that tend to do well during market downturns. Not only that, but they have durable advantages, i.e., competitive moat, that allow them to also participate when the market rallies. These companies tend to have higher quality of earnings, i.e., less variation between GAAP & Non-GAAP. Secondly, we have an O/W to the “avg. stock” stock through our weighting to Small Caps. Recognize the difference in Earnings Yields for the following asset classes: S&P 500 = 5.52% versus RSP = 6.00%. Then take a look at U.S. Small Caps:

- Long-Term Mindset – Over longer periods of time, stocks tend to outperform, and investors need to focus on “real” returns:
Source: MM Visuals 03.06.2023
As always, feel free to reach out w/ any questions.
Disclosures
Past performance is not indicative of future results. This material is not financial advice or an offer to sell any product. The information contained herein should not be considered a recommendation to purchase or sell any particular security. Forward looking statements cannot be guaranteed.
This commentary offers generalized research, not personalized investment advice. It is for informational purposes only and does not constitute a complete description of our investment services or performance. Nothing in this commentary should be interpreted to state or imply that past results are an indication of future investment returns. All investments involve risk and unless otherwise stated, are not guaranteed. Be sure to consult with an investment & tax professional before implementing any investment strategy. Investing involves risk. Principal loss is possible.
The S&P 500 Index is the Standard & Poor’s Composite Index and is widely regarded as a single gauge of large cap U.S. equities. It is market cap weighted and includes 500 leading companies, capturing approximately 80% coverage of available market capitalization.
Advisory services are offered through Aptus Capital Advisors, LLC, a Registered Investment Adviser registered with the Securities and Exchange Commission. Registration does not imply a certain level or skill or training. More information about the advisor, its investment strategies and objectives, is included in the firm’s Form ADV Part 2, which can be obtained, at no charge, by calling (251) 517-7198. Aptus Capital Advisors, LLC is headquartered in Fairhope, Alabama. ACA-2303-13.


