I broke a 2 year tradition: I was unable to get a musing out on George Strait’s birthday (D.O.B: 5/18/1952). He turned everyone’s favorite golf score, 71 – also the score booked by Michael Block in this past weekend’s PGA Championship.
Two-part commentary this week:
“All my Exes Live In Texas the RSP”, and Q1 ’23 Earnings Season Leaving Bullish Investors with a Smile
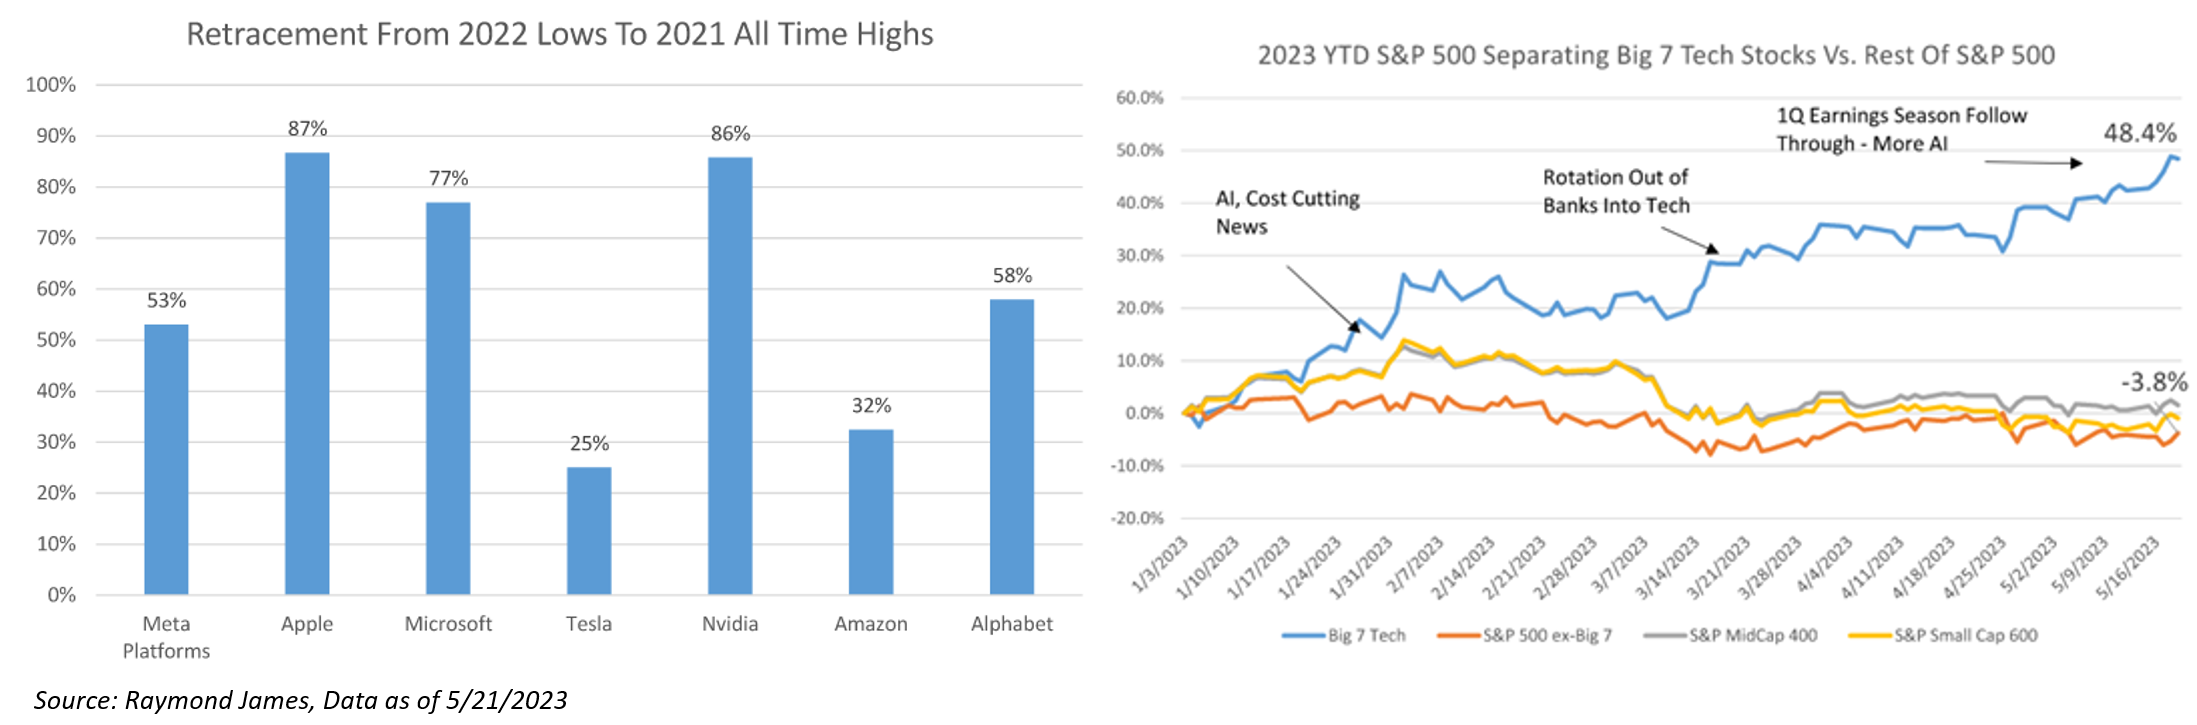
All My Exes Live in Texas, That’s Why Mega Caps Hang their Hat in Tennessee
By our estimates, the Big 7 tech stocks have contributed 13% to YTD performance on the S&P 500, while the rest of the index is down ~4% on average, a spread that seems to widen nearly every week (how narrow can we go?).
Shown below is the simple average of YTD performance of technology, consumer discretionary, and communications services (all largely tech) sectors relative to the other eight sectors. What is driving the momentum?
Likely a combination of a number of factors including: AI theme, better than feared earnings, fear of a downturn in more cyclically exposed areas of the market, disappointing China recovery (driving global investors back into US mega cap tech), lower rates, and probably a few other reasons. But importantly, since the bank crisis, there is no sign that this trend is slowing, as investors just keep piling in.
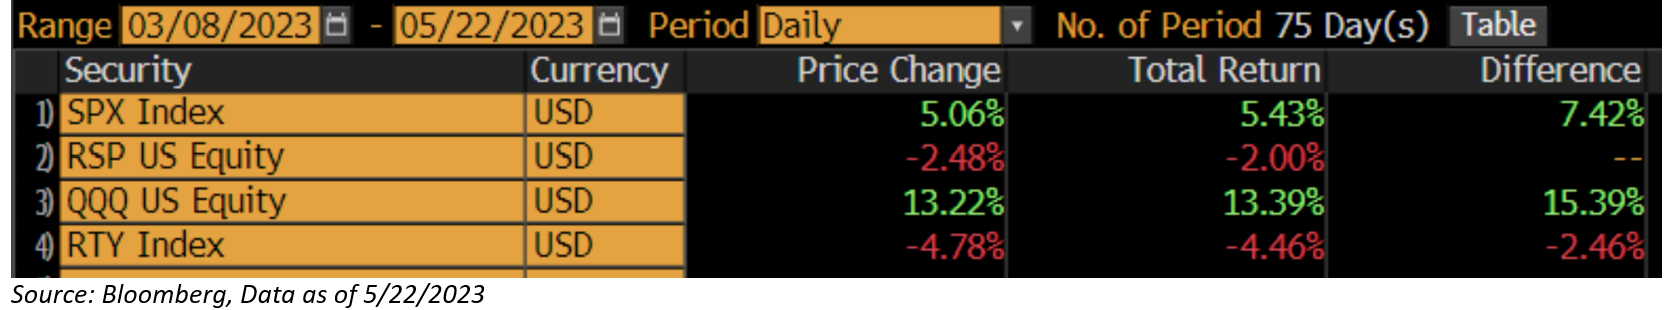
Since the bank failures began on March 8, stock returns of individual companies within the S&P 500 have shown a significant divergence. The total return of the market cap weighted S&P 500, or the SPX, is up 5.43%. But on an equal-weighted basis (RSP), these same 500 stocks are down 2.00% over the same period.
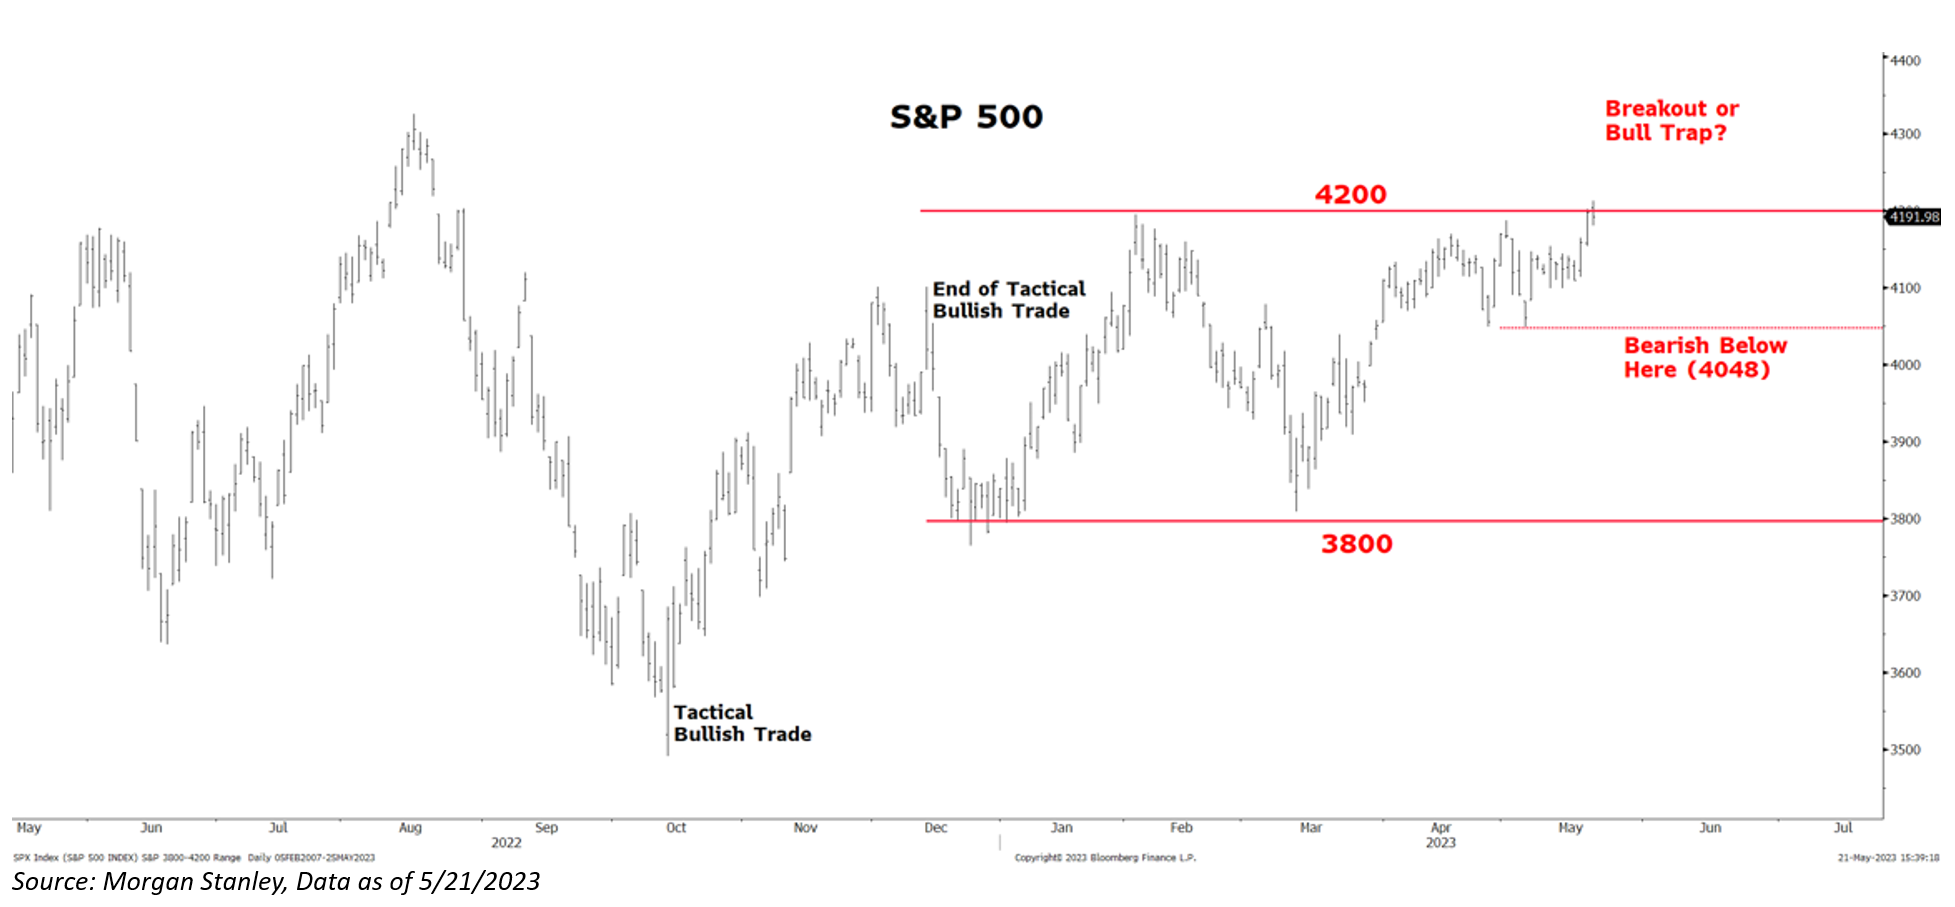
With the S&P 500 testing the upper end of its trading range (3800-4200), are we on the cusp of a breakout that confirms a new bull market or a reversion to the mean? I believe that the debt ceiling remains a key risk even if a deal is made. Nonetheless, time will tell.
Q1 2023 Leaving Investors With a Smile
Overall, economic data has been consistently stronger-than-expected leaving earnings to be better-than-anticipated. From a spending perspective, bank lending & deposit data have not confirmed the worst fears about a tightening of lending standards, and the economic data has been consistently better than feared. Strong and income growth continue to support spending and that’s what we saw in Q1. Basically, for now, economic trends don’t support heightened near-term recession risk.
Q1 ’23 EPS tracked 5% better than Wall Street analysts expected, though down 3% YoY. Of that, 71% of companies beat on sales, 77% on earnings, 58% on both, handily clearing the long-term averages of 58% / 59% / 40%. At the beginning of the year, Q1 EPS expectations were thought to contract 8% YoY, reflecting reduced concerns about downside risk.
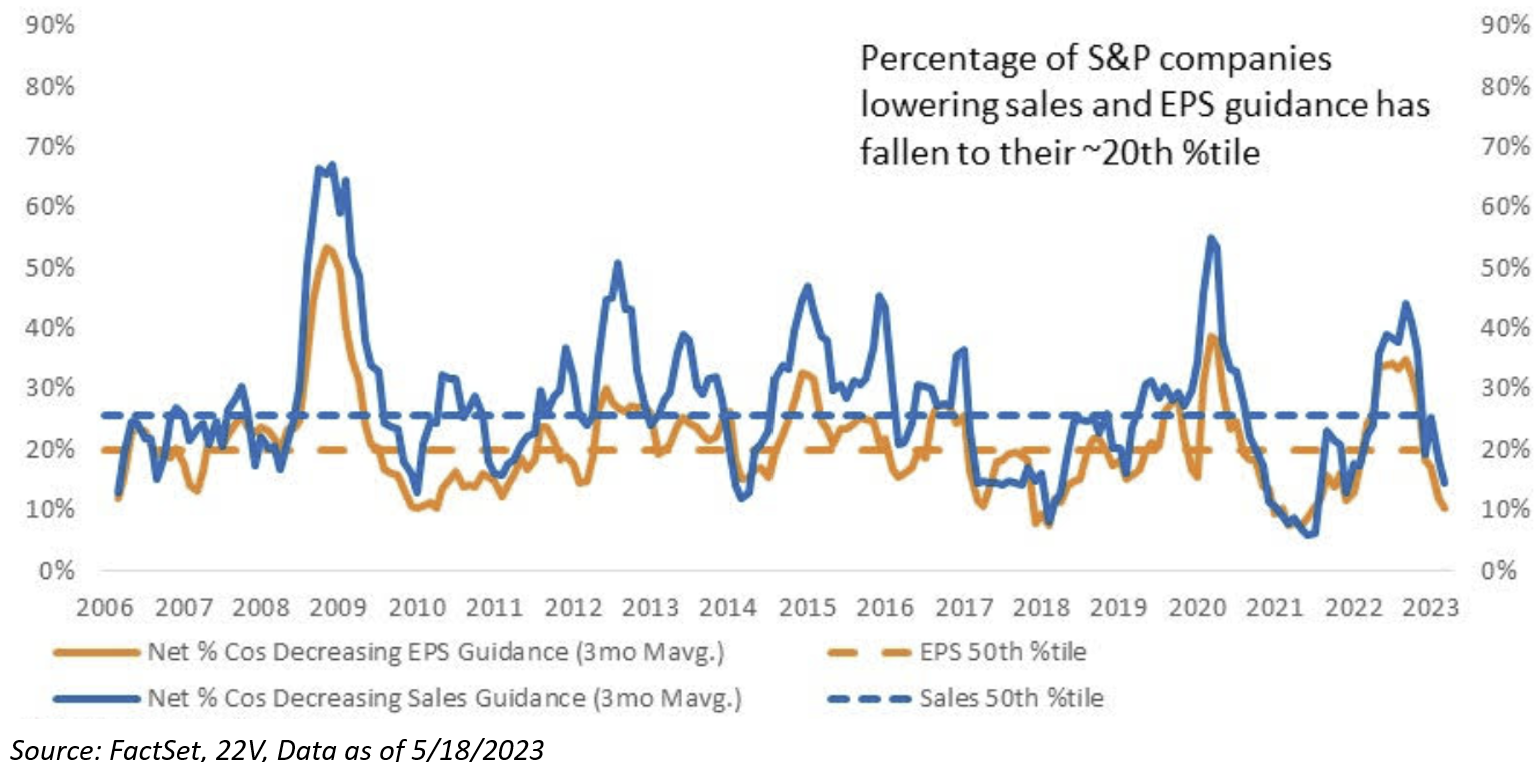
One of the most surprising things during earning season was the strength of corporate guidance. There have been 40% more above- than below-consensus guides this season (April-May), the 3mo guidance ratio is tracking 1.4x, the strongest in two years and well above the historical average of 0.9x.
The kickback on this past quarter’s earnings was that these companies beat on a lowered bar and that maybe comparing results to January 1st estimates may tell a better story. Looking at the street’s estimates from the start of the year for the first quarter shows that sales truly came in better than expected as even 7 of the 11 sectors beat the January 1st estimates.
Earnings growth, on the other hand, largely missed with only 3 of the 11 sectors beating the January 1st estimates. The classic tale of revise lower during the first quarter to beat lowered estimates was on display suggesting that what looked like a strong earnings season on the surface may not be all it’s talked up to be.
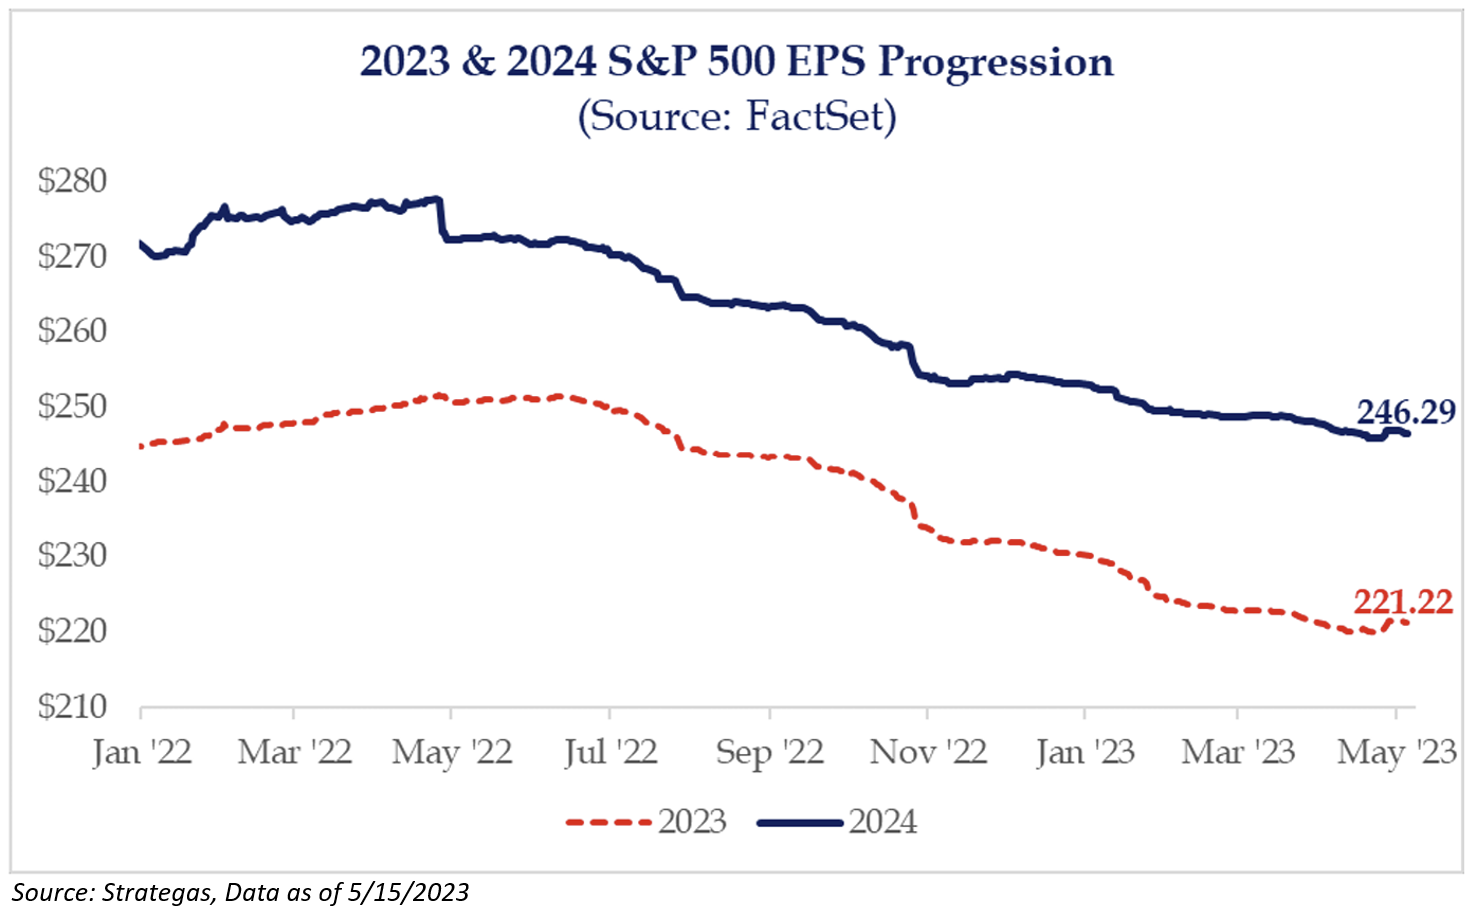
After falling 13% since June, consensus ‘23 EPS started to bottom, rising 0.7% since the mid-April low. Moreover, following strong earnings from Big Tech, Nasdaq earnings ticked up vs. S&P 500 earnings after lagging for over a year. While we still see cyclical headwinds for Tech after COVID demand pull-forward, there are signs of stabilization following cost cutting efforts, i.e., GOOGL, META, MSFT, AMZN.
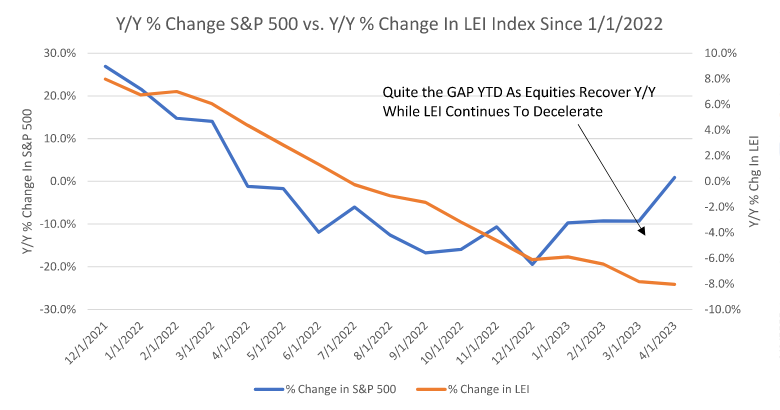
If y’all have heard me speak lately, I keep using the phrase “deceleration”, and one of the more interesting charts I’ve come across lately is below. The LEI index for April decelerated yet again to -8.0% YoY with little signs of stabilization. Of note, the LEI has one of the highest R-squareds of any economic data sets we have tracked over time (44%), meaning it’s relatively unusual to see equities increasing YoY when this metric is declining and worsening YoY.
 Source: Raymond James as of 05.21.2023
Disclosures
Past performance is not indicative of future results. This material is not financial advice or an offer to sell any product. The information contained herein should not be considered a recommendation to purchase or sell any particular security. Forward looking statements cannot be guaranteed.
This commentary offers generalized research, not personalized investment advice. It is for informational purposes only and does not constitute a complete description of our investment services or performance. Nothing in this commentary should be interpreted to state or imply that past results are an indication of future investment returns. All investments involve risk and unless otherwise stated, are not guaranteed. Be sure to consult with an investment & tax professional before implementing any investment strategy. Investing involves risk. Principal loss is possible.
The S&P 500® Index is the Standard & Poor’s Composite Index and is widely regarded as a single gauge of large cap U.S. equities. It is market cap weighted and includes 500 leading companies, capturing approximately 80% coverage of available market capitalization.
Advisory services are offered through Aptus Capital Advisors, LLC, a Registered Investment Adviser registered with the Securities and Exchange Commission. Registration does not imply a certain level or skill or training. More information about the advisor, its investment strategies and objectives, is included in the firm’s Form ADV Part 2, which can be obtained, at no charge, by calling (251) 517-7198. Aptus Capital Advisors, LLC is headquartered in Fairhope, Alabama. ACA-2305-27.
