What an awesome 150th British Open this past weekend at St. Andrews! For those following, it was an interesting week for the players at “The Old Course”, as this is the first major since a lot of drama went down regarding the formation of the Saudi Arabian-backed golf league, LIV. It appears that the “splitters”, i.e., those that defected to the LIV, weren’t the biggest “earners” during the weekend.
Given this dichotomy, I’m going to be focusing on the following two topics:
- Q2 2022 Earnings Season
- (Stock) Splitters
Q2 2022 Earnings Preview
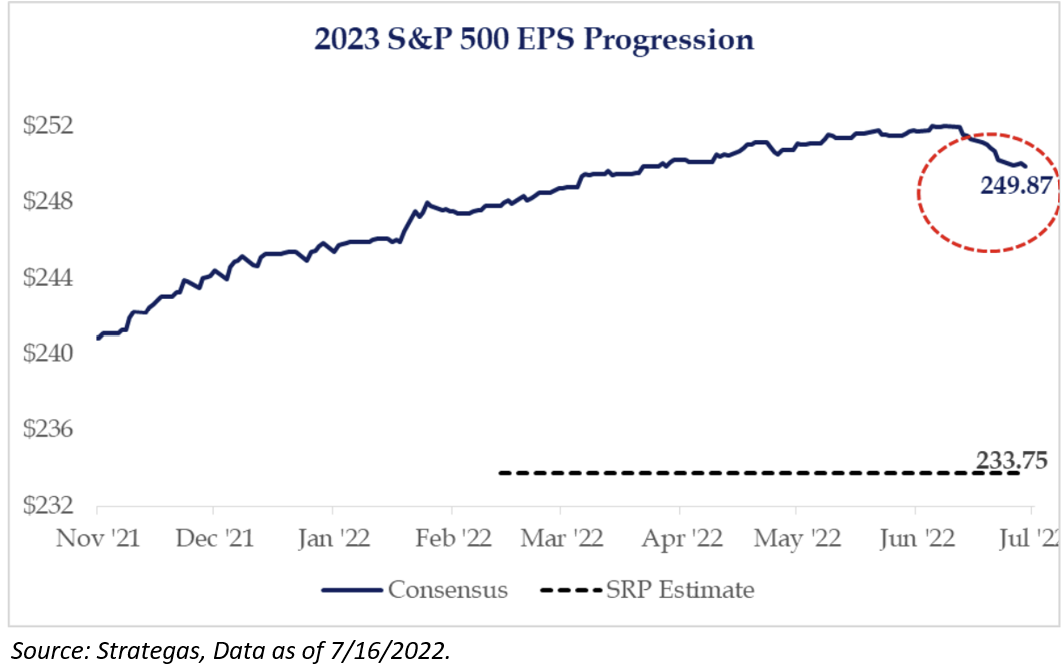
The second quarter earnings season is set to begin this week and while earnings are expected to be up about 6%, we believe the Q2 story is about energy holding up the aggregate data. We are more interested in guidance for the remainder of the year and into 2023. We are of the view that 2023 estimates are too high and will likely come in once analysts are given the cover from companies. For 2023, the consensus estimate is near $250 – WELL above 2019’s EPS figures.
On the negative side, sales growth is running above historical levels based on data going back to the early 1990s. To be fair, the elevated inflation readings are helping to make the figures look strong. However, the concern that we have is companies will not be able to sustain these strong levels. Should sales growth dip below cost growth, companies will face difficult decisions. We have already begun to see layoffs.
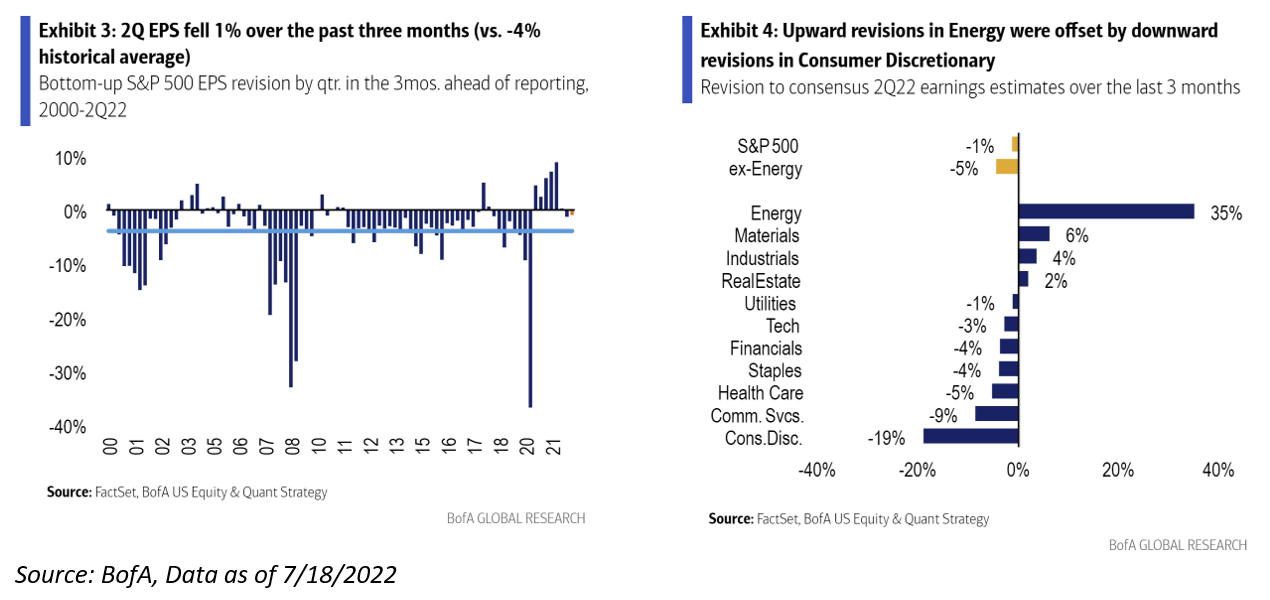
Focusing more this quarter, expectations for Q2 have only come down 1% versus the average cut of 4% in the last three months but, excluding Energy, the cut has been a deeper 5%.
The big question is – how far can EPS compress during this period? Obviously, this is unknown, as each profitability scare and/or recession is different, but let’s look at some historical EPS pullbacks from previous recessions:
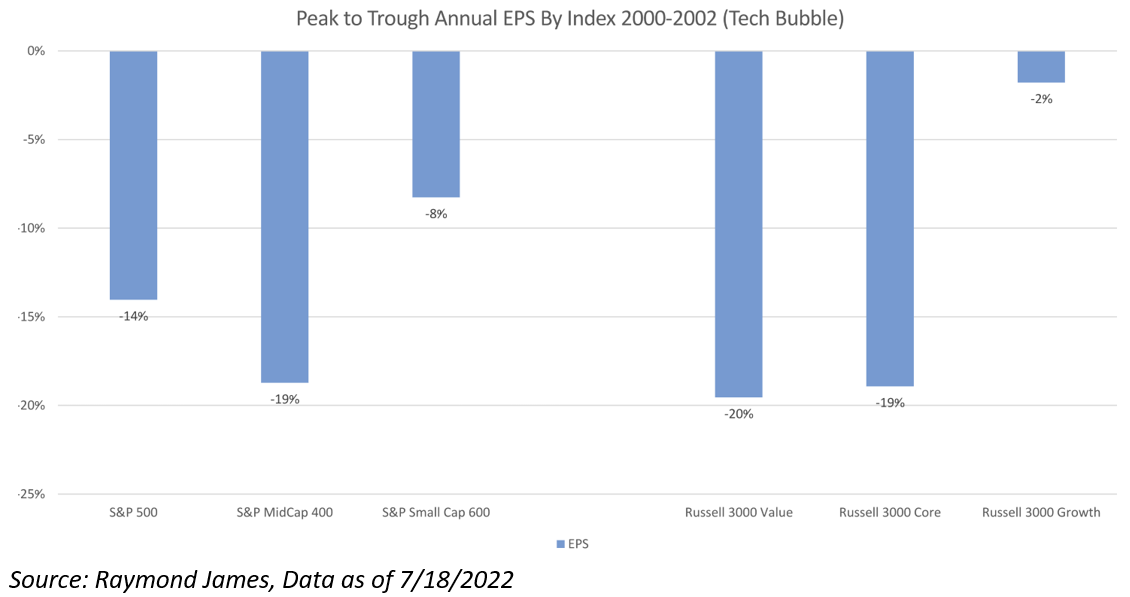
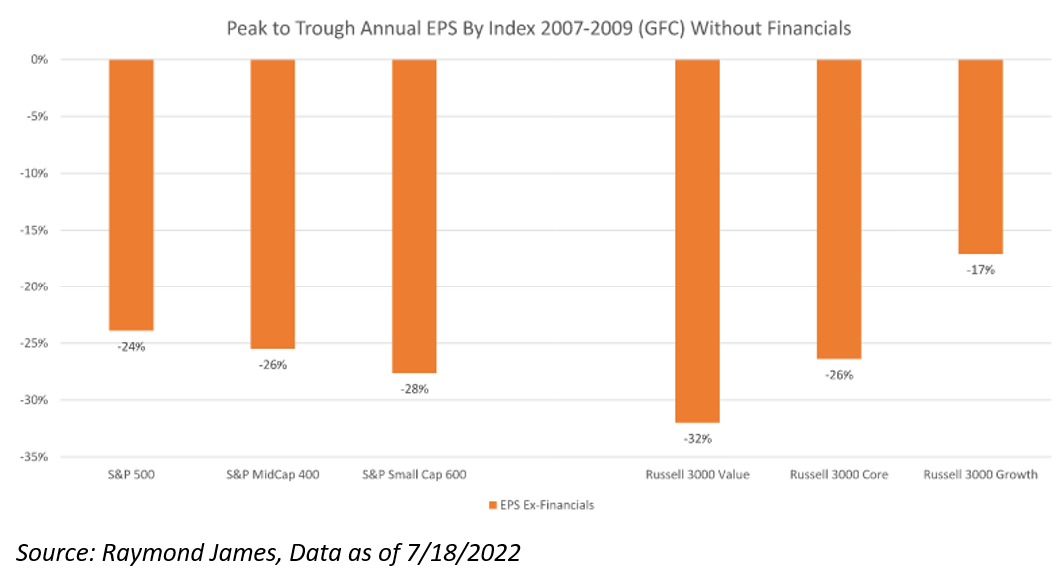
These two charts show the peak to trough EPS decline (annually) in the past two recessions, but we’ve backed out financials from the GFC as a financial collapse seems incredibly unlikely this time around. In general, EPS declined ~15% in the 2000-2002 downturn, with small caps doing a bit better and growth EPS performing better (growth performance was abysmal due to P/E declines). EPS declined in the 25-30% range in the GFC (ex-financials), with value slightly worse, growth slightly better, and small caps faring a bit worse than larger caps (global exposure helped in GFC).
We don’t know what the EPS drawdown will be this recession, but we are quite convinced that S&P 500 earning’s estimates need to come down. That’s why we are focusing on management commentary and guidance this quarter. I can say with certainty, that I believe volatility will continue through earnings season, and more importantly, it will be a stock pickers market, given the potential for performance divergences. The goal for me is to step on the least number of landmines, of which, there could be quite a few out there.
Stock Splits
Over the last year, there have been some very high-profile stock splits:
- July 15th, 2022: GOOG/GOOGL (20:1)
- June 7th, 2022: AMZN (20:1)
- June 6th, 2022: TSLA (3:1)
- July 19th, 2021: NVDA (4:1)
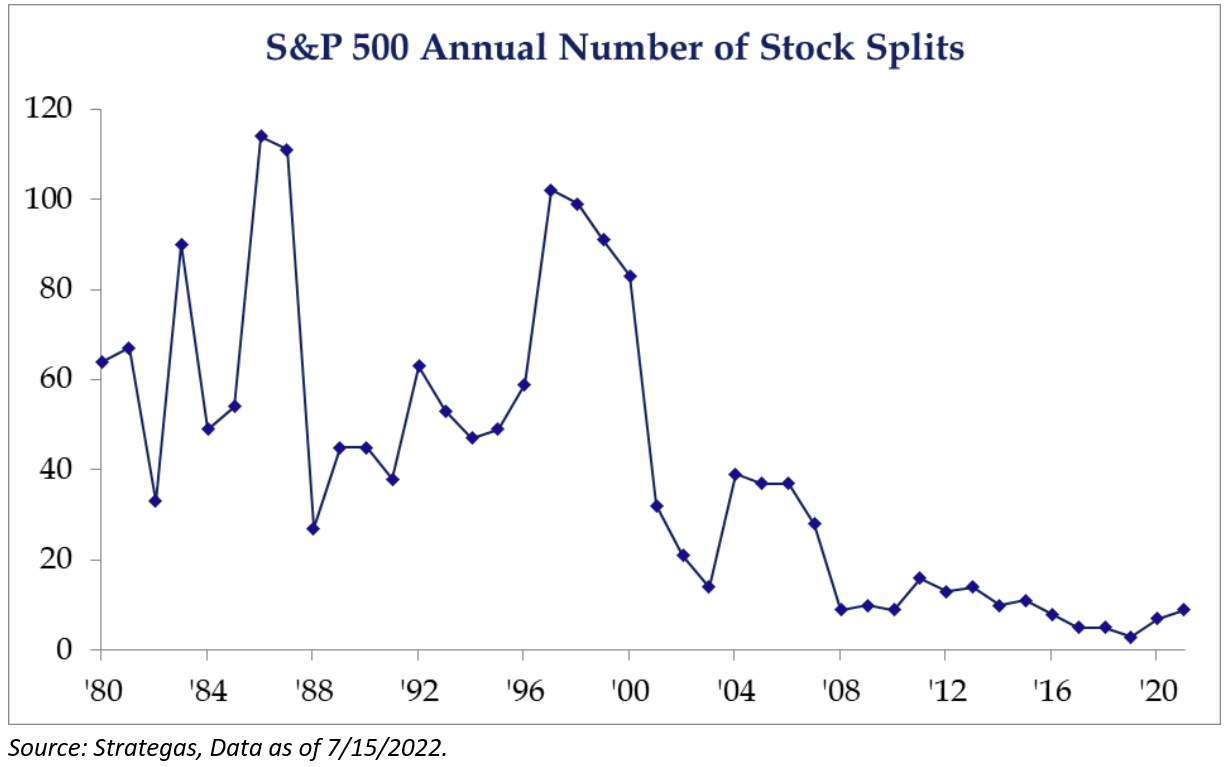
Given the number of splits lately, discussions of the strategy in the 1990s to split stocks to attract new investors have come up. Ultimately, the data spiked in 1997 but the party continued in 1998 and 1999. With the proliferation of ETFs and the inability to sometimes include higher-priced stocks, one must wonder if we are in the beginning stages of a bigger trend, given several big names now splitting their stocks.
Why Split a Stock? Beyond the commonly cited reasons, there are a few other potential benefits of splitting a stock, especially now:
1.Since the recent announcements have come from popular, name-brand companies and they are still a novelty, every new stock split announcement is likely to generate headlines and be linked to the “cool” stocks, which can garner another look from investors. This is more relevant than ever as investing is increasingly driven by social media and headlines.
2. Splitting a stock may be useful for employee compensation. While retail investors have the ability to trade fractional shares on many platforms, employees cannot sell fractional shares from a company share grant. Lower prices also give a company more granularity when making stock awards to employees.
3. Similarly, lower prices give a company more control and flexibility in corporate actions involving stock (such as mergers/acquisitions).
4. A lower price can improve liquidity in the options market (since it also makes option contracts more affordable and fractional trading is not available for options) and liquidity in blocks (block desks may be more willing to commit capital to a block trade with more shares since commissions are paid on shares).
Here are three other things that stood out to us:
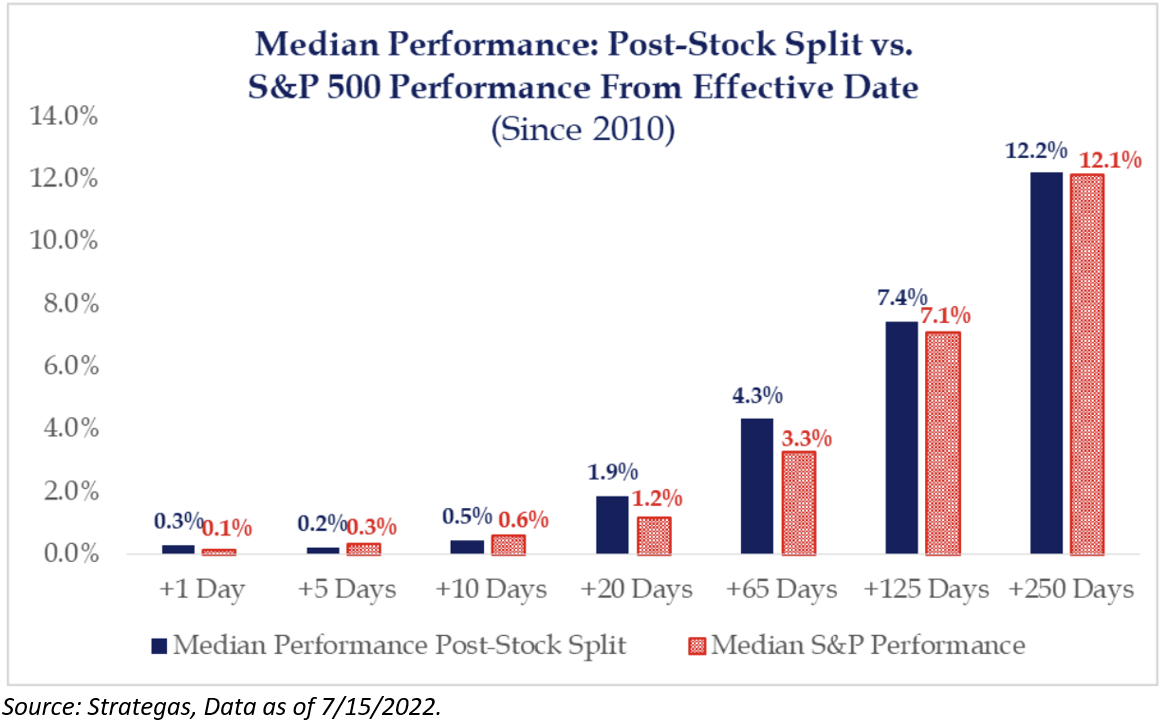
- Performance: Even though stock splits do not change the fundamentals of a stock, companies subject to stock splits have outperformed the S&P 500 on average the first day, 1 month, and 3 months after the effective date. However, looking at the longer term, performance is more in line with the overall market.
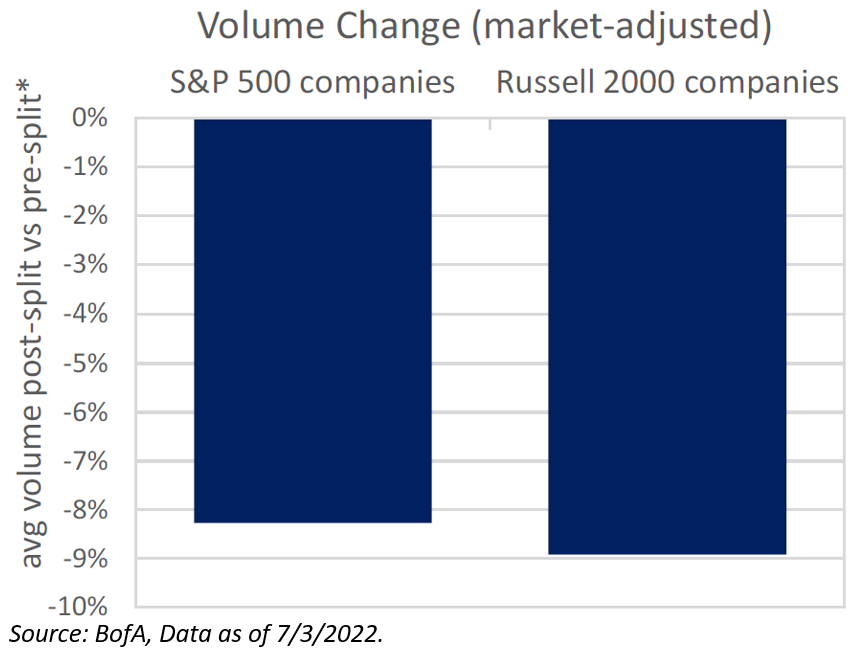
- Liquidity: The bid-ask spreads tended to decrease in both bps and cents. Secondly, volume decreased, but this may be skewed because the biggest trading occurs at announcement date — companies tend to make the effective date 1-month after the announcement — creating an artificially high comparison point for the pre-split activity.
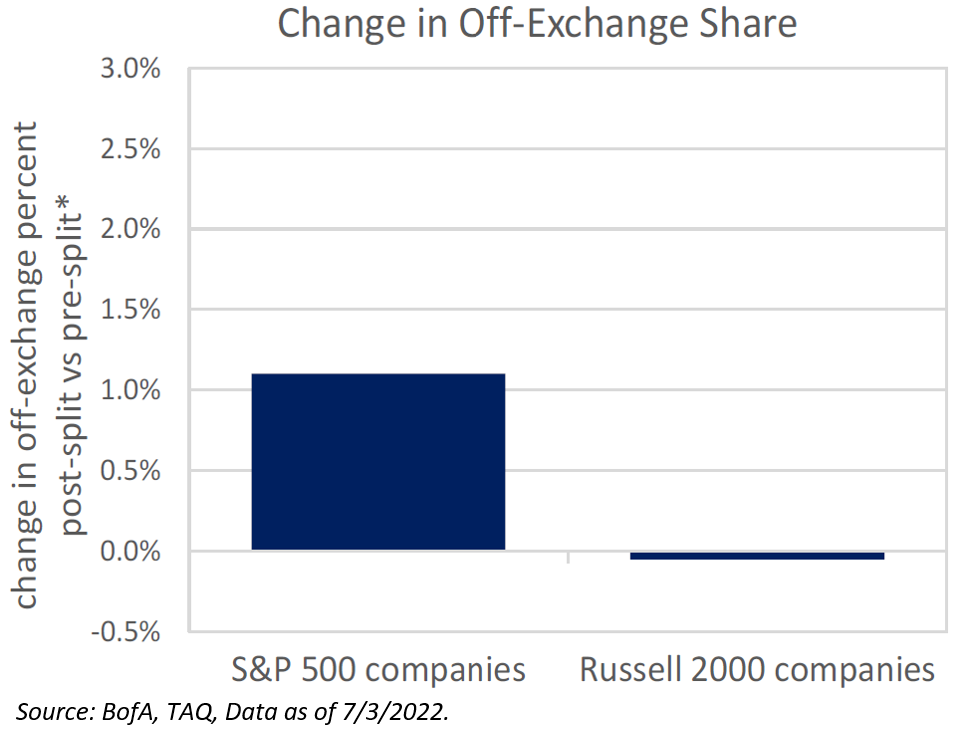
- Retail Trading Activity: Perhaps surprisingly, given that many say that splits are used to attract more retail traders (for whom a high share price might be prohibitively expensive), we do not see a significant increase in off-exchange volume* post split (only about a 1 percentage point change for S&P companies, on average, and no significant change for R2K companies). This may be because retail can already trade in fractional shares, making high share prices less of a barrier.
Let us know if you have any other questions regarding splits.
Disclosures
Past performance is not indicative of future results. This material is not financial advice or an offer to sell any product. The information contained herein should not be considered a recommendation to purchase or sell any particular security. Forward looking statements cannot be guaranteed.
This commentary offers generalized research, not personalized investment advice. It is for informational purposes only and does not constitute a complete description of our investment services or performance. Nothing in this commentary should be interpreted to state or imply that past results are an indication of future investment returns. All investments involve risk and unless otherwise stated, are not guaranteed. Be sure to consult with an investment & tax professional before implementing any investment strategy. Investing involves risk. Principal loss is possible.
The S&P 500® Index is the Standard & Poor’s Composite Index and is widely regarded as a single gauge of large cap U.S. equities. It is market cap weighted and includes 500 leading companies, capturing approximately 80% coverage of available market capitalization.
The S&P MidCap 400 Index comprises U.S. stocks that strike a middle ground between the largest (large-cap) and smallest (small-cap or micro-cap) public companies. These companies typically have market capitalizations of between $2 billion and $10 billion.
The S&P SmallCap 600® seeks to measure the small-cap segment of the U.S. equity market. The index is designed to track companies that meet specific inclusion criteria to ensure that they are liquid and financially viable.
The Russell 3000 is a market index that measures the performance of the top 3,000 U.S. publicly traded companies as ranked by market capitalization. The index’s broad reach means that the Russell 3000 tracks approximately 98% of all U.S. stocks. The Russell 3000 Growth Index is a market capitalization-weighted index based on the Russell 3000 index. The Russell 3000 Growth Index includes companies that display signs of above-average growth. The index is used to provide a gauge of the performance of growth stocks in the United States.
The Russell 2000® Index measures the performance of the small cap segment of the U.S. equity universe. The Russell 2000 Index is a subset of the Russell 3000® Index representing approximately 10% of the total market capitalization of that index. It includes approximately 2000 of the smallest securities based on a combination of their market cap and current index membership.
Advisory services are offered through Aptus Capital Advisors, LLC, a Registered Investment Adviser registered with the Securities and Exchange Commission. Registration does not imply a certain level or skill or training. More information about the advisor, its investment strategies and objectives, is included in the firm’s Form ADV Part 2, which can be obtained, at no charge, by calling (251) 517-7198. Aptus Capital Advisors, LLC is headquartered in Fairhope, Alabama. ACA-2207-25.