Before we dive in, if anyone needs any of our quarterly newsletters, presentations, updates, etc., feel free to reach out. Also, if anyone would like a quarterly market update call – hit me directly (david@apt.us). We have a lot of very thought-provoking commentary on how allocators should be handling this current environment – especially as benchmarks, such as the iShares Core Aggressive Allocation ETF (“AOA”), are in the top 1% versus managers on performance YTD. Many of the other benchmarks are in the same company.
Let’s hit earnings.
Q2 2023 Earnings Expectations
If you’ve read our stuff from the past year, you’d know that one of our themes for ’23 has been that inflation is going to transition to growth frustration. In a nutshell, these have been the two obstacles for the market to clear for more people to start believing in the market. First, inflation needs to be perceived to be coming back down to 2%. It feels as if we are getting there fast, barring a supply shock across the economy (if one excludes shelter from core CPI, y/y increase is only 2.6%). Earnings per share (EPS) expectations will become increasingly important to be able to keep the rally going. If you’re keeping score at home, we’ve been partially correct – the market has stopped worrying about inflation and has started focusing on earnings but the direction of earnings hasn’t happened yet. However, remember perspective; we are only one quarter in on the ’23 expectations (of four) and we are just starting Q2 earnings season.
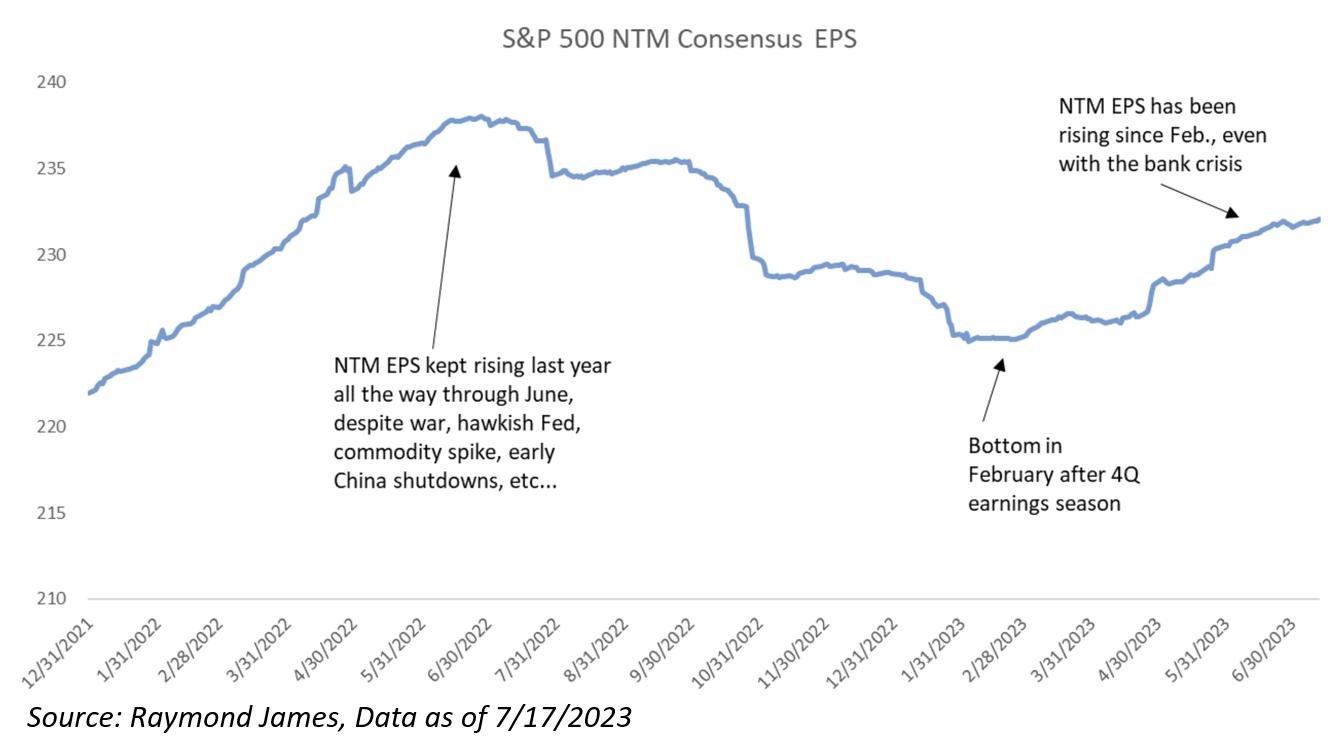
That takes me to the surprising aspect of S&P 500 12-month forward earnings per share expectations – it has been increasing. But the increase in the next twelve-month (NTM) expectations have basically all come from Q1 ’24 (which is now included in the formula and you can see the uptick in the below chart), as ’23 expectations have partially come down.
Is this growth sustainable? Possibly. But we’ve continued to see deceleration across the spectrum… on a nominal basis. For example, savings rates for consumers have begun to normalize, but I believe, still have more room to go. Savings rates in May were 4.6%, up slightly from April, but generally has been 4-5% all year, up from a low of 2-3% last summer. Personal income increased +6.0% y/y, generally the same rate as last month, as personal consumption slowed from 8.1% in January. Per Raymond James, if savings rates were to normalize by end of 2024, consumer spending would slow ~-4% y/y from today’s levels to ~+2%-3%.
We are about to learn a lot over the next few months as earning season progresses and we watch consumer’s willingness to spend, as their year-over-year (YoY) purchasing power has turned negative – which tends to coincide with a recession.
Focusing on Q2 ’23 Earnings
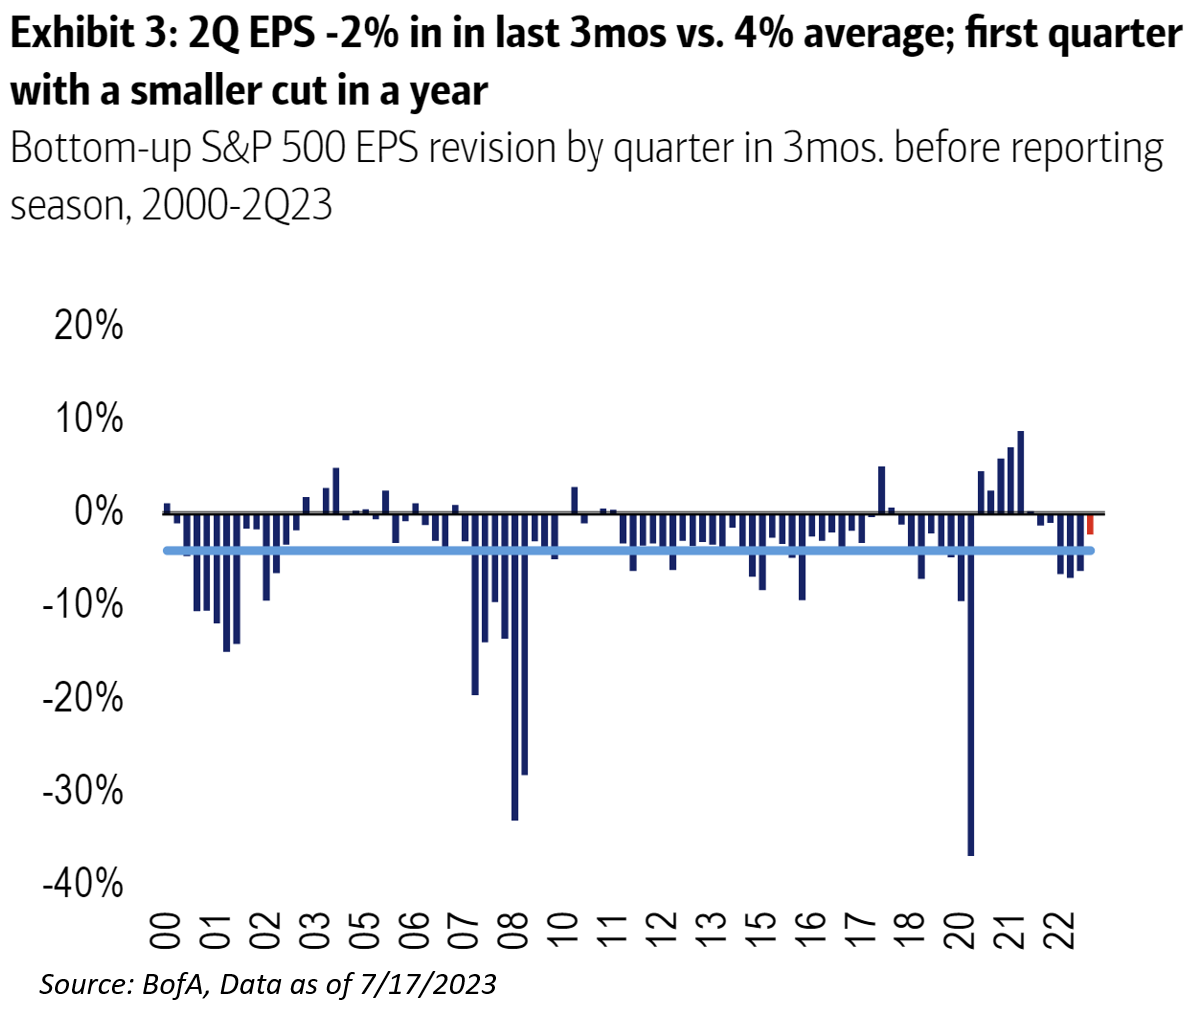
S&P 500 Q2 consensus EPS was cut by just 2% since March, half of the typical pre-season 4% cut, with the heftiest downward revisions in Energy and Materials. Expectations now stand at $52.88 (-8% YoY). The macro environment in Q2 was much stronger than expected heading into the quarter. Despite the banking scare in March, the economy proved to be more resilient, with incoming macro data topping consensus expectations by the biggest margin since Q3 2020 (per BofA). While banks are tightening, structural shortages (e.g. housing), ample liquidity from private markets, and lower sensitivity between earnings and credit post-GFC are pointing to some earnings resiliency – for the fifth straight quarter. The market has a recent track record of rallying during earnings.
The reason for the majority of index EPS cuts have come from the Energy sector – which means that there has been a lot of resiliencies elsewhere; think Industrials. The S&P 500 Energy sector is expected to report an outsized negative earnings growth rate of -46% for Q2 ’23. The caveat here is the difficult comps from elevated commodity prices due to the onset of the Russia/Ukraine conflict that sent WTI crude oil over +$100 bbl. On an index basis, the disparity between Ex-Energy earnings is +500 bps with the S&P 500 expected to report -8.1% earnings growth (as mentioned above) but the S&P 500 Ex-Energy at just -2.6%. So, the -8% may not sound great, but is it really bad?
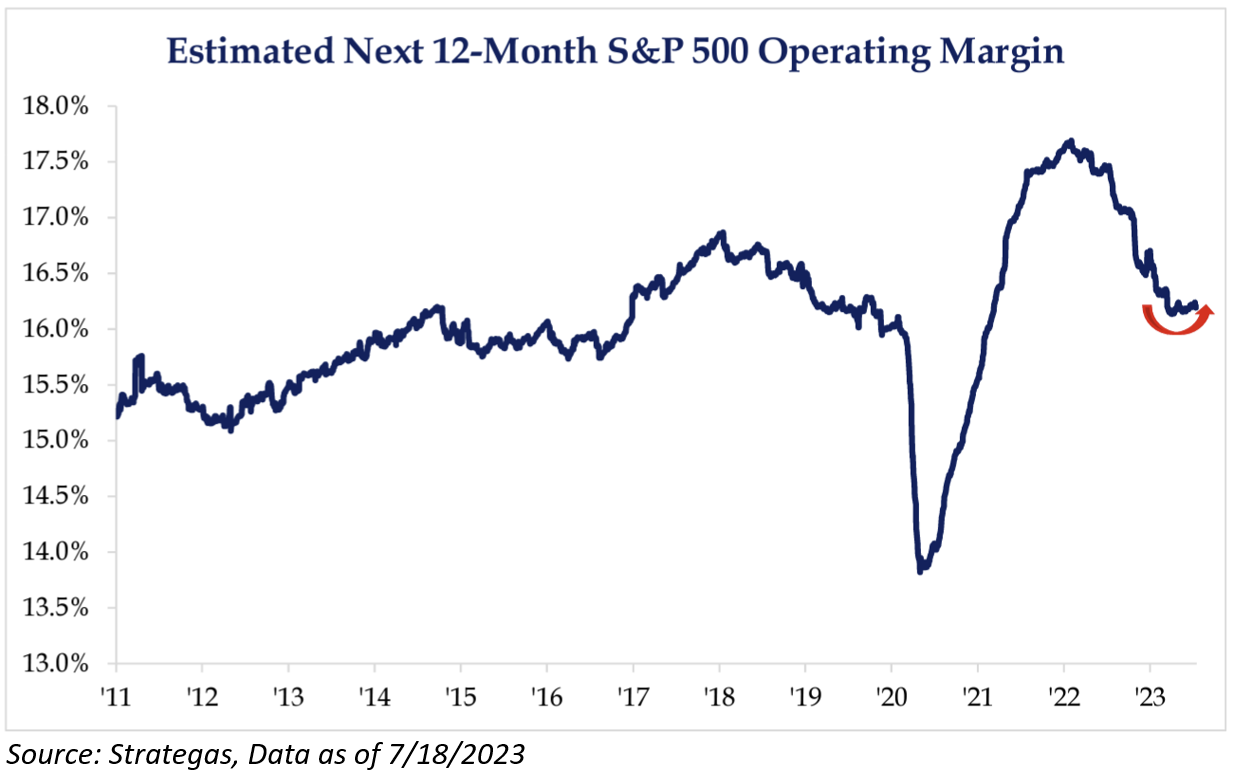
I know that I’ve sounded very negative here, but there are definitely some positives. Just look at S&P 500 margins, as they have somewhat stabilized. It’s no secret that margins have been in a precipitous decline after peaking in Q1’22 as inflation continues to take a larger portion of the bottom line of operators. However, we’re finally starting to see signs of stabilization after +15 months of declines. Guidance will be key this earnings season to determine the durability of the stabilization we’re seeing on the margin front.
Profitability of the S&P 500 has been at the forefront of the AI-revolution and they have been moderating, even before the market has witnessed any tangible effects from this innovation.
Overall, macro uncertainty remains, but it appears that investors are expecting Q2 ’23 to be the trough in YoY EPS expectations, which could remain a catalyst for risk assets. Momentum has continued to build, as May was better than April, June was better than May, and this has continued in July. As always, I’ll be focusing on management commentary that could potentially sound more upbeat than previous quarters. Companies are likely to highlight bottoming process in business conditions and building momentum throughout the quarter and into July. And if that’s the case, keep your head on a swivel because the pain train could be coming – Terry Tate Linebacker style.
Disclosures
Past performance is not indicative of future results. This material is not financial advice or an offer to sell any product. The information contained herein should not be considered a recommendation to purchase or sell any particular security. Forward-looking statements cannot be guaranteed.
Projections or other forward-looking statements regarding future financial performance of markets are only predictions and actual events or results may differ materially.
This commentary offers generalized research, not personalized investment advice. It is for informational purposes only and does not constitute a complete description of our investment services or performance. Nothing in this commentary should be interpreted to state or imply that past results are an indication of future investment returns. All investments involve risk and unless otherwise stated, are not guaranteed. Be sure to consult with an investment & tax professional before implementing any investment strategy. Investing involves risk. Principal loss is possible.
The S&P 500® Index is the Standard & Poor’s Composite Index and is widely regarded as a single gauge of large cap U.S. equities. It is market cap weighted and includes 500 leading companies, capturing approximately 80% coverage of available market capitalization.
The Core Consumer Price Index (CPI) measures the changes in the price of goods and services, excluding food and energy.
Advisory services are offered through Aptus Capital Advisors, LLC, a Registered Investment Adviser registered with the Securities and Exchange Commission. Registration does not imply a certain level or skill or training. More information about the advisor, its investment strategies and objectives, is included in the firm’s Form ADV Part 2, which can be obtained, at no charge, by calling (251) 517-7198. Aptus Capital Advisors, LLC is headquartered in Fairhope, Alabama. ACA-2307-25.
