I want to start here:
“Given that the stock market tends to go up more than down (60-70% of the time), odds are the current trading range is a prelude to another advance. Corrections can be in the form of price and/or time, and this one seems to be both. Usually, the P/E part of the market return does the opposite of the earnings part. This is what makes market timing so challenging, especially around cyclical inflection points.”
– Jurrien Timmer
Let’s say that again. ” Corrections can be in the form of price and/or time, and this one seems to be both”. This is a very important line because I know that many folks are having difficult conversations with their clients, given that their account values have not increased in value over the last two years. For reference, the S&P 500 (which has been one of the best-performing asset classes) has not had a positive return (cumulative) in over 2+ years.
If you’d like to talk more about that, please feel free to reach out.
Q3 2023 Earnings Review
The biggest surprise to me during earnings season: I’ll admit that this is anecdotal, but from CEO commentary, they are acknowledging macro difficulties, but not many CEOs mentioned the word “recession” during their earnings calls. Interesting.
It’s official; the earnings recession is over. With the majority of the S&P 500 done reporting, it looks as if after three quarters of negative earnings growth, the earnings recession is over – Q3 ‘23 earnings growth is coming in at ~5.7%. Estimated revenue growth also came in stronger than expected (+1.2%) and, at the same time, appears to have found an inflection point. Both earnings and revenue growth outpaced the expectations set out by analysts at the beginning of the quarter (in early October).

This data was reaffirmed by the fact that the market witnessed the highest percentage of companies beating estimates since Q2 ’21. Around 82% of companies beat expectations this quarter, which is well above the historical beat rate of 66% (data since 1994). Overall, lower EPS revisions are well above the historical trends, suggesting that the earnings deterioration that is often talked about did not materialize. Even looking out to ‘24 shows that the -1.9% decline is not yet concerning and normal for this point in the earnings revision pattern.
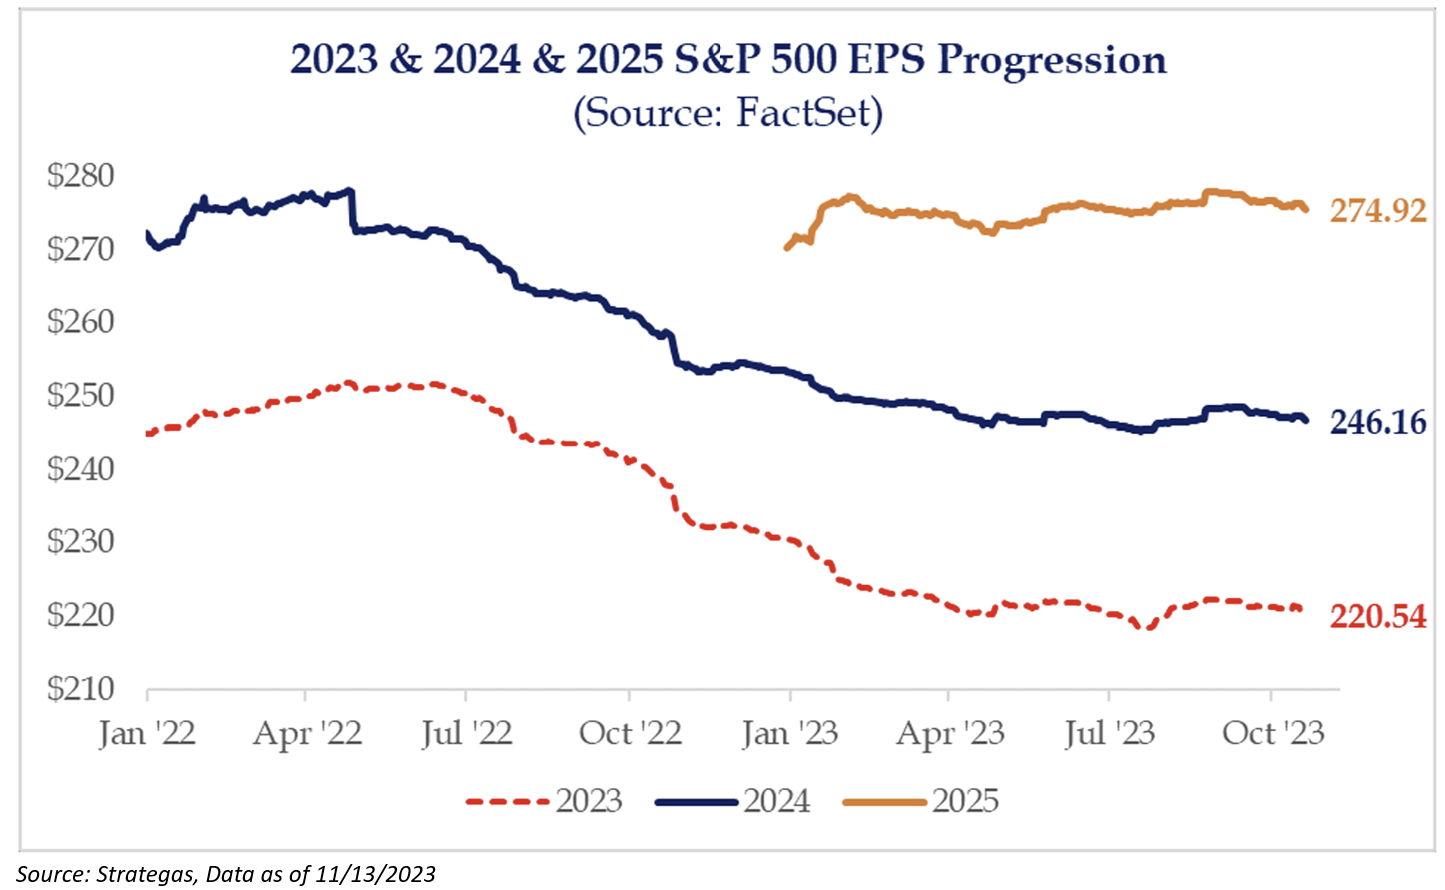
If earnings for 2023 finish in the $218 to $221 range, it would equate to flat earnings compared to 2022 and the estimated earnings growth rate of 12% for 2024 would result in a 2-year CAGR that is in line with the long-term CAGR of S&P EPS going back to 1950. Obviously, the growth asymmetry between ’24 and ’25 is unusual, but no need to focus on that right now because the market isn’t focusing on it.

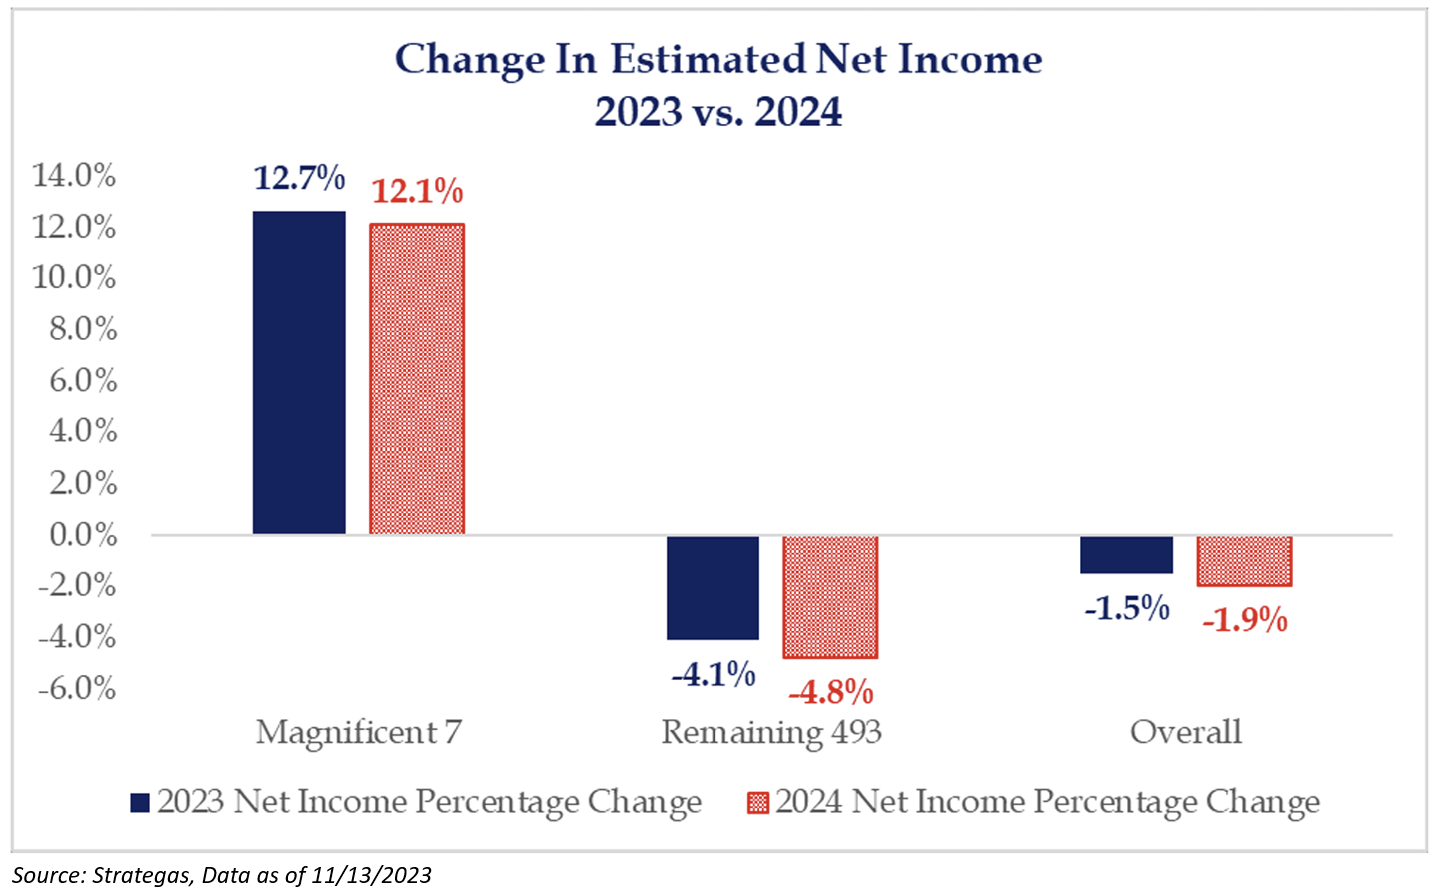
Let’s look at earnings from a different focal point. The Magnificent Seven continues to hold up earnings for the index. Looking at the change in net income shows that the Mag Seven returns this year are likely justified (I know I’ll catch flak for saying this).
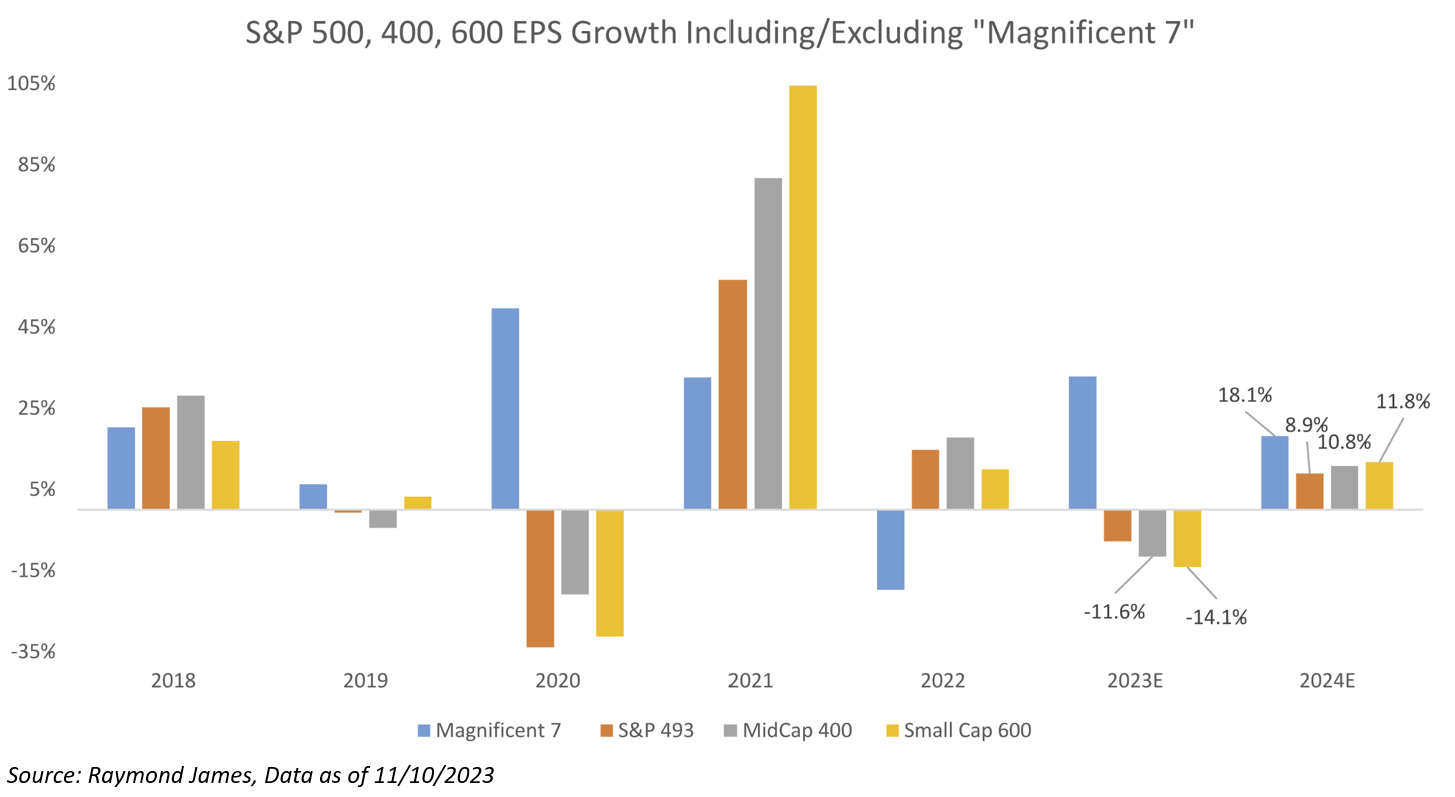
As shown below, the “Magnificent 7” EPS growth trend has been divergent from the rest of the equity market in three of the last four years. This year is no exception for “the Magnificent 7”: the ~27% weighting in the S&P 500 has had material double-digit EPS growth this year, while the rest of the S&P 500, Mid-Cap 400, and Small-Cap 600 have EPS down ~5% to 15%.

This corporate earnings weakness has occurred even as the economy has, in our opinion, been far better than expected. More evidence that nominal GDP is probably more impactful to corporate EPS trends than real GDP, and nominal GDP has been slowing consistently all year on a year-over-year basis.
For 2024, consensus expectations are for EPS growth to be double-digit across equity indexes and the Mag Seven. This looks aggressive to us in a world where the Fed remains very restrictive, and the slowing of consumer spending and nominal GDP is likely to continue. Luckily, P/Es across most of the equity indexes excluding the Mag 7 are well below “normal” under anyone’s definition, so investors are clearly prepared for some kind of further EPS weakness.
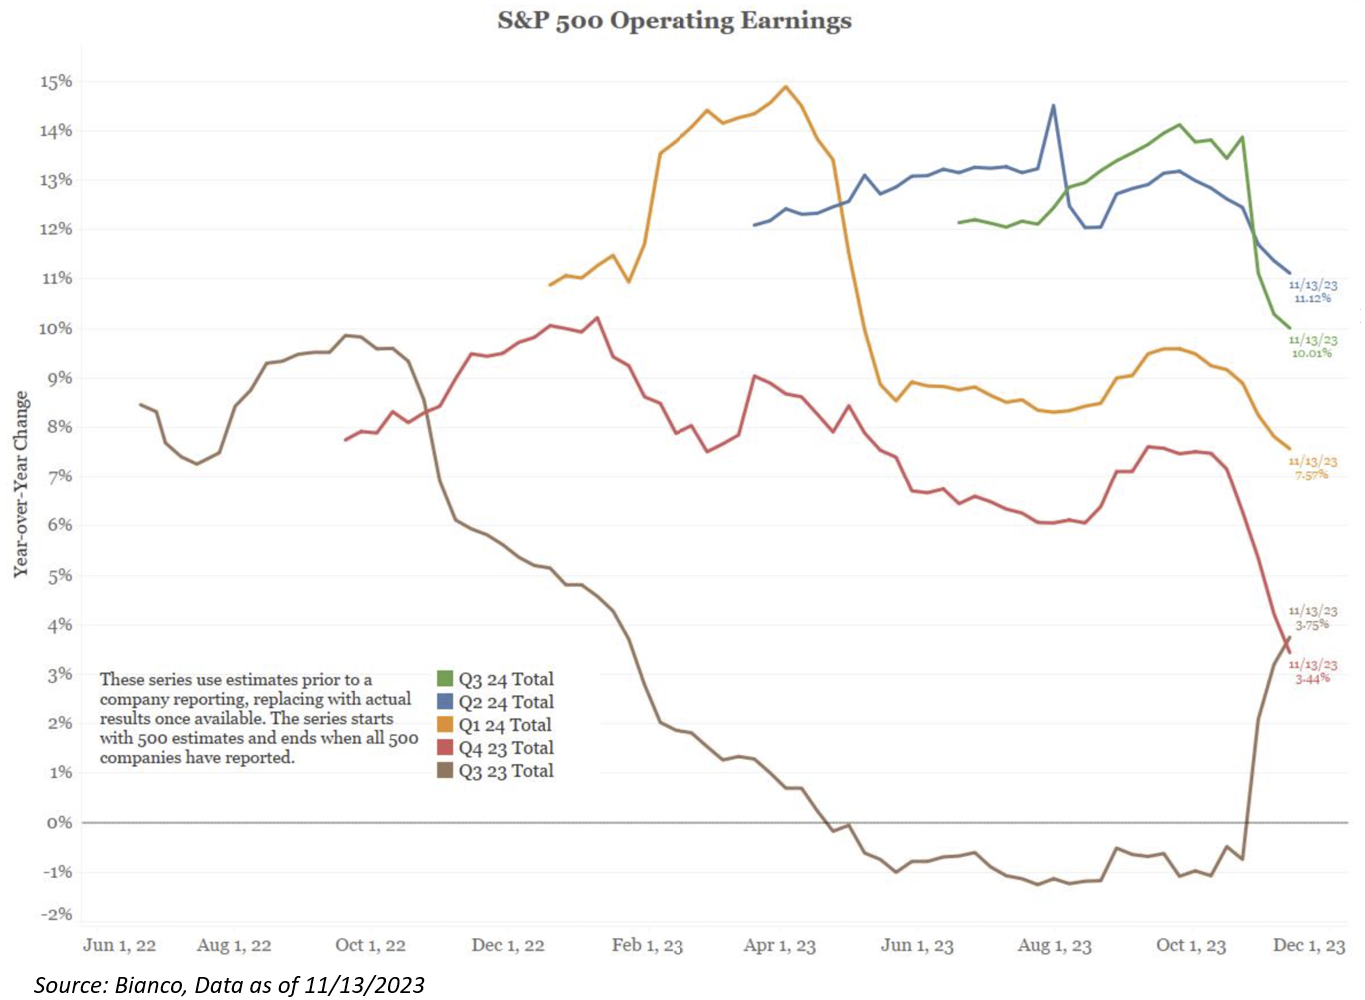
Big Point: This is probably the chart that I am focusing the most on because it shows the cadence of earnings expectations for future quarters. As I stated above, ’24 growth expectations have only come down slightly, but the quarterly data is starting to trend lower. The outlier here is this past quarter, Q3 ’23 (Brown line) trending higher:

As always, reach out with questions!
Disclosures
Past performance is not indicative of future results. This material is not financial advice or an offer to sell any product. The information contained herein should not be considered a recommendation to purchase or sell any particular security. Forward looking statements cannot be guaranteed.
This commentary offers generalized research, not personalized investment advice. It is for informational purposes only and does not constitute a complete description of our investment services or performance. Nothing in this commentary should be interpreted to state or imply that past results are an indication of future investment returns. All investments involve risk and unless otherwise stated, are not guaranteed. Be sure to consult with an investment & tax professional before implementing any investment strategy. Investing involves risk. Principal loss is possible.
Advisory services are offered through Aptus Capital Advisors, LLC, a Registered Investment Adviser registered with the Securities and Exchange Commission. Registration does not imply a certain level or skill or training. More information about the advisor, its investment strategies and objectives, is included in the firm’s Form ADV Part 2, which can be obtained, at no charge, by calling (251) 517-7198. Aptus Capital Advisors, LLC is headquartered in Fairhope, Alabama. ACA-2311-13.

