Q4 ’22 Earnings Season
Given current levels of Nominal GDP (+7.3% YoY) & Real GDP (+2.1% YoY), it appears that a recession has been delayed, but the market has begun to witness an EPS downturn.
Almost 85% of the S&P 500 constituents have reported earnings for Q4 ’22.
- Q4 Figures: Sales Growth: +5.0% & Earnings Growth: -2.8%
- Q4 ‘22 EPS is tracking 1% below analyst’s expectations, when this quarter’s earnings have historically beaten consensus by 4% (think stronger-than-anticipated Christmas seasonality)
- 69% of companies that have reported have beaten expectations, which is below the 1YR avg. of 75% and the 10YR avg. of 77%
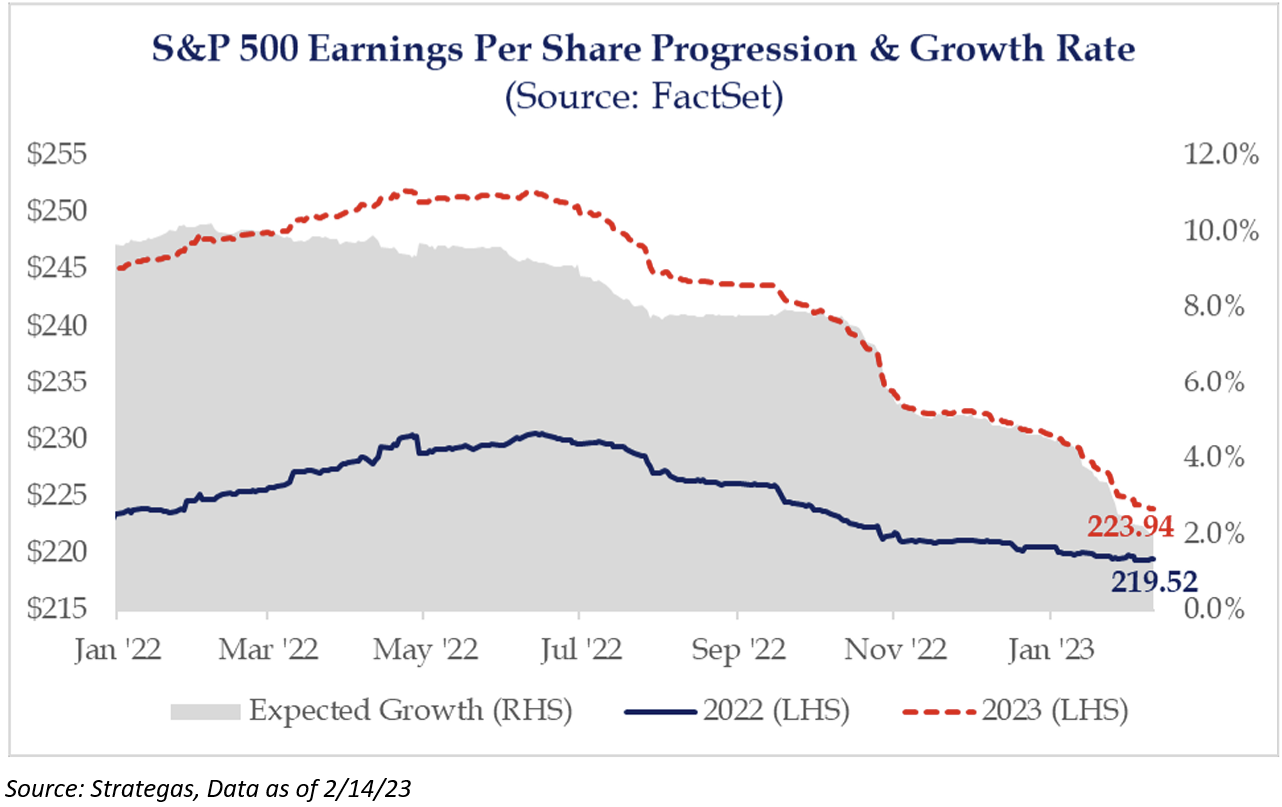
The biggest standout to me has been the amount of weak guidance previews that have drug down ’23 EPS expectations by 3% (since 12/31/22). The majority of this decline has come from weaker-than-expected margins in the future, but this has been a well-documented risk to this year’s fundamental story. Per management commentary, companies have started to address cost bloat aggressively, but my guess is that there likely needs to be more.
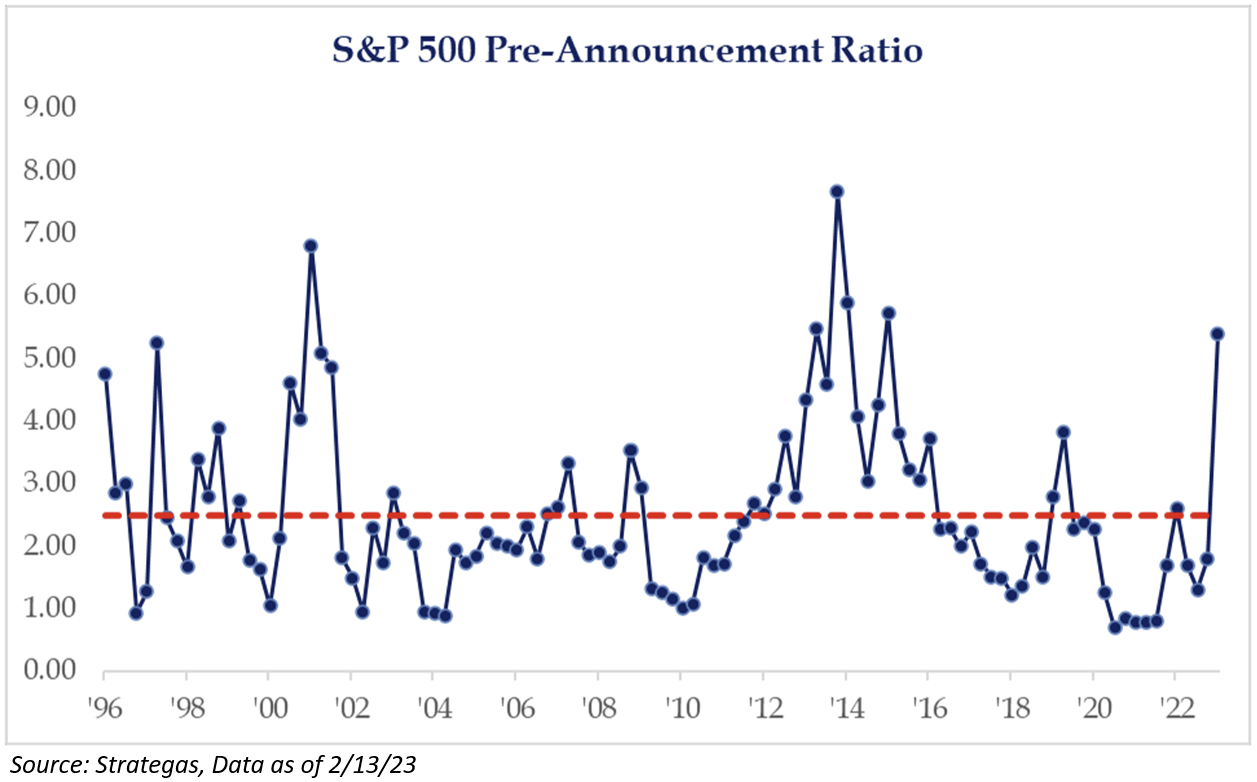
Although it is still early to look at the pre-announcements for the first quarter, the ratio has jumped noticeably to more than five negative pre-announcements for every positive one. The last time saw this type of reading was during the first quarter of 2015, which proved to be a mid-cycle slowdown. Before that, it was during the Tech bubble in 2001.
This year’s EPS consensus has been cut 12% since June, more than double the average cut over the same period – I try to keep the same below photo for consistency purposes:
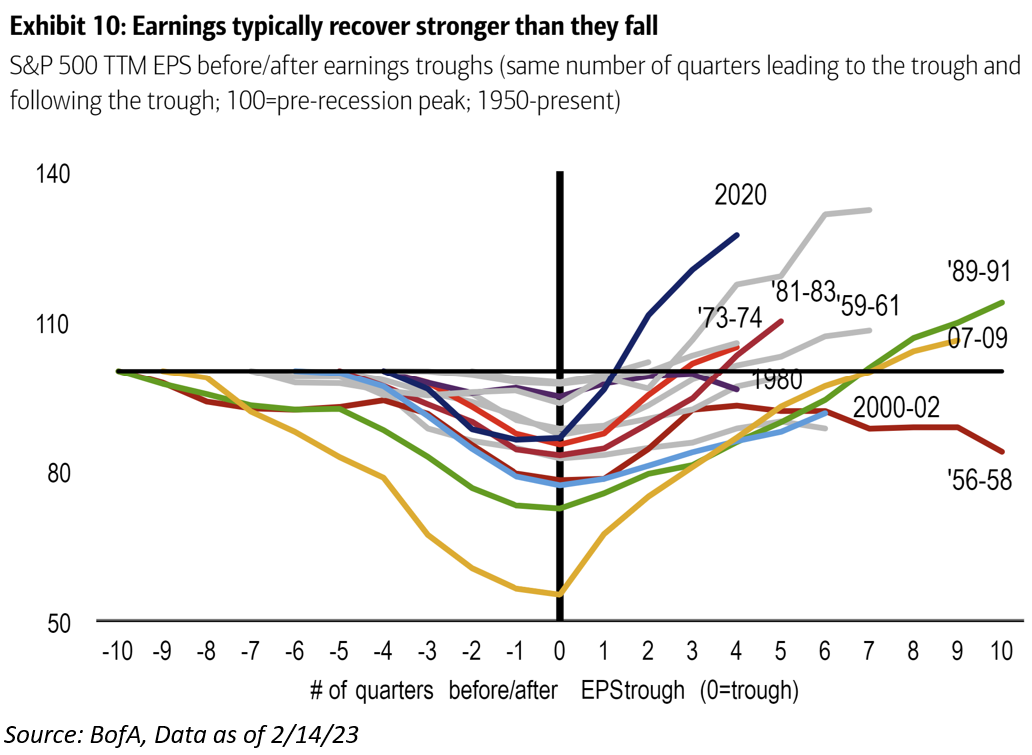
Moving past ’23 EPS expectations into ’24 EPS growth, we believe that there remains some room for these figures to come down. In ’24, the market expects earnings to grow +9.6% to $245.55. My guess is that the market continues to anticipate a “Fed Pivot” which would keep these figures more insulated. We disagree with that logic and expect figures to compress. The story next year could get more interesting with easier comps, as history tells us that earnings have a track record of recovering faster than they drop (photo below). The wildcard in future earnings (which the market should not be focusing on until July) could be that companies could have a leaner cost structure and productivity gains after a strong capex/R&D cycle that could provide the offset to margin pressure (deglobalization, higher interest expenses).
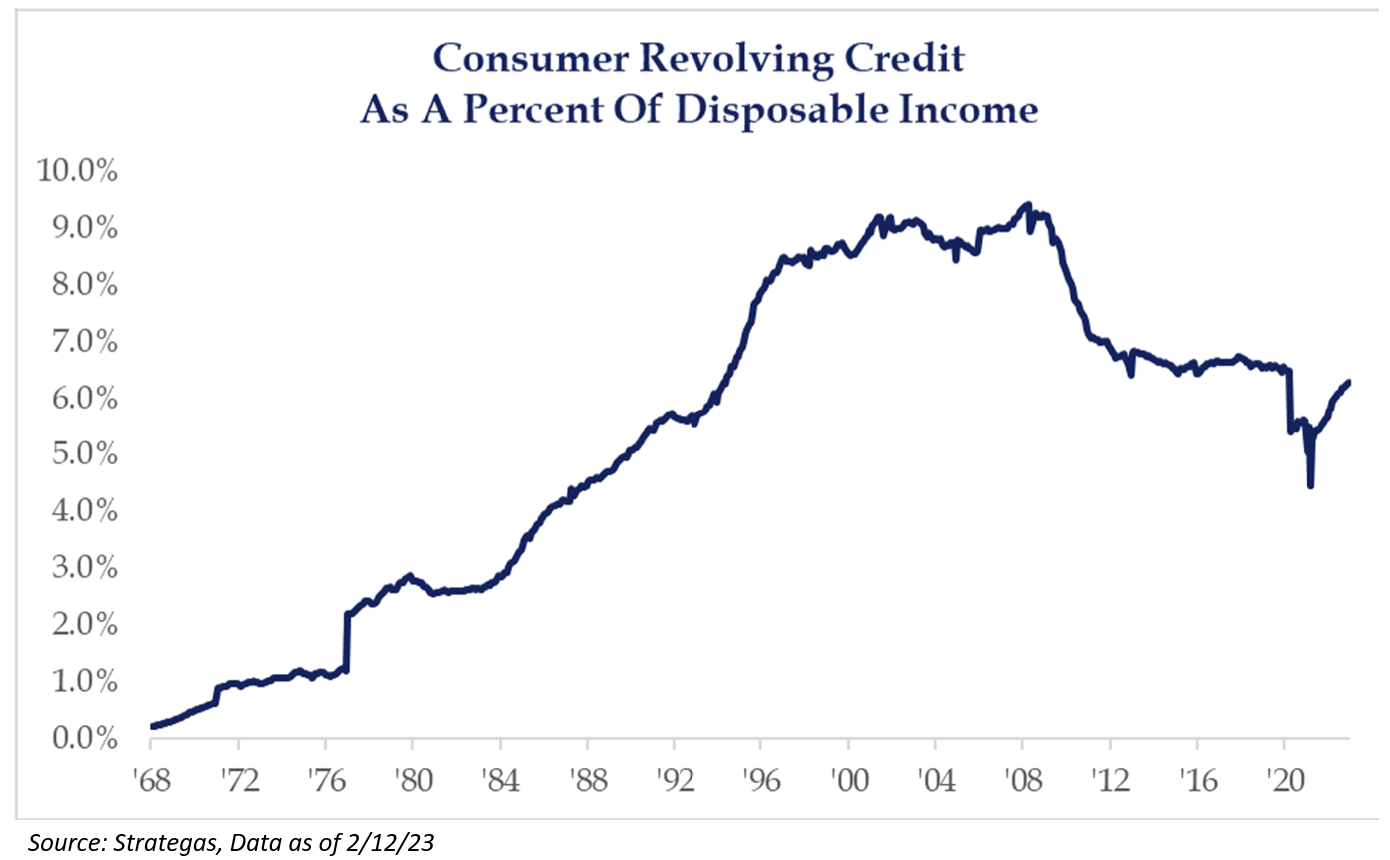
The other wildcard for earnings continues to be the strength of the consumer, which has helped the market rally during each of the last three reporting cycles. Outside of the inflated individual balance sheets, consumers have also been tapping the credit markets, which shows individuals may not be as tapped out as previously thought. In absolute terms, revolving credit looks high, but when looking at revolving credit as a % of disposable income, the picture is less dire. At 6.3% today, compared to an average of 6.6% from 2012-2019, there is still room for it to expand further. Basically, meaning that consumers may be able to spend for much longer than anticipated.
Disclosures
Past performance is not indicative of future results. This material is not financial advice or an offer to sell any product. The information contained herein should not be considered a recommendation to purchase or sell any particular security. Forward looking statements cannot be guaranteed.
This commentary offers generalized research, not personalized investment advice. It is for informational purposes only and does not constitute a complete description of our investment services or performance. Nothing in this commentary should be interpreted to state or imply that past results are an indication of future investment returns. All investments involve risk and unless otherwise stated, are not guaranteed. Be sure to consult with an investment & tax professional before implementing any investment strategy. Investing involves risk. Principal loss is possible.
The S&P 500® Index is the Standard & Poor’s Composite Index and is widely regarded as a single gauge of large cap U.S. equities. It is market cap weighted and includes 500 leading companies, capturing approximately 80% coverage of available market capitalization.
Advisory services are offered through Aptus Capital Advisors, LLC, a Registered Investment Adviser registered with the Securities and Exchange Commission. Registration does not imply a certain level or skill or training. More information about the advisor, its investment strategies and objectives, is included in the firm’s Form ADV Part 2, which can be obtained, at no charge, by calling (251) 517-7198. Aptus Capital Advisors, LLC is headquartered in Fairhope, Alabama. ACA-2302-18.
