A common misconception in the market is that it is difficult to invest in small-caps due to concerns regarding size and liquidity. Understandably, this could have been the case a few decades ago, but we don’t believe that remains true in today’s world. Over the last decade, the median small-cap market capitalization had doubled to $1.4B, with the top end of the index, as of reconstitution, being $5B. For reference, ten years ago, it was just $2B. More importantly, we believe that this misconception leaves many investors missing out on a differentiated and lower correlation return driver in an asset allocation.
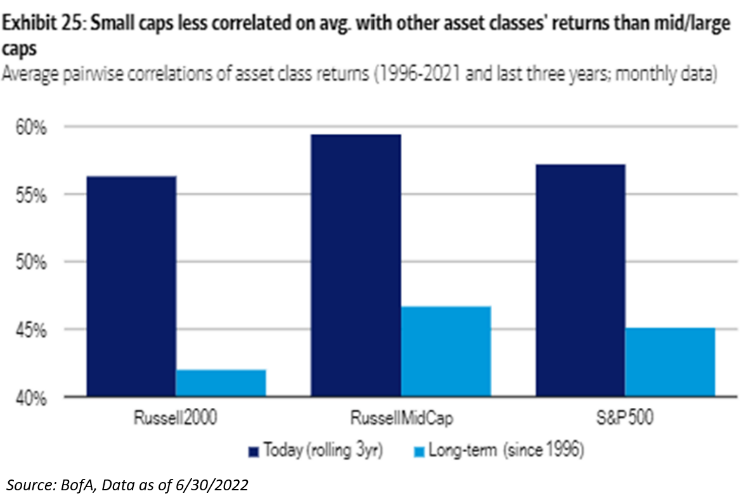 Overall, asset class performance has grown more correlated in recent decades: the average rolling three-year correlation of asset class performance was 47%, up significantly from 7% twenty years ago. But the Russell 2000 is a better diversifier than the Russell MidCap and the S&P 500. It is the least-correlated equity index, on average, with global asset class returns both over the last several years and over the last several decades.
We believe investors need to think small for big differentiation in asset allocations moving forward due to the following reasons:
- From a valuation standpoint, small-caps have historically traded at a premium to large-caps, but currently receive a large discount, as the market has priced in a draconian recession in the asset class.
- Small-caps have less exposure to the global economy; a potential tailwind when considering weakening global growth and a stronger U.S. dollar.
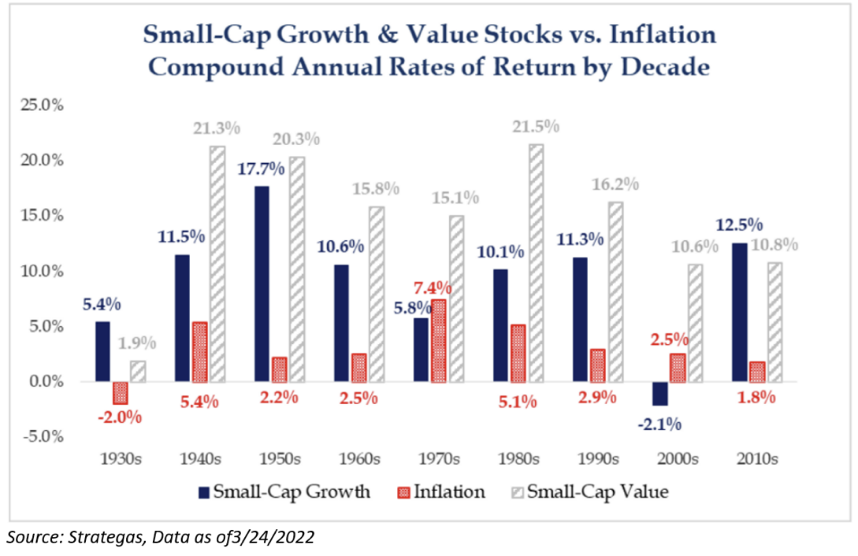
- Small-cap value is the only major asset class to outpace inflation in every decade going back to the 1930’s.
What is Priced in?
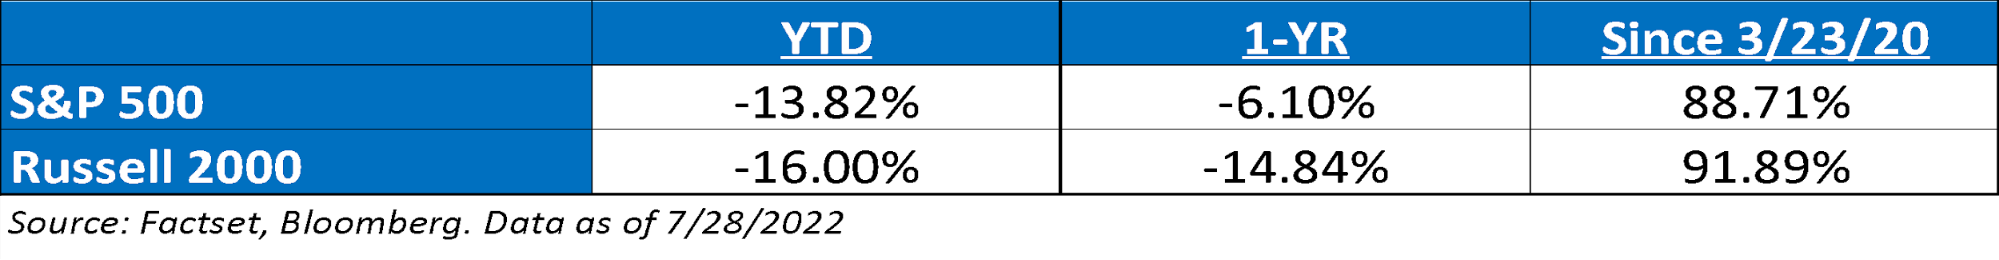
What prompted this discussion is the relative performance difference between U.S. large-caps v. U.S. small-caps. Over the last year, small-caps have underperformed their larger cap brethren. Not only that, both asset class have nearly identical returns since the Market bottom in 2020. Given this, we asked ourselves – what is the market pricing in?
It’s no secret that small-caps tend to underperform during a recession, but we believe that these risks are largely priced in right now. We also believe that small-caps are better positioned to weather today’s backdrop of higher-for-longer inflation, de-globalization, and geo-political risks.
We believe that most of the recessionary risks are largely priced in for three reasons:
- As of 07/31/2022, Russell 2000’s recent 32% decline is >80% of the 36% avg. recessionary decline;
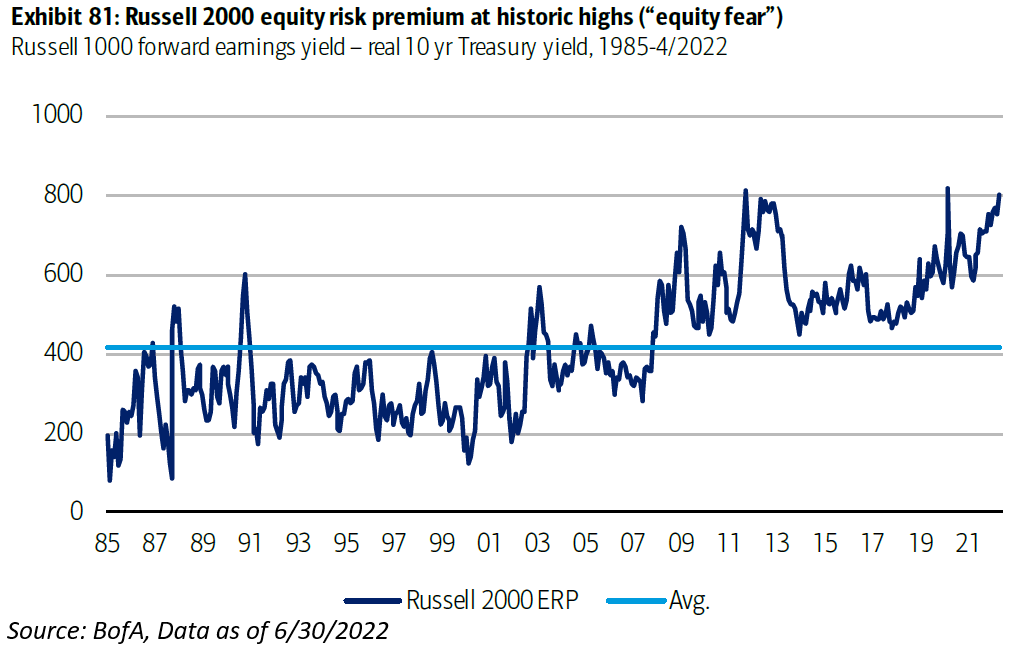
- Russell 2000 equity risk premium (ERP) is well above historical averages;
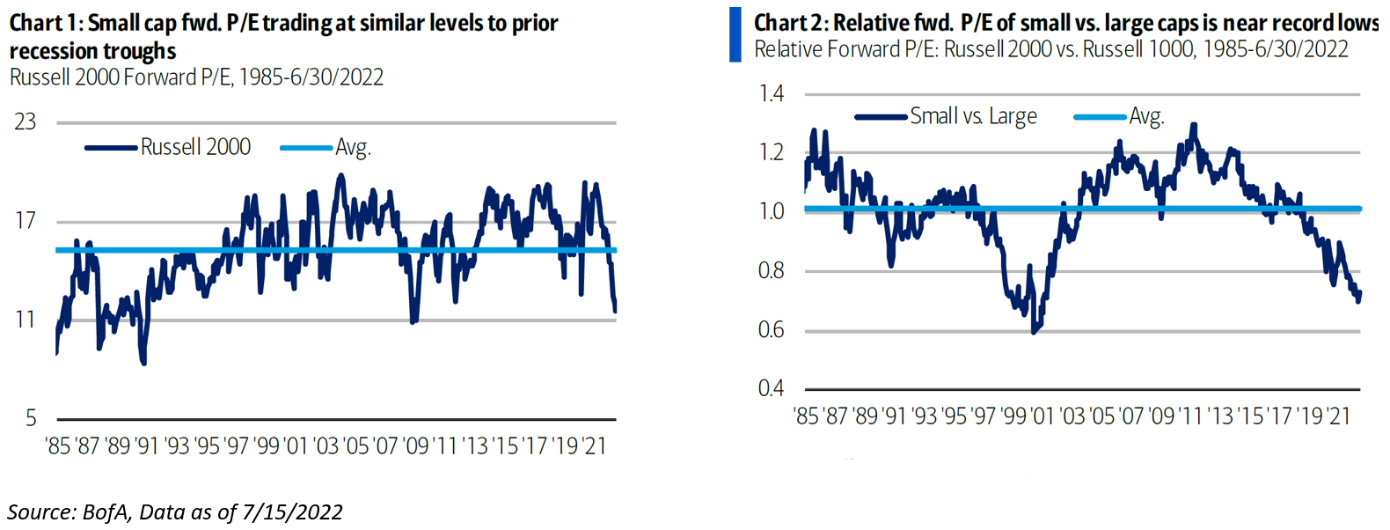
- Russell 2000 forward P/E is in-line with previous recession lows (40% off highs vs. -33% on avg. in prior recessions), and the relative P/E vs. large-caps is near record lows.
The Valuation Game Changer
Valuations have limited predictive power on stock returns over shorter timer horizons, but matter a lot over the long-term. While the relationship is lower for small-caps than for large-caps (P/E explains ~80% of the variability in subsequent 10-year S&P 500 returns), the forward P/E of the Russell 2000 explains nearly half of returns over the subsequent 10 years, with a similar relationship for the relative P/E of small vs. large caps and subsequent Russell 2000 vs. Russell 1000 10-year returns. Relative valuations today are at 30-year lows – levels seen only during the Tech Bubble, which preceded a great decade for small-caps.
The relative forward P/E of the Russell 2000 vs. Russell 1000 sits at 0.73x, still nearly 30% below its average of 1.01x.
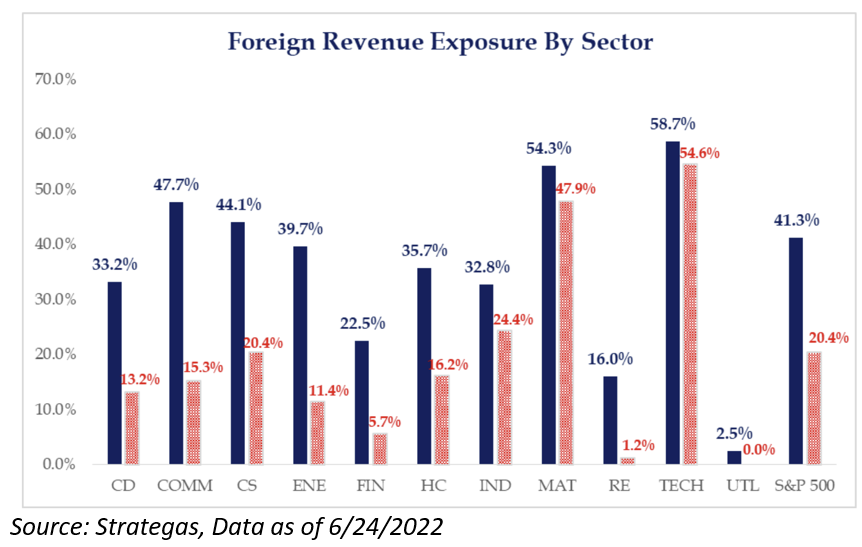
The valuation discrepancy is somewhat of a head scratcher, as it is no secret that Europe appears to be worse off from an economic standpoint relative to macro in the U.S. small-caps. Given the international exposure in large-caps, it should come as no surprise that U.S. small-caps receive more revenue domestically, thus, we believe that their earnings may be more insulated in a global recession. Furthermore, if we are at peak globalization, we believe that there will be more tailwinds for these domestically oriented companies.
Equity Risk Premium (ERP) – How Bad is Sentiment
The equity risk premium (ERP) is the amount of additional return beyond the risk-free rate that investors require as compensation for accepting the investment risks and costs associated with owning stocks. A low ERP suggests equity optimism, while a high ERP suggests equities are perceived as being risky. Below we show the ERP based on the Russell 2000, measured by the difference between the forward earnings yield and real 10-year Treasury yield, which currently sits at historical highs seen during COVID, the European crisis of 2011-2012, and even above Global Financial Crisis highs.
Inflate the Ego
After some choppy performance over the past year, we are hoping that small-caps will once again show some signs of life. With inflation top of mind for almost all investors, we thought it was worth reiterating that since the 1930s, the only major asset class to outperform inflation in each decade is small-caps, specifically value. Large-cap peers lagged behind inflation in the 1930’s, 1970’s, and 2000’s.
Small-caps have surprisingly exhibited better pricing power historically, where we found that small-cap margins have been less negatively correlated with various types of inflation that large-cap margins, or in some cases, more positively correlated. And while equities have underperformed other asset classes in stagflationary environments, small-caps have historically outperformed large-caps.
Knowing Your Benchmark
Most importantly, when comparing performance, valuation metrics, and growth compositions for both U.S. large and U.S. small, it’s imperative to understand the sectors exposures underneath the hood of each asset class.
Simply put, depending on where you allocate, you have some substantial bets:
- U.S. Large: Investors are betting on Technology, specifically the mega-caps.
- U.S. Small Value: Investors are betting on Cyclicals and Financials, i.e., Banks and Energy.
- U.S. Small Growth: Betting on non-earners (close to 50% of the index) and biotech /pharmaceuticals.
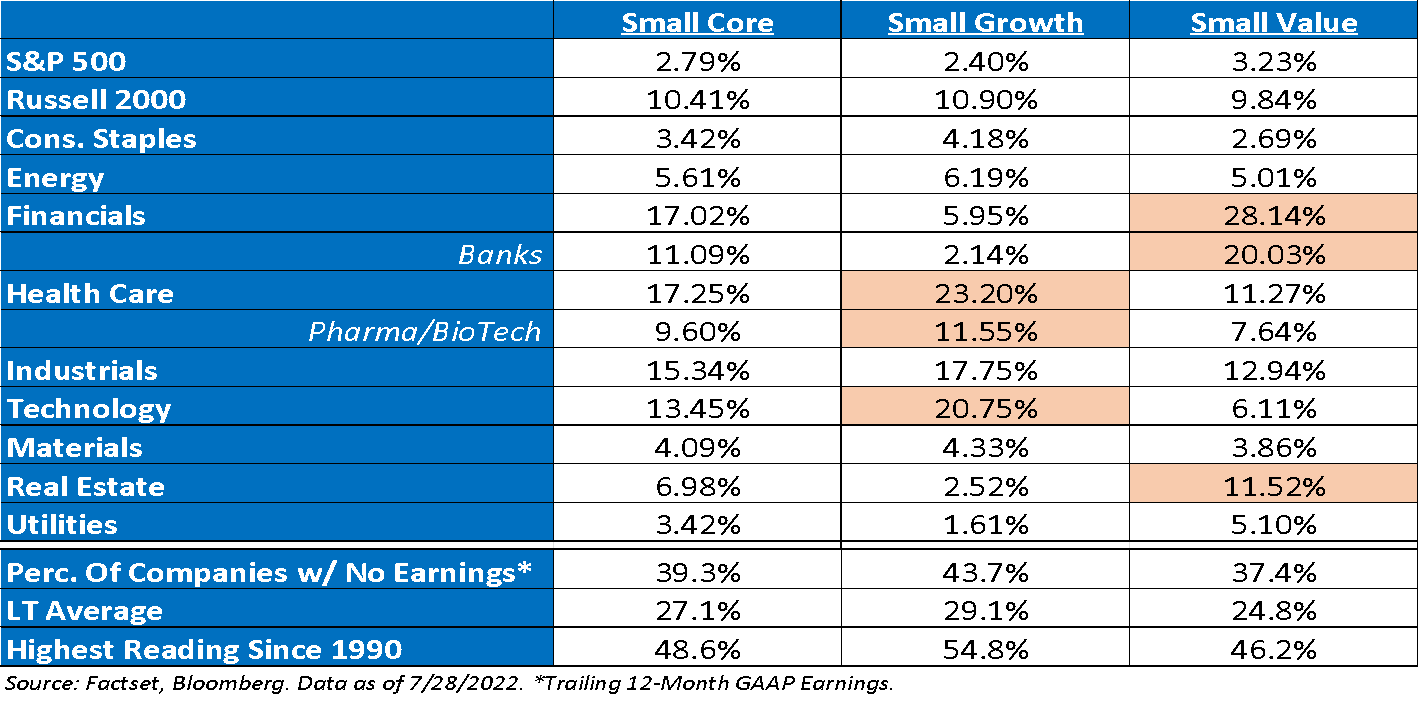
Sector allocations as of 07/28/2022
While we have given a few good reasons to tilt a diversified portfolio toward smaller capitalization shares, we believe the most important factors in determining relative performance will not be market capitalization, but rather financial health, such as cash on hand, free cash flow, and, most importantly, earnings. As you can see above, the small-cap indices are littered with companies that do not have positive earnings.
As we begin to transition away from a Quantitative Easing Environment to a Quantitative Tightening Environment, investors should focus on the characteristics that we believe are considered “higher quality”.
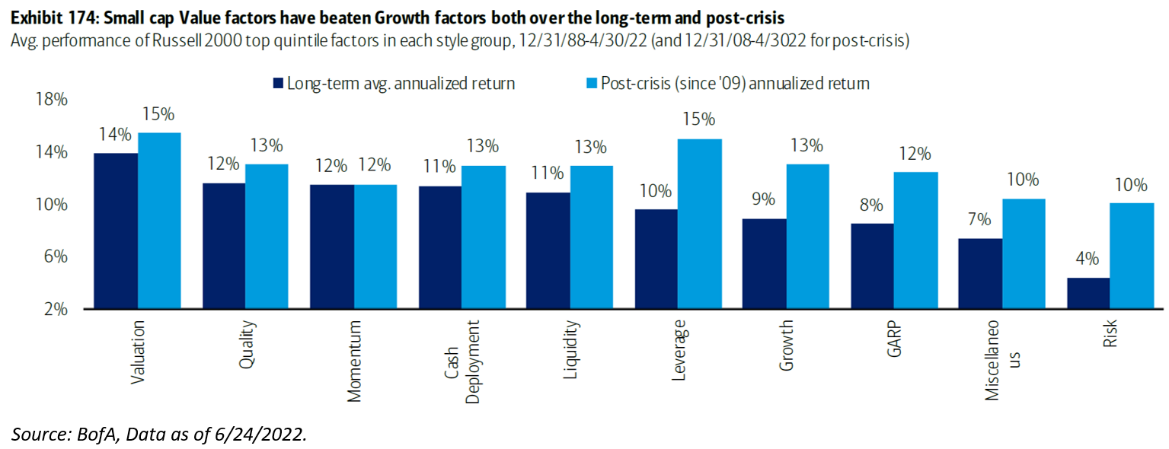
Pairing Value with Quality has been one of the best ways to play U.S. small-caps since 1989.
We believe that the current environment for U.S. small-caps is one of the best that we have witnessed in recent memory. Couple this with the fact that U.S. small-caps are trading at a 30-year low on absolute and relative valuation leads us to believe that a lot of the bad news has already been priced into current valuations.
Pairing this undervalued asset class with a quality tilt is a perfect concoction for an asset allocation.
Disclosures
Past performance is not indicative of future results. This material is not financial advice or an offer to sell any product. The information contained herein should not be considered a recommendation to purchase or sell any particular security. Forward looking statements cannot be guaranteed.
This commentary offers generalized research, not personalized investment advice. It is for informational purposes only and does not constitute a complete description of our investment services or performance. Nothing in this commentary should be interpreted to state or imply that past results are an indication of future investment returns. All investments involve risk and unless otherwise stated, are not guaranteed. Be sure to consult with an investment & tax professional before implementing any investment strategy. Investing involves risk. Principal loss is possible.
The S&P 500® Index is the Standard & Poor’s Composite Index and is widely regarded as a single gauge of large cap U.S. equities. It is market cap weighted and includes 500 leading companies, capturing approximately 80% coverage of available market capitalization.
The Russell 1000® Index measures the performance of the large cap segment of the U.S. equity universe. The Russell 1000 Index is a subset of the Russell 3000® Index, representing approximately 90% of the total market capitalization of that index. It includes approximately 1,000 of the largest securities based on a combination of their market capitalization and current index membership.
The Russell 2000® Index measures the performance of the small cap segment of the U.S. equity universe. The Russell 2000 Index is a subset of the Russell 3000® Index representing approximately 10% of the total market capitalization of that index. It includes approximately 2000 of the smallest securities based on a combination of their market cap and current index membership.
The Russell Midcap Index is a market capitalization-weighted index comprised of 800 publicly traded U.S. companies with market caps of between $2 and $10 billion. The average Russell Midcap Index member has a market cap of $8 billion to $10 billion, with a median value of $4 billion to $5 billion.
The 10 Year Treasury Rate is the yield received for investing in a US government issued treasury security that has a maturity of 10 year. The 10 year treasury yield is included on the longer end of the yield curve. Many analysts will use the 10 year yield as the “risk free” rate when valuing the markets or an individual security.
Advisory services are offered through Aptus Capital Advisors, LLC, a Registered Investment Adviser registered with the Securities and Exchange Commission. Registration does not imply a certain level or skill or training. More information about the advisor, its investment strategies and objectives, is included in the firm’s Form ADV Part 2, which can be obtained, at no charge, by calling (251) 517-7198. Aptus Capital Advisors, LLC is headquartered in Fairhope, Alabama. ACA-2207-34.
