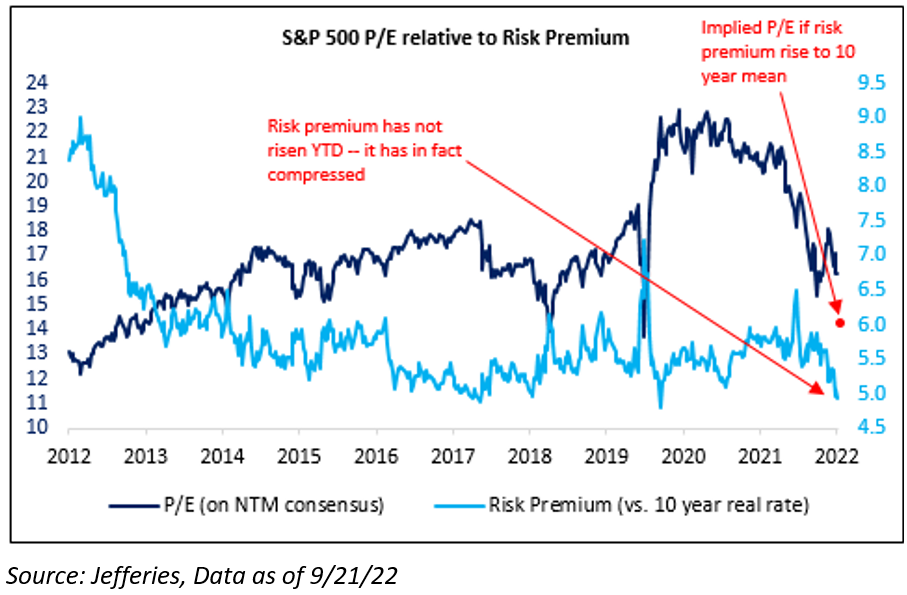
Many of y’all have heard my D + G spiel regarding the S&P 500’s P/E compressing from 21.5x (Dec ’21) to 16x currently, all while the risk premium has actually tightened. In other words, the cheapening of the P/E simply reflects the reality of higher real interest rates (10 year real from -1.1% in Dec ’21 to +1.2% currently) – not a higher risk premium. This places a lot of onus on earnings to continue to insulate the market.
Any way you slice this market through financial jargon, i.e., risk premium / equity risk premium / etc., it has been a macro, not fundamental-driven, market. Let’s walk through the gyrations of the market year-to-date. And, let me tell you, there have been a lot of gyrations.
- The market has seen five (5) different rallies of 5% or greater in ‘22
- Even more so, the market has seen two (2) rallies > 10%
And this data is solely focused on the equity markets, i.e., the S&P 500. When you look at it from an asset allocation perspective, AOR (60/40 portfolio) just hit its 52-week low! Volatility is everywhere.
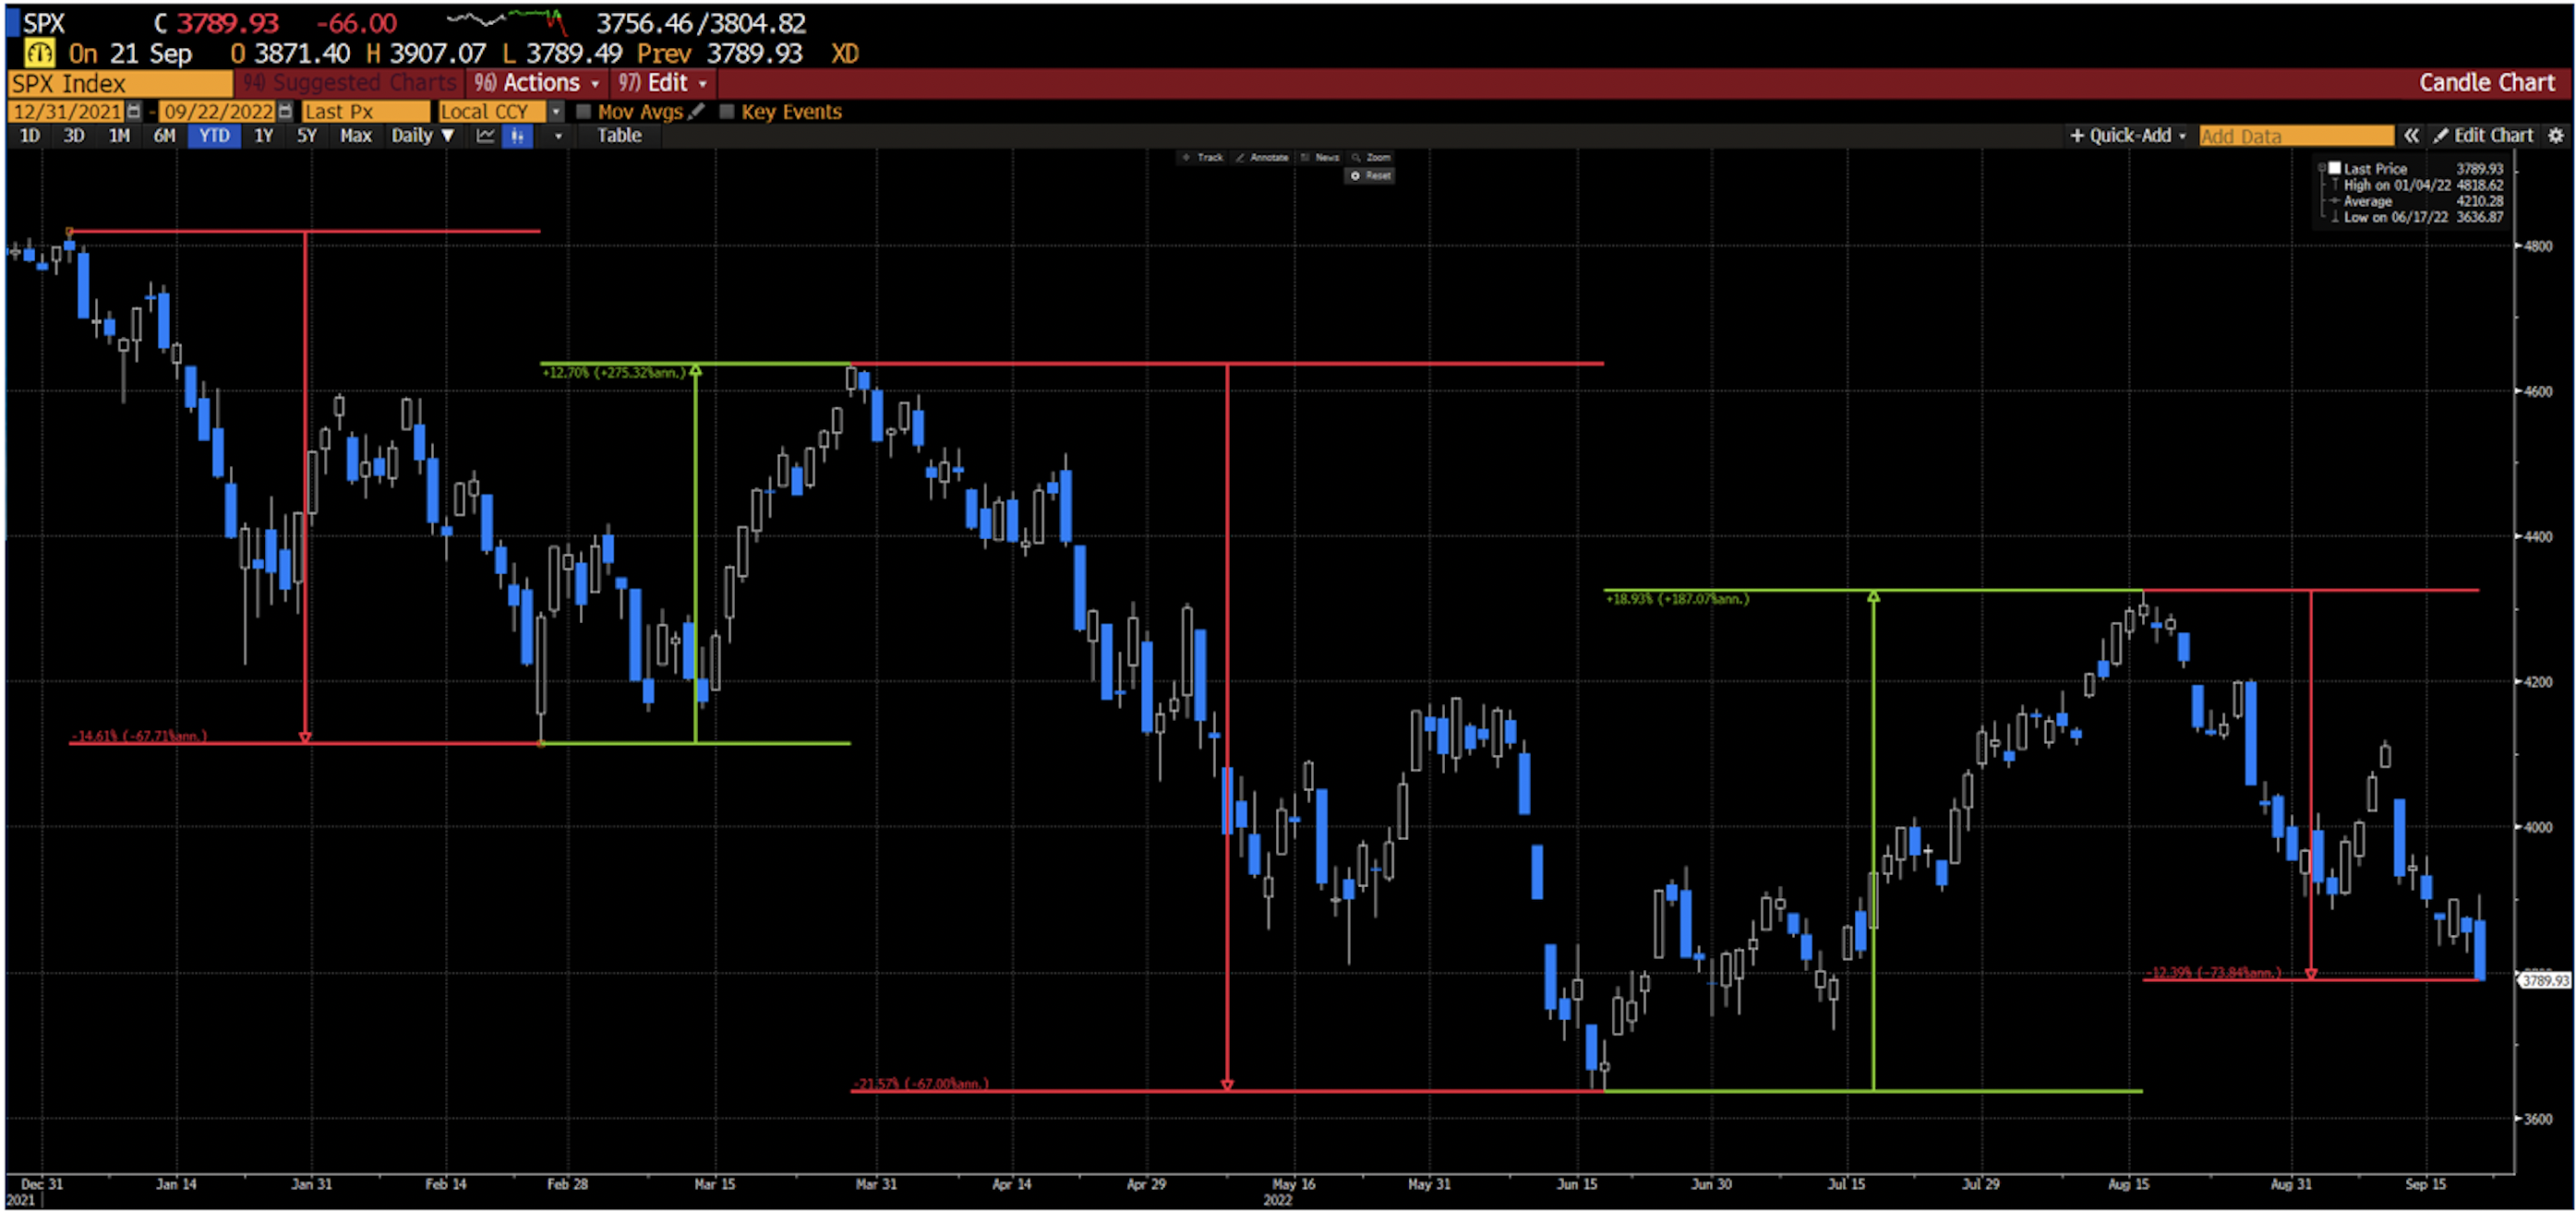
We’ve been on the side that these are bear market rallies and not the initiation of a new market – we’ll see if that continues. Nevertheless, the market has seen multiple gyrations of performance:
- 12/31/2021 to 3/14/2022: -14.61%
- 3/15/2022 to 3/29/2022: +12.70%
- 3/30/2022 to 6/17/2022: -21.57%
- 6/18/2022 to 8/16/2022: +18.93%
- 8/17/2022 to Today: -12.39%
 Source: Bloomberg. Data as of 9.26.22
The market has seen a lot of volatility over the last nine months, basically without any exuberance from the equity’s volatility index – the VIX. September is a prime example – the market has gone basically nowhere since 8/31/2022, yet we have seen two whiplashing price movements of 5% or greater during the month. Now, dissect this into intra-day volatility over the last year:
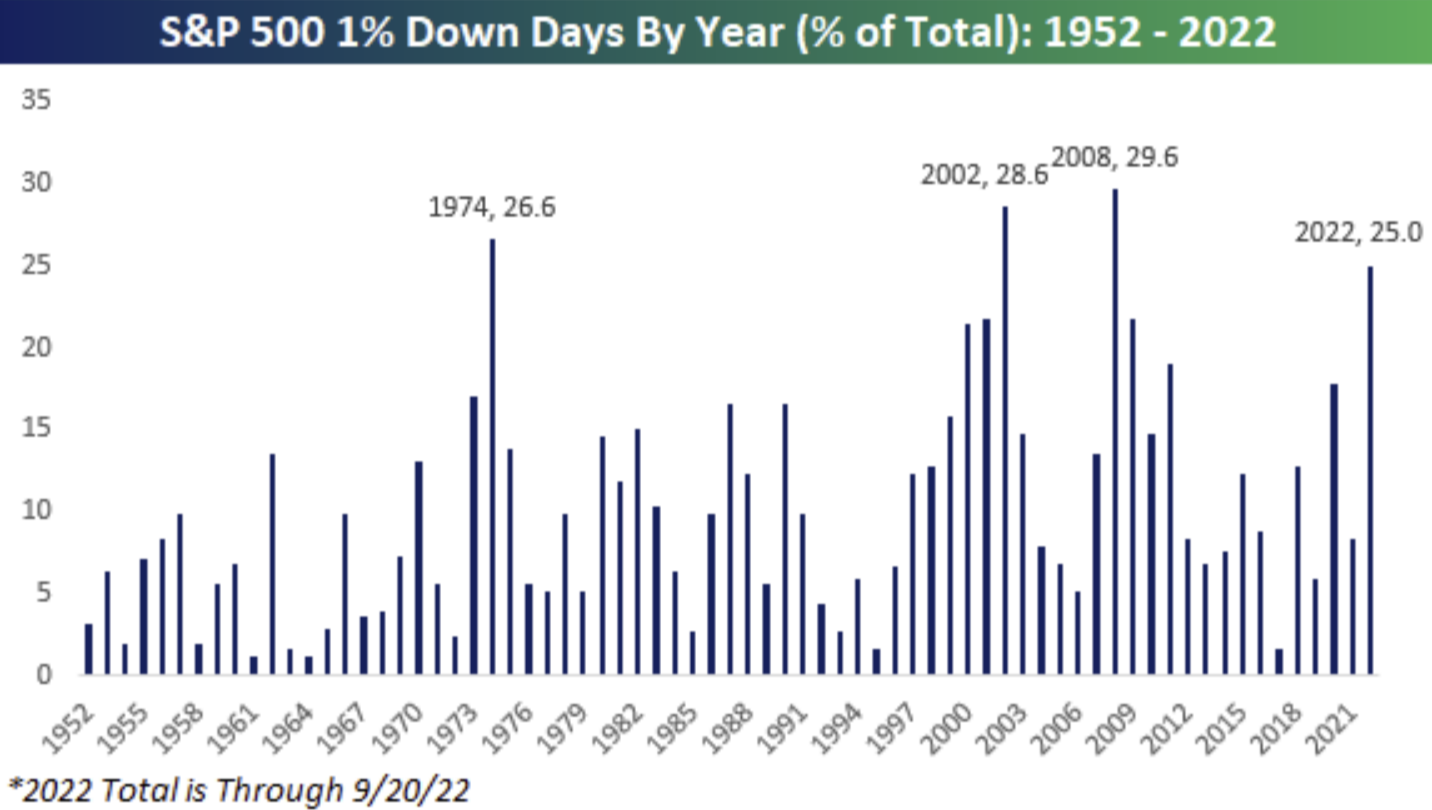
Year-to-date, we have almost seen an annual record of daily moves (%) greater than any other year since the early 1950s – 25% of the trading days thus far have had an intra-day swing of > 1%.
Bottom line, the market is having a lot of difficulty digesting the daily news flow of interest rate and inflation expectations.
My biggest takeaway from the bear market rallies in ‘22 is that lower interest rates can hide a multitude of sins – QT / Inflation / Taxes / etc. – much like what we’ve seen, really, since the beginning of QE back in 2008. Basically, the market can put up with a lot of crap, as long as LT interest rates remain lower. The question moving forward as the Fed continues to increase their expectations of the terminal rate, which increased to 4.4% in
’22 and 4.6% in ’23 as of their last meeting, coupled with a ramp up in QT, is: What happens to the market if it doesn’t go to Reconciliation to resolve all of these “sins”? Basically, what if rates are higher for longer?
What has this Market Taught Us About AA Positioning? Look at the gyrations that we have seen YTD in the market. Our brains have been trained to think in “V-Shape” and “Lambda-Shaped” market movements. As we transition out of a Quantitative Easing regime and into a Quantitative Tightening environment, we believe that these types of market movements will occur much less than what we’ve been accustomed to over the past decade.
This just shows the importance of a dynamic hedging exposure within portfolios instead of a static approach. For a static approach to work, one must correctly sell that position or wait until maturity to capitalize on its benefits, and until then, as long as the hedge is “winning”, the position can become so large that your holding has essentially become a bear allocation. When you manage with a dynamic approach that follows a structured process, you tilt the odds in your favor to be able to capitalize on market capitulations – much like the ones we’ve witnessed this year.
An active hedging strategy in volatile time periods allows one to opportunistically reset the goal posts to capture more upside without sacrificing any downside protection. As the market changes, one’s hedging exposure should too, otherwise you open your allocation up to significant risk.
Ultimately, we do not know how the market will digest the most recent Fed meeting, but given the increase in terminal rate, I’m not sure if we will retest or make new lows. What I’m more certain of is that it will be very difficult to make new highs in the interim.
Disclosures
Past performance is not indicative of future results. This material is not financial advice or an offer to sell any product. The information contained herein should not be considered a recommendation to purchase or sell any particular security. Forward looking statements cannot be guaranteed.
This commentary offers generalized research, not personalized investment advice. It is for informational purposes only and does not constitute a complete description of our investment services or performance. Nothing in this commentary should be interpreted to state or imply that past results are an indication of future investment returns. All investments involve risk and unless otherwise stated, are not guaranteed. Be sure to consult with an investment & tax professional before implementing any investment strategy. Investing involves risk. Principal loss is possible.
The S&P 500® Index is the Standard & Poor’s Composite Index and is widely regarded as a single gauge of large cap U.S. equities. It is market cap weighted and includes 500 leading companies, capturing approximately 80% coverage of available market capitalization.
Created by the Chicago Board Options Exchange (CBOE), the Volatility Index, or VIX, is a real-time market index that represents the market’s expectation of 30-day forward-looking volatility. Derived from the price inputs of the S&P 500 index options, it provides a measure of market risk and investors’ sentiments.
Advisory services offered through Aptus Capital Advisors, LLC, a Registered Investment Adviser registered with the Securities and Exchange Commission. Registration does not imply a certain level or skill or training. More information about the advisor, its investment strategies and objectives, is included in the firm’s Form ADV Part 2, which can be obtained, at no charge, by calling (251) 517-7198. Aptus Capital Advisors, LLC is headquartered in Fairhope, Alabama. ACA-2209-21.
