I understand that a lot of y’all have upcoming client meetings, so I wanted to take more of a high-level approach to this Musing, instead of focusing on a single subject. Please find our quarterly presentation here. This presentation is meant to be a universe of slides for our partners to use with clients. We’ve had a lot of good feedback on this presentation.
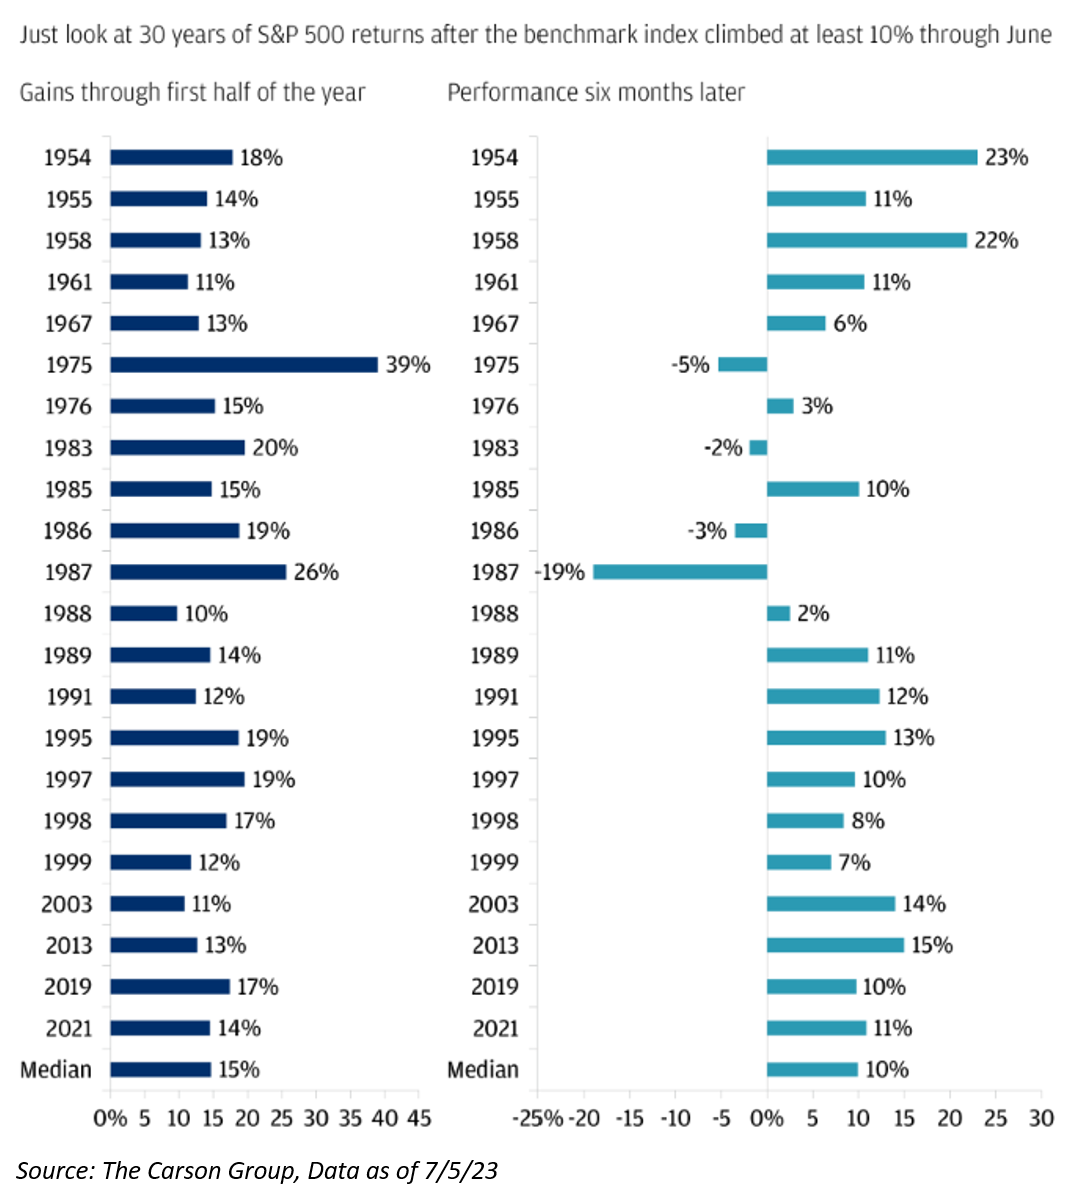
Let’s try to answer the following question: Coming off the worst year for the 60/40 portfolio since 1937, coupled with the fact that the perceived nature that a lot of the sins of the market have not yet been atoned for in ’23, many are asking why the S&P 500 is up almost 20% this year – a level that is only 7% from all-time highs.
I’m not going to dive into the “sins of the market” because the Wall of Worry is plastered all over TV screens.
Where is the Recession?
Many of y’all have heard John Luke and I say, “An inverted yield curve has preceded almost every recession, though it has difficulty on properly calling the timing.” Right now, many people are recognizing the difficulty in the latter part of that statement. But why has a recession not shown its face yet?
Honestly, one of the most surprising things to me this year has been the 180-degree change in investor sentiment. If you look at many of the popular sentiment indicators like the VIX (lowest level since pre-covid), the Put/Call Ratio, and AAII Bullish Sentiment readings, all suggest that investors are, at a minimum complacent, if not outright giddy. I don’t want to fully go out on a limb here and say that’s a contrarian indicator, but it is one that should be paid attention to.
Think of the investor sentiment heading into this year… it was completely bearish. For example, just last fall, 100% of economists surveyed by Bloomberg forecasted that the U.S. would be in a recession within 12 months. Now, nine months later, we are still not in a recession and only 58% of economists surveyed think that a recession will occur in the near future. We can still spin that comment in a different way – a majority of the economists continue to believe that a recession is around the corner.
Why? Let’s Walk Through the List
Labor Markets Remains Resilient: Profit margins have declined for the S&P 500, but not enough to prompt companies to lay off workers. According to the JOLTs data, 9.8 million job openings remain in the United States. This is why the market has seen a 5.6% wage growth rate YoY (ATL Fed Reading).
Consumer Spending Remains Resilient: Relative to 10YRs ago, the avg. “U.S. Household Net Wealth” is 120% higher. A lot of this boost is due to higher home prices, lower rates, and asset inflation.
Savers Now Have Income on Savings: Even though real rates are only slightly above 0.0%, consumers think and spend in nominal terms. Per Strategas, using money market fund data, they estimate that monthly income from savings is running at more than $20 billion per month. This has led to more consumer spending, making earnings more resilient thus driving stocks higher.
Reduction in TGA Accounts: At the same time the Fed’s balance sheet was expanding from the Banking issues, the Treasury Department drew down its General Account from $580 billion in January to roughly $20 billion by June 1st. The Treasury spent down accounts due to the gov’t shutdown. This liquidity was injected directly into the financial system.
2023 & 2024 Expectations Earnings Remain Resilient: Everyone has heard me talk on this subject, and you’ll hear it again in my next Musing that will provide a recap on Q2 ’23 earnings season. Estimates for S&P 500 earnings per share (“EPS”) next year rest at $245, or a 12% increase over today’s current expectations for 2023. The median decline in earnings during a recession is 22%.
The Fed put the Kibosh to the Banking Crisis?: The Fed quickly stepped in during the March Banking problems – will they always be there as a backstop?
Yet, there remain numerous outstanding questions:
How resilient will the US consumer remain, i.e., how much excess cash do they still have from the pandemic?
What happens if inflation turns back up as we pass easy YoY comps? Could the current Energy problem exasperate these figures?
How sustainable is an expansion in the business cycle when the economy is already near full employment?
Can investors continue to rely on multiple expansion to fuel equity gains?
Will the Fed always be there to backstop the market, much like it did in March, even with inflation still running high?
There’s been a package of worrisome data more broadly. Will that have an effect on the domestic economy?
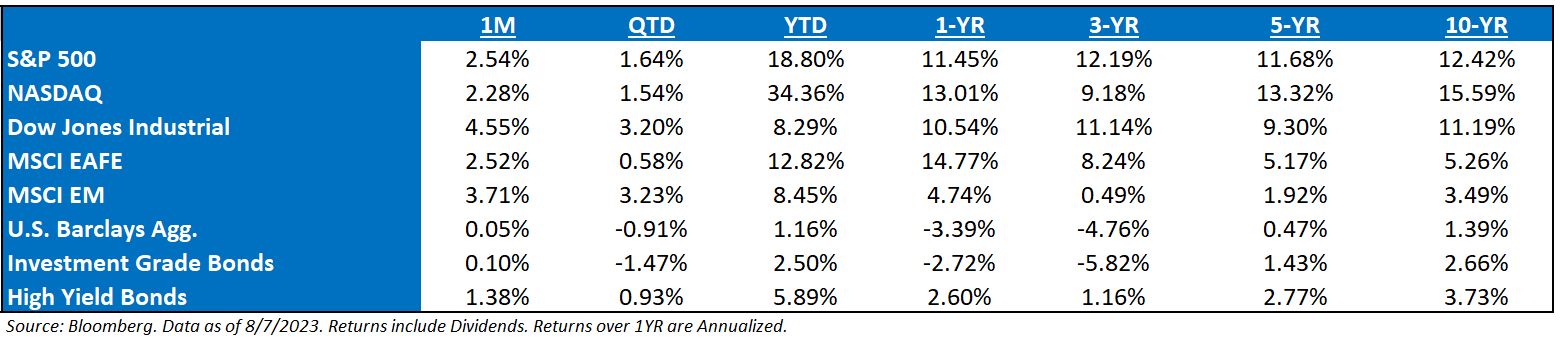
Here’s an updated table of Returns, as of Monday, August 7th:
We don’t have a metaphorical crystal ball as to how this year will end up (even though we did have a close partner send our HQ a literal crystal ball). If you’ve heard us speak about the structure of allocations lately, specifically to our own, you’d know that we are highly convicted in how we are positioned.
We really could care less if the market goes up or down from here, given that we can own more stocks and volatility as an asset class. We are prepared for either.
Disclosures
Past performance is not indicative of future results. This material is not financial advice or an offer to sell any product. The information contained herein should not be considered a recommendation to purchase or sell any particular security. Forward looking statements cannot be guaranteed.
This commentary offers generalized research, not personalized investment advice. It is for informational purposes only and does not constitute a complete description of our investment services or performance. Nothing in this commentary should be interpreted to state or imply that past results are an indication of future investment returns. All investments involve risk and unless otherwise stated, are not guaranteed. Be sure to consult with an investment & tax professional before implementing any investment strategy. Investing involves risk. Principal loss is possible.
VIX of VIX (or VVIX) is a measure of the volatility of the Chicago Board Options Exchange (CBOE) Volatility Index (VIX). The CBOE’s VIX measures the short-term volatility of the S&P 500 indexes, and the VVIX measures the volatility of the price of the VIX. In other words, VVIX is a measure of the volatility of the S&P 500 index and alludes to how quickly market sentiment changes.
The S&P 500® is widely regarded as the best single gauge of large-cap U.S. equities. There is over USD 11.2 trillion indexed or benchmarked to the index, with indexed assets comprising approximately USD 4.6 trillion of this total. The index includes 500 leading companies and covers approximately 80% of available market capitalization.
The Nasdaq Composite Index measures all Nasdaq domestic and international based common type stocks listed on The Nasdaq Stock Market. To be eligible for inclusion in the Index, the security’s U.S. listing must be exclusively on The Nasdaq Stock Market (unless the security was dually listed on another U.S. market prior to January 1, 2004 and has continuously maintained such listing). The security types eligible for the Index include common stocks, ordinary shares, ADRs, shares of beneficial interest or limited partnership interests and tracking stocks. Security types not included in the Index are closed-end funds, convertible debentures, exchange traded funds, preferred stocks, rights, warrants, units and other derivative securities.
The Dow Jones Industrial Average® (The Dow®), is a price-weighted measure of 30 U.S. blue-chip companies. The index covers all industries except transportation and utilities.
The S&P SmallCap 600 Value Index is a market capitalization weighted index. All the stocks in the underlying parent index are allocated into value or growth. Stocks that do not have pure value or pure growth characteristics have their market caps distributed between the value & growth indices.
The MSCI EAFE Index is an equity index which captures large and mid-cap representation across 21 Developed Markets countries*around the world, excluding the US and Canada. With 902 constituents, the index covers approximately 85% of the free float-adjusted market capitalization in each country.
The MSCI Emerging Markets Index captures large and mid-cap representation across 26 Emerging Markets (EM) countries*. With 1,387 constituents, the index covers approximately 85% of the free float-adjusted market capitalization in each country.
The Bloomberg Barclays U.S. Aggregate Bond Index is a broad-based benchmark that measures the investment grade, U.S. dollar-denominated, fixed-rate taxable bond market. This includes Treasuries, government-related and corporate securities, mortgage-backed securities, asset-backed securities, and collateralized mortgage-backed securities
Investment-grade Bond (or High-grade Bond) are believed to have a lower risk of default and receive higher ratings by the credit rating agencies. These bonds tend to be issued at lower yields than less creditworthy bonds.
Non-investment-grade debt securities (high-yield/junk bonds) may be subject to greater market fluctuations, risk of default or loss of income and principal than higher-rated securities.
Advisory services are offered through Aptus Capital Advisors, LLC, a Registered Investment Adviser registered with the Securities and Exchange Commission. Registration does not imply a certain level or skill or training. More information about the advisor, its investment strategies and objectives, is included in the firm’s Form ADV Part 2, which can be obtained, at no charge, by calling (251) 517-7198. Aptus Capital Advisors, LLC is headquartered in Fairhope, Alabama. ACA-2308-11.
