Decisions are easier to make if conviction of outcome is high, and/or the tradeoff profile is attractive enough. Even if (you think) you know the outcome of an event, if the tradeoff profile is poor then what? Let’s use a real-time example:
Given that it’s the NCAA Championship game tonight, let’s say you are certain UConn is going to win. As I’m typing, you’d have to bet $365 to win $100…they are obviously a heavy favorite over San Diego State. Is risking $365 to make just 27% of the capital at risk a good trade if you are convinced of the outcome? I’m not sure and I have no dog in that fight, but my point is that the consequences of being right or wrong drive a decision more so than anything else.
You change the numbers above and it changes everything. A negatively asymmetric outcome where your potential loss is much greater than your potential gain will make even the biggest believer reconsider.
In our seat, we are heavily involved in decisions from a high level of portfolios (asset allocation) down to the lowest of levels in the portfolio (stock selection and derivative management). The consequences of our actions and how they impact your portfolios, your relationships, and your business are the top consideration. There’s an analytical angle, but the relationship/behavioral angle of what you do matters just as much.
We try and provide support via communication and day-to-day availability, to help articulate the what and why of portfolios. Today’s note focuses on why our portfolios are positioned like they are (year of the yield) and the tradeoffs associated.
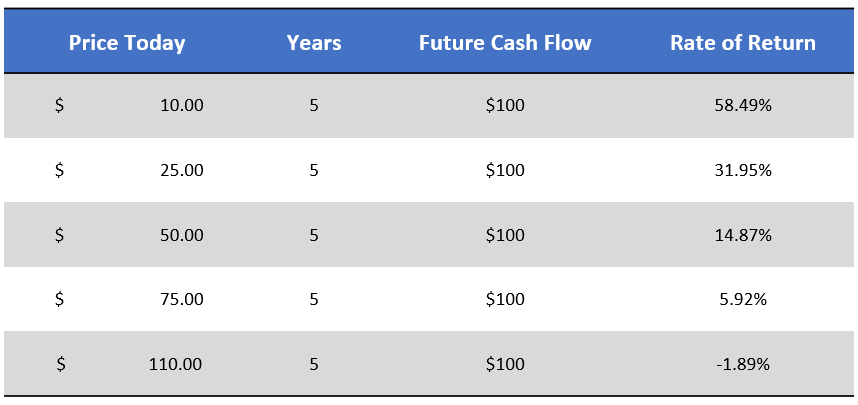
Remember, stocks are just claims on future cash flows. What you pay for those future cash flows will impact your return as a shareholder. If you pay a higher price for the same set of future cash flows, your returns as a holder of that stock will be lower. The opposite is also true, if you pay a lower price your returns will be higher. Keep this simple math at the top of mind as we continue.

Conceptual Illustration
Information presented is for illustrative purposes only and should not be interpreted as actual performance of any investor’s account. These figures are entirely assumed to illustrate the concept of discounting future cash flows. As these are not actual results and completely assumed, they should not be relied upon for investment decisions. Actual results of individual investors will differ due to many factors, including individual investments and fees, client restrictions, and the timing of investments and cash flows.
Quick Recap of Q1
In March, we saw the second and third largest bank failures in US history. We saw the first ever global systemically important bank (G-SIB) absorbed by UBS. The Fed’s balance sheet expanded by $300bil (but it’s not QE…right?). Speaking of the Fed, they hiked 25bps on the heels of the banking issues.
With all of that, we saw the S&P close out the quarter up 7.5% with valuations stretching back out to 18.45x the fiscal year of 2023 EPS, according to Strategas.
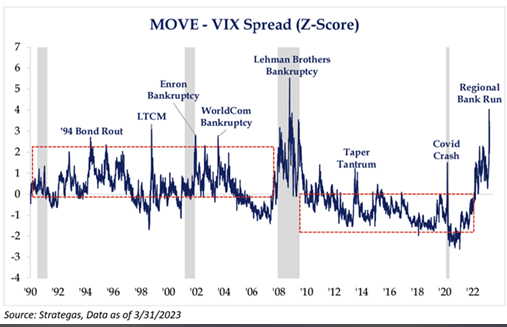
What catches our attention as much as anything else is the equity market’s reaction to the events of March relative to the bond/rate markets. The equity markets reacted with a yawn while the bond and interest rate markets acted as if we were in the middle of the global financial crisis.

The chart above shows the MOVE index, which measures implied bond volatility in the treasury space, vs the VIX. If you want more color into the volatility we saw in the rate markets, please reach out. It was off the charts.
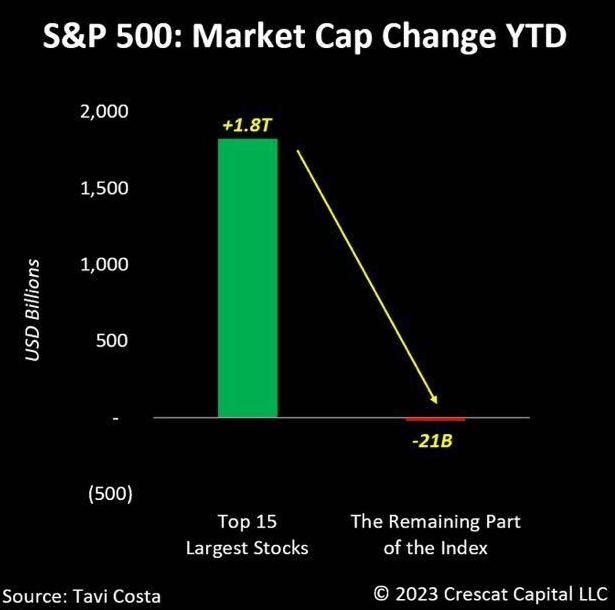
In addition, look at the dominance of the top 15 stocks on the quarter:

Is the volatility in rates, the drop in short end rates, and the flight to megacaps all telling us the same thing?
Valuations, Tradeoffs, and Our Portfolios
The market seems to be priced for a soft landing and no recession.
We’ve recently asked audiences for their estimate for 2023 earnings per share, and a multiple on those earnings. (Saying a company earns $2 to the bottom line and trades at a 10x multiple means it has a stock price of $20 (2 x 10). You can do the same thing with the overall S&P 500.)
The answers have been ~ $215 for earnings and ~ 18x on the multiple. That simple math of multiplying earnings by the multiple paid on those earnings (18 x 215) would put the S&P 500 Index at 3,870 – roughly 6% BELOW today’s price of 4,115 as I type.
The simple example above assumed earnings remain close to current estimates and multiples remain elevated relative to history. Both ‘cup half-full’ estimates.
Our point is this, the tradeoff in the equity markets doesn’t seem overly attractive at the moment. The sources of return to your portfolio are:
How Are Returns Generated?
Returns are generated in one of three ways:
Yield : Dividends + Interest
Growth : Annualized Improvement
Valuation : Changing Investor Appetite
We continue to think the third bullet point could be low or negative, and are leaning into the yield plus growth (Y + G) framework.
On an absolute basis, Q1 numbers were good. On a relative basis, our portfolios lagged…and given the backdrop, we are ok with that. Our focus is on sufficient returns, and a return stream that can be stomached. Specifically, we want to avoid the large losses that levy a volatility tax against our compounding return stream.
To chase equity markets here would be, in our opinion, positioning in front of negatively asymmetric tradeoffs. The good news is, we can now hunker down (like we are) to higher yields and beefed-up hedges in a way that opportunity cost gives us less heart burn.
Year of the Yield
Let’s stay on opportunity cost, and how dramatically the environment has changed in a way that’s impacted certain tradeoffs.
18 months ago, if you wanted to hold cash rather than the market, your opportunity cost was large. You were paid next to nothing to sit in cash, and every bit the market rallied hurt. The hurdle rate was 0%…any move higher creates more and more ‘cost’ to holding cash.
Fast forward to today – we’ve created different strategies for our portfolios that allow us to better express our views within portfolios. They all use volatility – some to mitigate risk, others to enhance yield, but both of which we think will be needed moving forward. Between those strategies and the overall rate environment (4% money markets), we can now increase the hurdle rate meaningfully.
For example, we have a single exposure in our portfolios that is currently providing 10% (if not more) of annualized yield. The bulk of the positioning is in limited-duration Treasuries with remainder utilizing an overlay we developed to enhance yield. We’re using this strategy as a way to ‘hunker down’, but rather than 0%, we get a juicy yield while we are hunkered. The opportunity cost hurdle rate is now roughly 10%!
Valuations
Going back to the valuation discussion, when you now considered a hurdle rate that’s been reset much higher than 0%, our appetite towards protection of capital can be better understood. Is the market going to rise above 10% in the next few months? Maybe…but we don’t believe valuations support that, even in the softest of landings.
What we just said is a version of the same thing we said last month:
“Another form of optionality embedded in portfolios today is our focus on yield. Given the move in rates and our ability to use volatility to enhance yields, we continue to think yield is a critical source of return for 2023.
The reason I say it’s a form of optionality is because we are hunkering down into a return driver that carries lower volatility and stable payoffs while waiting for opportunities to present themselves. Meaning, yield rather than growth or valuation expansion.”
Your Client’s Objectives Are Our Objectives
Rates of return that keep a financial plan on track are not astronomical. Given the market backdrop, this is great news. For most plans, if we can compound capital in the 6% to 12% range, all is well.
That’s our objective…to position portfolios for returns that keep plans on track. We want to empower advisors to deliver consistently around the following three questions:
- Am I going to be OK?
- Can I maintain my family’s quality of life?
- Can I improve it?
We are making portfolio shifts and building on strategies, to position based on the windshield and not the rearview. Using volatility to create optionality is how we are approaching portfolio construction, with helping clients comfortably achieve goals our one and only goal.
As always, thank you for your trust and please don’t hesitate to reach out.
Disclosures
Past performance is not indicative of future results. This material is not financial advice or an offer to sell any product. The information contained herein should not be considered a recommendation to purchase or sell any particular security. Forward looking statements cannot be guaranteed.
This commentary offers generalized research, not personalized investment advice. It is for informational purposes only and does not constitute a complete description of our investment services or performance. Nothing in this commentary should be interpreted to state or imply that past results are an indication of future investment returns. All investments involve risk and unless otherwise stated, are not guaranteed. Be sure to consult with an investment & tax professional before implementing any investment strategy. Investing involves risk. Principal loss is possible.
The content and/or when a page is marked “Advisor Use Only” or “For Institutional Use”, the content is only intended for financial advisors, consultants, or existing and prospective institutional investors of Aptus. These materials have not been written or approved for a retail audience or use in mind and should not be distributed to retail investors. Any distribution to retail investors by a registered investment adviser may violate the new Marketing Rule under the Investment Advisers Act. If you choose to utilize or cite material we recommend the citation, be presented in context, with similar footnotes in the material and appropriate sourcing to Aptus and/or any other author or source references. This is notwithstanding any considerations or customizations with regards to your operations, based on your own compliance process, and compliance review with the marketing rule effective November 4, 2022.
Advisory services are offered through Aptus Capital Advisors, LLC, a Registered Investment Adviser registered with the Securities and Exchange Commission. Registration does not imply a certain level or skill or training. More information about the advisor, its investment strategies and objectives, is included in the firm’s Form ADV Part 2, which can be obtained, at no charge, by calling (251) 517-7198. Aptus Capital Advisors, LLC is headquartered in Fairhope, Alabama. ACA-2304-7.


