Is the risk off move just a pause in the market after an incredible two quarters to start 2021, or something sinister brewing under the surface? The equity market’s reaction Monday (7/19) showcased fear of the Delta variant derailing the economic recovery as new cases surge worldwide. This can also be seen in outflows across the value factor (generally seen as the reopening names) over the last few months where assets have shifted into Treasuries causing long-term interest rates to confusingly drop below 1.20% – flattening the yield curve. We do we believe the move in yields is more supply/demand related than anything (more on that below).

Source: Bloomberg (as of 7/19/21)
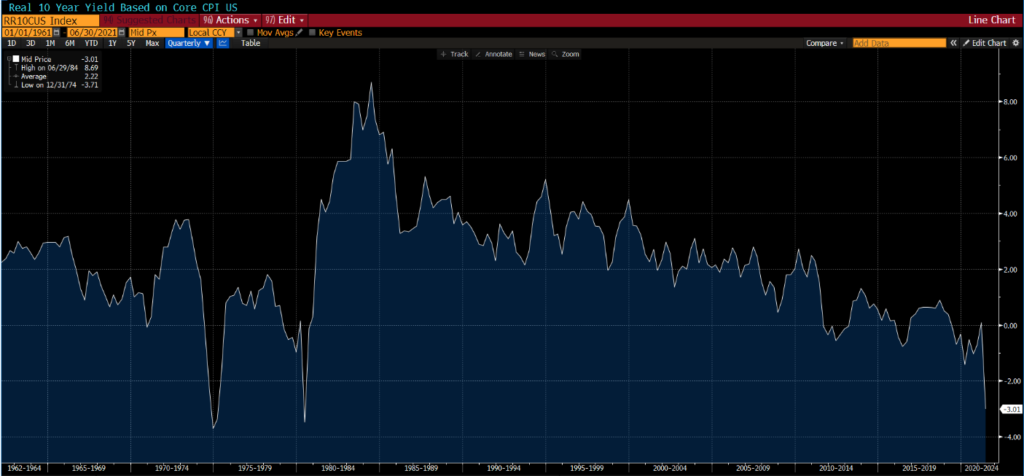
Negative Real Returns
Bond holders are seeing real returns hit negative levels only seen for a few months in 1973/74 and 1979. The big question remains – how long will investors continue to accept negative real yields, as inflation measures come in hotter than expected (deemed as transitory by the Fed)?

Source: Bloomberg 7/21/21
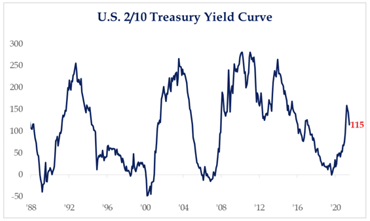
Flattening Yield Curve
The 10-year Treasury minus the 2-year Treasury curve, an indicator of a strong, growing economy has flattened substantially, creating questions of how long lasting the recovery will last. We see a 2/10 spread below 100bps as a problematic situation for the Fed. For reference, in 2021, it peaked at 157bps in March.
 Source: Strategas (as of 7/19/21)
Declining Treasury Yields
We think there are a few reasons for the strange dynamic of plunging Treasury yields even with three consecutive higher than expected inflation prints:
- First and foremost is the potential for near-term negative impacts of the Delta Variant creating more restrictions and hampering the reopen/recovery leading to the safety trade, i.e., lower growth.
- Potential for a Fed policy mistake, enhanced by Powell’s term ending in early 2022. Will he stay or will he go?
- To dig a bit further, we believe the market fears a reactionary move by the Fed to keep monetary policy roughly as it is rather than risk premature tightening that would slow growth. Or, even worse, trigger a recession, given a central bank that has a history of withdrawing accommodation prematurely.
- Supply/Demand factors within the Treasury market enhanced by Fed purchase activity.
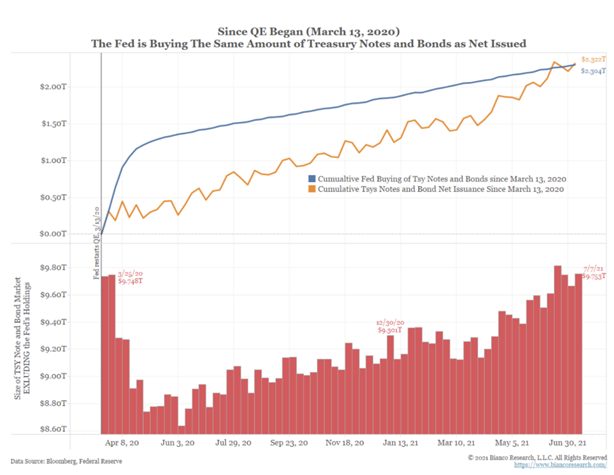
The chart below starts on March 13, 2020, the day the Fed started QE. The orange line shows the cumulative net issuance (total issued less total matured) of Treasury notes and bonds since this date, totaling $2.32 trillion. The blue line shows the Fed’s cumulative net purchases of Treasury notes and bonds, totaling $2.30 trillion.

Source: Bianco Research (As of 7/20/21)
The red bars in the bottom panel show the amount of Treasury notes and bonds available for investors. The Fed has bought as many bonds as the Treasury has issued since last March, so there has been no increase in publicly available Treasury supply thanks to the Fed’s heavy involvement in the market. Given supply imbalances, we think normal buying has had a larger impact on rates (dropping) than in a typical environment.
Delta Variant
Should we fear another shutdown? We don’t think so as it’s unlikely policy makers reimplement the type of growth crushing lockdowns that defined 2020 given less risk to the healthcare system because of vaccine rollouts. Bottom line: Cases will go up, but we don’t expect any national mask mandate or other measures nationally, but more local rules are likely in Democratic-controlled areas.
Tapering Asset Purchases
Another big point of interest has involved the potential for a tapering of asset purchases. With the Fed Jackson Hole meeting approaching, markets expect more commentary from Fed Chair, Jerome Powell, regarding the future direction of Central Bank’s asset purchases. Remember, the Fed is currently buying $80bn of Treasuries and $40bn of MBS EVERY month. With a red-hot housing market and increasing asset prices (as well as inflation prints), we think taper discussions will happen sooner rather than later. The GOOD news, we have a playbook on the taper back in 2013 that we think will work this time, too. History tells us to stay the course (more on this to follow shortly).
Rate Hike on the Horizon?
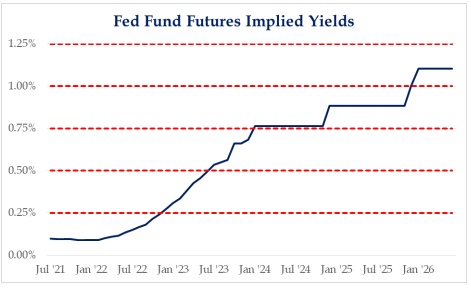
While the Market is expecting the first rate hike in Q4 of ’22, we say let’s get past the taper and see the market’s response, first. While several (non-voting) Fed governors moved forward their timeline for a hike to late ’22 during the last update, don’t forget that Chairman Powell leans toward ’23 for the first hike – and he calls the shots! We expect the continuation of the lower for longer mantra along with the continuation of very easy monetary policy until the economy approaches a more complete recovery.

Source: Strategas (As of July 15, 2021)
Disclosures
Past performance is not indicative of future results. This material is not financial advice or an offer to sell any product. The information contained herein should not be considered a recommendation to purchase or sell any particular security. Forward looking statements cannot be guaranteed.
This commentary offers generalized research, not personalized investment advice. It is for informational purposes only and does not constitute a complete description of our investment services or performance. Nothing in this commentary should be interpreted to state or imply that past results are an indication of future investment returns. All investments involve risk and unless otherwise stated, are not guaranteed. Be sure to consult with an investment & tax professional before implementing any investment strategy. Investing involves risk. Principal loss is possible.
Advisory services offered through Aptus Capital Advisors, LLC, a Registered Investment Adviser registered with the Securities and Exchange Commission. Registration does not imply a certain level or skill or training. More information about the advisor, its investment strategies and objectives, is included in the firm’s Form ADV Part 2, which can be obtained, at no charge, by calling (251) 517-7198. Aptus Capital Advisors, LLC is headquartered in Fairhope, Alabama. ACA-2107-15.

