“CAGR” – we say that a lot, and for good reason.
It stands for Compounded Annual Growth Rate. It’s how your wealth grows.
Higher CAGR = Higher terminal wealth.
Aptus’ focus is higher terminal wealth rather than the highest “risk-adjusted returns”.
Traditional finance, everything from the wealth managers to the regulatory framework that governs large banking institutions, is trapped in this world where a 5% CAGR can be better than a 10% CAGR if its risk-adjusted returns are better.
To that, we say… huh?
If you compound $1,000,000 for 20 years at those rates, here is what happens:
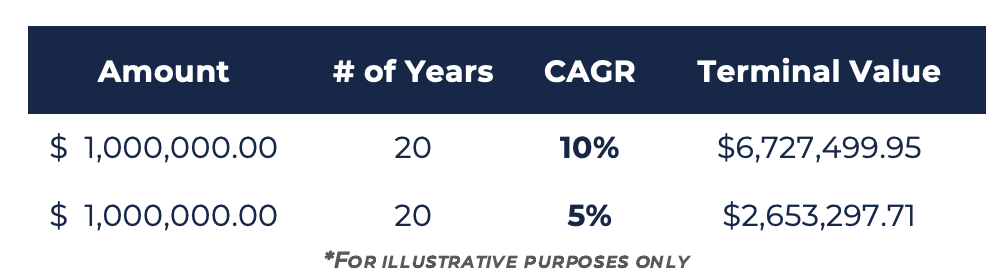
That’s a difference of $4,074,202.24 in terminal value.
If I asked any client in the world this question: You have an option to end up with $2.6 mil or $6.7 mil, which would you prefer?
My answer would be that none of them would settle for the $2.6 mil.
Argue all you want for higher ‘risk-adjusted’, but we think terminal value should be the goal.
Risk-Adjusted
Risk-adjusted usually refers to this thing called the Sharpe Ratio. Think of it as a ratio of return/risk with risk being defined as volatility.
Without getting long-winded on all of what’s wrong with that definition of risk, do you see the tradeoff here and how nonsensical this argument is in the real world?
If a better Sharpe Ratio is my measure of success, it means I’d rather have lower returns as long as volatility is lower, even if that volatility is to the upside. I know, I know, for financial planning, having more predictability in portfolio returns helps.
That’s baloney. We think the best solution to a successful financial plan is a higher terminal value.
Your wealth compounds. Each return builds on what came before. It’s multiplicative, not additive. This means that doing all you can within your constraints (asset allocation, tax efficiency, risk tolerance, etc) to create higher compounded returns is how you achieve higher terminal value.
Options-Based Strategies
We operate in a world so brainwashed by risk-adjusted frameworks that we have only slowly become more vocal in our public contempt for that thinking. When you are based in Fairhope, Alabama, it’s a business risk to be too different…you have to ease into it.
You’ve heard us talk about the importance of asset allocation. That decision drives most of the terminal value outcome. This is why we love option-based strategies, as they allow allocations to be improved. Our entire business is an expression of that idea. More stocks, less bonds, risk neutral.
As we often quote from David Dredge, we believe portfolios should be built with stronger engines. More of the things that can grow at higher compound rates than traditional frameworks would advise. Those bigger engines just need better brakes. In our world, those brakes are installed via options-based strategies.
Options-based strategies are growing, and we think the growth will continue. We are thrilled to see the innovation in the ETF space that’s allowing advisors to improve allocations. We see the demand increasing for years to come, and think buffered strategies will be a beneficiary of that growth.
That said, the area seems ripe for improvement. Get the costs right, improve the structure, and CAGRs go up. Simple beats complex makes sense to us.
We will continue to build solutions and strategies for the specific purpose of higher CAGRs.
Buffered strategies are a perfect example of assets that could be funded with money traditionally earmarked for fixed income. Before we share thoughts on improving buffered outcomes, let’s quickly review the basics of options and their role in these strategies.
Option 101 Reminder
Call Option – The right to buy a stock at a specific price.
If you own (long) a call option with a strike price of $100, that means you have the right to buy it at $100 no matter what the price is. You pay a premium for that right, and that right gets more valuable the higher the stock price goes.
-
- Owning a Call option (long) = Bullish
- Selling a Call option (short) = Bearish
Put Option – The right to sell a stock at a specific price.
If you own (long) a put option with a strike price of $100, that means you have the right to sell it at $100 no matter what the price is. You pay a premium for that right, and that right gets more valuable the lower the stock price goes.
-
- Owning a put option (long) = Bearish
- Selling a put option (short) = Bullish
Option Moneyness – Moneyness tells you whether an option is worth anything if it expired right now. It compares the current stock price to the options strike price. Here are examples:
At the Money: Stock Price = $100. Option strike price = $100. Strike price and underlying price are equal.
Out/In the Money: Stock price $100. Strike Price $85.
-
- For a Call Option: In the money by $15
- For a Put Option: Out of the money by $15
Collars and Buffered Strategies
Buffered strategies are a flavor of collars. A collar has 3 components:
1. The Underlying: What you own, let’s say the S&P 500 Index
2. Call Option: A call option sold above and Out-of-the-Money on the underlying
3. Put Option(s): A combo of a put option bought At-The-Money, and another sold below and out of the money.
Let’s take a 15% buffer strategy and look at how it’s constructed with the underlying exposure being the S&P 500. These strategies tend to have annual resets. Meaning, once a year the fund ‘resets’ the option’s strike.
The Known
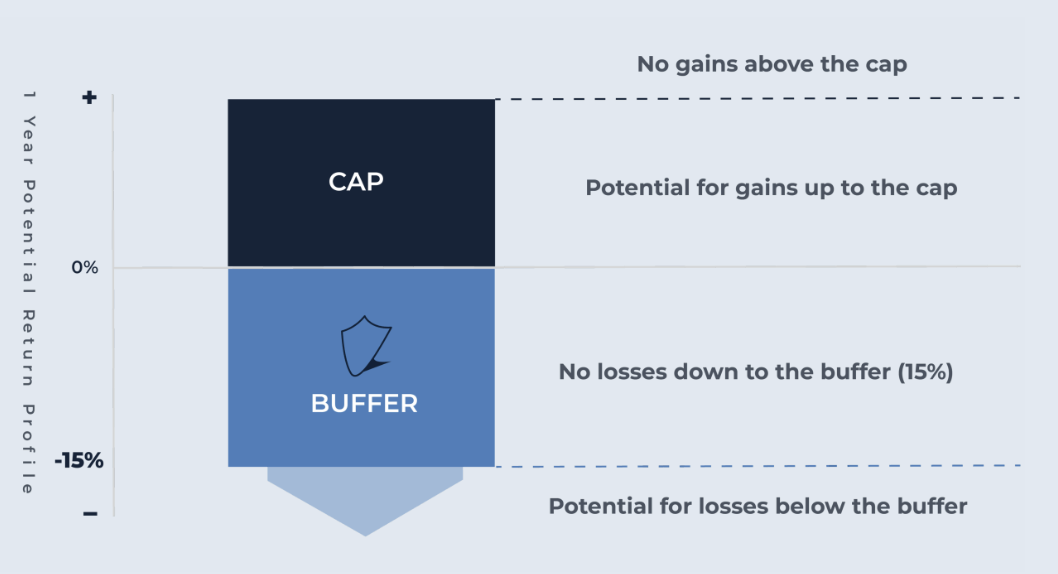
The known component is the buffer, say 15%. On each reset, the fund will go purchase a put spread. It will buy an At-the-Money put and simultaneously sell a put that’s 15% below the money. This creates the ‘buffer’ of protection from 0% to -15%.
For example, if the S&P was priced at $100, the 15% buffered strategy would be long a put option with a strike of $100, and short a put option with a strike of $85.
The holder of this fund is protected from $100 to $85, but loses that protection below $85.
The Solve
Once the cost of the put spread is determined, the typical next step is to sell a call option at a level that pays for the cost of the spread. This call option is a ceiling or cap, meaning it caps potential return, and it funds the cost of protection.
Where the cap is set is unknown until the price of the buffer protection is in place.
The big focus in the industry is to create a ‘costless’ collar where the proceeds from the short call match the cost of the put spread.
***Keep this idea of ‘costless’ top of mind. We will come back to this.***
To help summarize, here’s a visual of what that looks like:
 *For illustrative purposes only
Big Observations
Puts are expensive. Assume the underlying is $100. If you try to sell a call that’s 2% out of the money ($102) to fund a put that’s 2% out of the money ($98) it would not be costless. That put would require an out-of-pocket spend in addition to the proceeds collected from selling the call, or you’d have to adjust your strike to something lower.
This is Asymmetric in the wrong direction. If you take the proceeds from a short call that’s 2% out of the money and it buys you a put that’s 5% out of the money, that means your upside is capped at 2%, and your downside is -5%, not a great risk/reward.
The big tradeoff is market upside, if you want the downside buffer.
Despite the drawbacks, we think the case for buffers is compelling vs bonds. Don’t get us started on this, but we’d much prefer buffers to owning fixed income. Read any of our monthly writeups for more explanation.
These can be tools to alter allocations away from bonds and towards stocks. The known level of protection can create confidence in building a bigger engine for your portfolio to compound faster.
Quick Reminder: Higher compounded returns lead to higher terminal value. That’s the goal! I don’t want the main thing to get lost in option jargon.
Improving a Simple Buffer
Higher Caps! That’s how you improve buffered strategies. It’s all about higher caps, as that’s what leads to higher CAGRs.
Consider this…
Since 1950, when looking at rolling 12-month returns, the S&P 500 has returned 12% or greater roughly 55.5% of the time. Below is the frequency at which different “caps” are hit on the S&P 500 since 1950. As expected, the higher the cap, the lower the frequency you would expect to hit the cap.
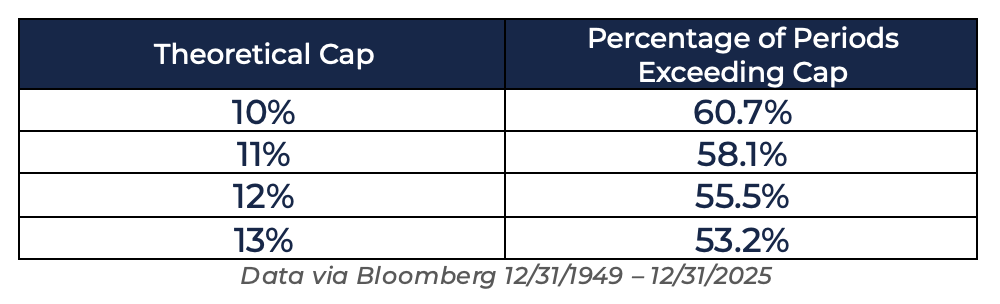
To be super clear, a buffer strategy’s cap is the level above which you forgo upside participation. If your cap is 10% for the reset period, there’s no way you can make more than that. Again, that’s the tradeoff; if you want a buffer below, you must give away upside participation above a certain level.
Stating the obvious, it seems like higher caps would improve CAGR. Let’s take a look.
The data shows that for every 1% lift in the cap, you get a bit more than 0.5% back in CAGR. This should logically make sense based on the data above – if my cap is hit just over half the time (and hit rate falling as you go higher), lifting the cap should increase that return by about one half of the higher cap benefit over time (and falling as you go higher).
The graphic below shows the expected CAGR based on each calendar year returns (1/1 – 12/31) historically, but the CAGRs and their improvement hold constant no matter what month you start with (i.e., this looks roughly the same for any rolling period, e.g., 4/1 – 3/31 returns, etc.).
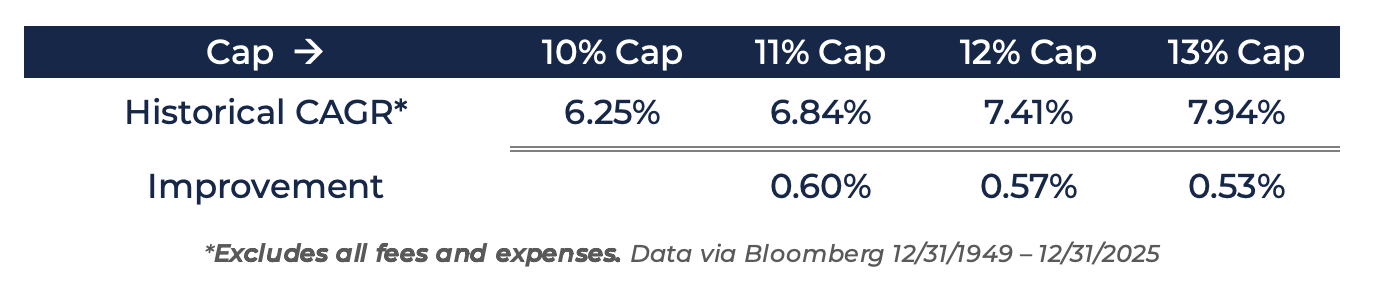
The higher the cap → the higher the CAGR → the higher the terminal value.
So, how can one manager create a higher cap than another?
Creating Higher Caps
The complexity of these types of strategies is often oversold. At their core, they are collars and you just need to understand the above discussion to grasp:
-
- The structure of these strategies
- The importance of Caps
As you consider these strategies for shareholders and their portfolios, we’d look to understand the buffer zone you are comfortable with and the cap associated.
If we were looking to improve a buffered strategy, we’d focus on two areas:
#1 Expense Ratio
All things equal, a lower expense ratio should create a higher net cap vs. a similar strategy with a higher expense ratio.
For example, if Strategy A is a 15% buffer and it costs 0.80% and Strategy B is a 15% buffer and it costs 0.30%, Strategy B will generate a higher cap simply due to lower costs.
#2 The Option Structure
This is where it gets fun…
Remember the note above on ‘costless’?
Most strategies are designed to be costless. Meaning the spend for the put spread, the buffer, is paid for by the selling of the call option (the cap).
What happens if you create a collar that’s not costless? Or better yet, why would you want a structure that’s not costless?
That answer is simple => to create a HIGHER CAP!
See, if you were willing to spend something on the buffer protection, it should raise the cap of the strategy by a number bigger than what you spent. Otherwise, you wouldn’t do it.
To put numbers to that: If you spent the fee savings on the options package, it could lift your strategy’s cap by 1-2%.
Remember what higher caps lead to…
Driving Better Outcomes
The best buffer strategy would:
-
- Cost less to own and
- Use the lower cost to fund the structure
Consider two 15% buffer strategies, their total costs (expense and structuring), and think about the impact:
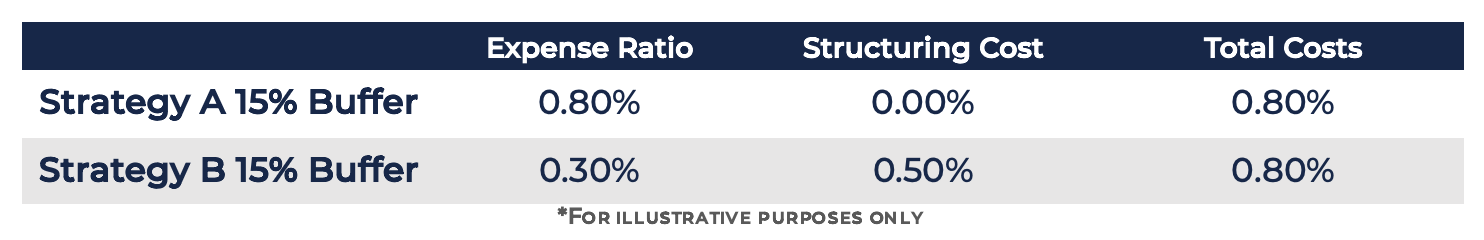
In this case, the difference in gross caps (the cap before costs) and net caps (the cap after costs) for a 15% buffer strategy may look something like this:

Strategy B has a Net Cap higher than the Gross Cap of Strategy A. I repeat, a higher net than the competitor’s gross. It would be hard to argue the value of Strategy A over Strategy B if the stakes are shareholder outcomes.
In rising markets, the cap rate matters; in falling markets, the total costs matter. Our money would be on Strategy B in any environment. Not because the manager is smarter, but because the math is the math.
If I’m looking to allocate, these are the things I want to understand about the universe of buffer strategies.
Conclusion
Asset allocation drives long-term outcomes. We continue to believe in our more stocks, less bonds, risk neutral mantra.
If you cannot use bonds to protect wealth in the face of the money printer, we think you’d better own more growth-focused assets. You can use options in seeking to protect the potential bad outcomes associated with that shift.
There’s innovation happening, driven by the awakening of common sense. Our hope is that we can create valuable options-based strategies for years to come.
As always, thank you for your trust. If you made it to the end of this note, thank you for sticking with us! Please reach out with any questions.
Disclosures
Past performance is not indicative of future results. This material is not financial advice or an offer to sell any product. The information contained herein should not be considered a recommendation to purchase or sell any particular security. Forward-looking statements cannot be guaranteed.
*Conceptual Illustration: Information presented in the above charts are for illustrative purposes only and should not be interpreted as actual performance of any investor’s account. As these are not actual results and completely assumed, they should not be relied upon for investment decisions. Actual results of individual investors will differ due to many factors, including individual investments and fees, client restrictions, and the timing of investments and cash flows.
This commentary offers generalized research, not personalized investment advice. It is for informational purposes only and does not constitute a complete description of our investment services or performance. Nothing in this commentary should be interpreted to state or imply that past results are an indication of future investment returns. All investments involve risk and unless otherwise stated, are not guaranteed. Be sure to consult with an investment & tax professional before implementing any investment strategy. Investing involves risk. Principal loss is possible. This should not be construed as tax advice. You should always consult with your tax professional with regard to specific tax questions and obligations. Outcomes can and will vary based on individual financial circumstances.
Advisory services are offered through Aptus Capital Advisors, LLC, a Registered Investment Adviser registered with the Securities and Exchange Commission. Registration does not imply a certain level of skill or training. More information about the advisor, its investment strategies and objectives, is included in the firm’s Form ADV Part 2, which can be obtained, at no charge, by calling (251) 517-7198. Aptus Capital Advisors, LLC is headquartered in Fairhope, Alabama. ACA-2601-12.