We continue to understand that emotions are heightened in this current market – the volatility is real. Thus, we know that a lot of y’all are focusing on how to help your clients Think Well and we love that.
But, being a wildcard, I’m going to take this musing in a different direction – focusing on how we continue to try to understand previous market dynamics to make sure that we are fishing in the right part of the pond, as the market shifts from an insanely loose Quantitative Easing regime to a restrictive Quantitative Tightening regime. As I’ve mentioned, we believe that the relatively rapid transition of Fed policy from quantitative easing to quantitative tightening may be one of the most significant developments for the financial markets since the 2008 global financial crisis.
How Much Should One Fear Quantitative Tightening?
The FOMC announced quantitative tightening (“QT”) will start on June 1. For the first month, the amounts involved will be $30 billion in Treasuries and a maximum of $17.5 billion in MBS. They will increase to some unspecified level in the month of July, and from August on they will become $60 billion per month in Treasuries and a maximum of $35 billion per month in MBS. Given this pace, QT will proceed at a pace of $95 billion per month from August, or over $1 trillion per year. By comparison, quantitative easing (“QE”) at its peak proceeded at $1.44T on an annualized basis.
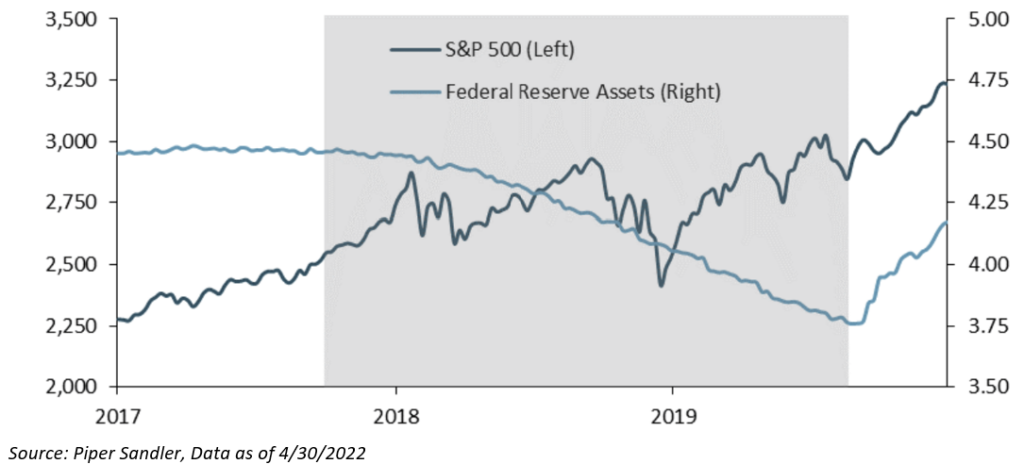
This aspect of QT is different than the Fed raising rates. This QT is inclusive of letting the maturities roll off the Fed’s balance sheet. Thus, if we look at this from a historical context, there is only one other period in which the Fed had to unwind QE through QT – October 2017 to August 2019. Therefore, historical significance is very weak.
That said, stock prices appreciated by about 15% over that time, just a few percentage points less than their performance over the same-length period immediately before QT started. Similarly, fixed income assets also did well – led by long duration and investment grade corporates. The caveat is that equities went through periods of pronounced volatility, but that was caused by shifting macroeconomic conditions and fears of too many rate hikes by the Fed, not by QT itself.
My takeaway is that there is not material evidence (so far) to suggest that QT will be a drag on asset prices – either risky or “risk-free” assets. But, as we all know, the wildcard in this environment is inflation. As I said last week, we believe that market volatility will continue to persist until the market believes that we have seen “peak inflation”, and the most recent CPI data definitely did not instill any confidence there. Thus, markets will continue to respond mostly to changing macro conditions, not QT.
What Performed Well During Previous QT Periods?
The equity market as a whole appreciated 15% over the previous QT period; that compares to 20% over the immediately preceding same-length period. Sector performance in 2017-19 was (and most likely will in the future) be determined more by macro conditions than QT itself.
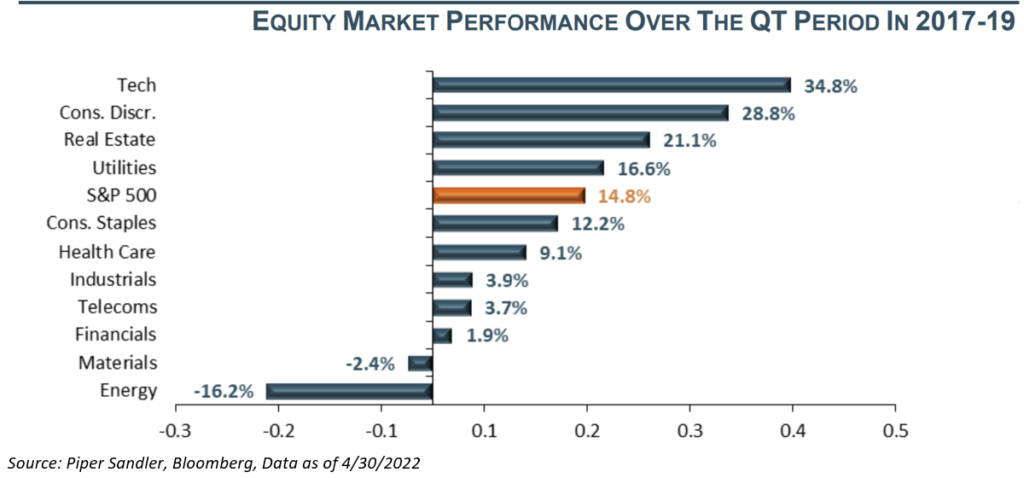
Given the current environment, we’re not committed to following this playbook, especially regarding Energy. In the previous QT cycle, inflation wasn’t in the picture. Now, we are seeing inflation that is far from transitory and the highest since the early 1980s. Again, we believe that macro will be the drivers underneath the hood of the market moving forward.
Equity performance over the past QT period was anything but smooth, particularly with one large correction in the fourth quarter of 2018. In our opinion that correction, however, had little to do with QT itself and a lot to do with market fears that the Fed may overtighten. It was spurred by Powell’s comments that the funds rate at the time (2%) was well below neutral and that the Fed may tighten well above neutral. Of course, the Fed stopped tightening in December of that year at 2.5% and started easing in July 2019.
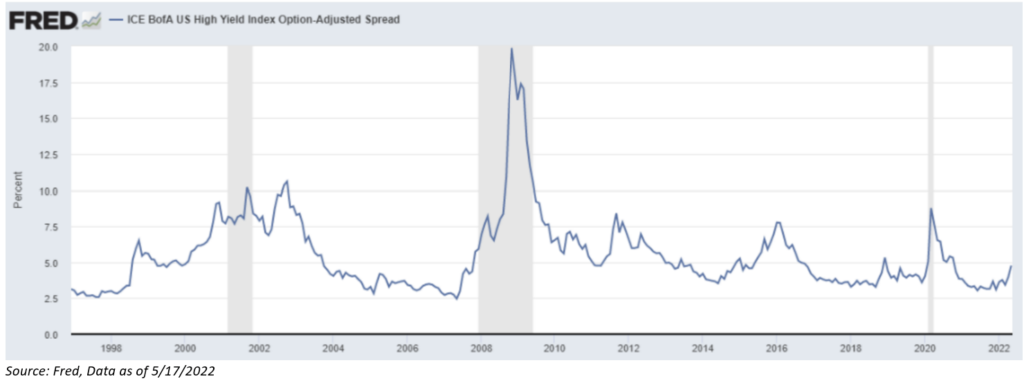
Remember, back in Q4 of 2018, the Fed was forced to take their foot off the hiking petal due to a seizing of liquidity in the corporate bond market (specifically HY). While we have seen signs of increased stress in credit, they are less than 200 basis points above the lows (and well below the historic average). While further widening is a measure we monitor, a major blowout is where we would become more concerned. Rising credit spreads can serve as a warning, but historically they have offered a number of false alarms, although we would expect spreads to widen were we to see a recession.
Conclusion:
The bottom line of this note is to point out that, while the historical experience with QT is very limited, we believe there is absolutely nothing that suggests investors should fear the shrinking of the Fed’s balance sheet. In fact, investors should heed another lesson from that same episode, namely that the Fed is very sensitive to the functioning of the financial system. Should QT lead to some malfunctioning because too much liquidity would have been withdrawn, we can count on the Fed to stop and reverse course quickly, just like it did in the summer and fall of 2019. The outlook for rate hikes and other macroeconomic developments are likely to exert a much larger influence on markets than QT going forward.
All in all, continue to expect volatility.
On a Happier Note…The Weekend
As many of y’all know, I’m a Bengals Fan, I’m a Country Music Fan, and I’m a Joey Burreaux Fan. So, this weekend was a culmination of all of those items as I went to a Garth Brooks Concert at Paul Brown Stadium. I served a crawfish boil for my friends as we tailgated for the concert this past Saturday. Please note:
- The Lawn Ornaments
- The Bengals Super Bowl Newspaper

Disclosures
Past performance is not indicative of future results. This material is not financial advice or an offer to sell any product. The information contained herein should not be considered a recommendation to purchase or sell any particular security. Forward looking statements cannot be guaranteed.
This commentary offers generalized research, not personalized investment advice. It is for informational purposes only and does not constitute a complete description of our investment services or performance. Nothing in this commentary should be interpreted to state or imply that past results are an indication of future investment returns. The visuals shown above are for illustrative purposes. All investments involve risk and unless otherwise stated, are not guaranteed. Be sure to consult with an investment & tax professional before implementing any investment strategy. Investing involves risk. Principal loss is possible.
The S&P 500® Index is the Standard & Poor’s Composite Index and is widely regarded as a single gauge of large cap U.S. equities. It is market cap weighted and includes 500 leading companies, capturing approximately 80% coverage of available market capitalization.
The B of A Merrill Lynch U.S. High Yield Index tracks the performance of below investment grade U.S. dollar-denominated corporate bonds publicly issued in the U.S. domestic market.
Advisory services are offered through Aptus Capital Advisors, LLC, a Registered Investment Adviser registered with the Securities and Exchange Commission. Registration does not imply a certain level or skill or training. More information about the advisor, its investment strategies and objectives, is included in the firm’s Form ADV Part 2, which can be obtained, at no charge, by calling (251) 517-7198. Aptus Capital Advisors, LLC is headquartered in Fairhope, Alabama. ACA-2205-14.
