Most of our pieces are meant to be read by advisors, but sometimes there are topics that will resonate just as deeply with your clients. Here's an example of one that could be white-labeled to help you explain the current conundrum between "lower rates" and what they're seeing in mortgages.
For help thinking through this, contact your PM or reach us at [email protected]
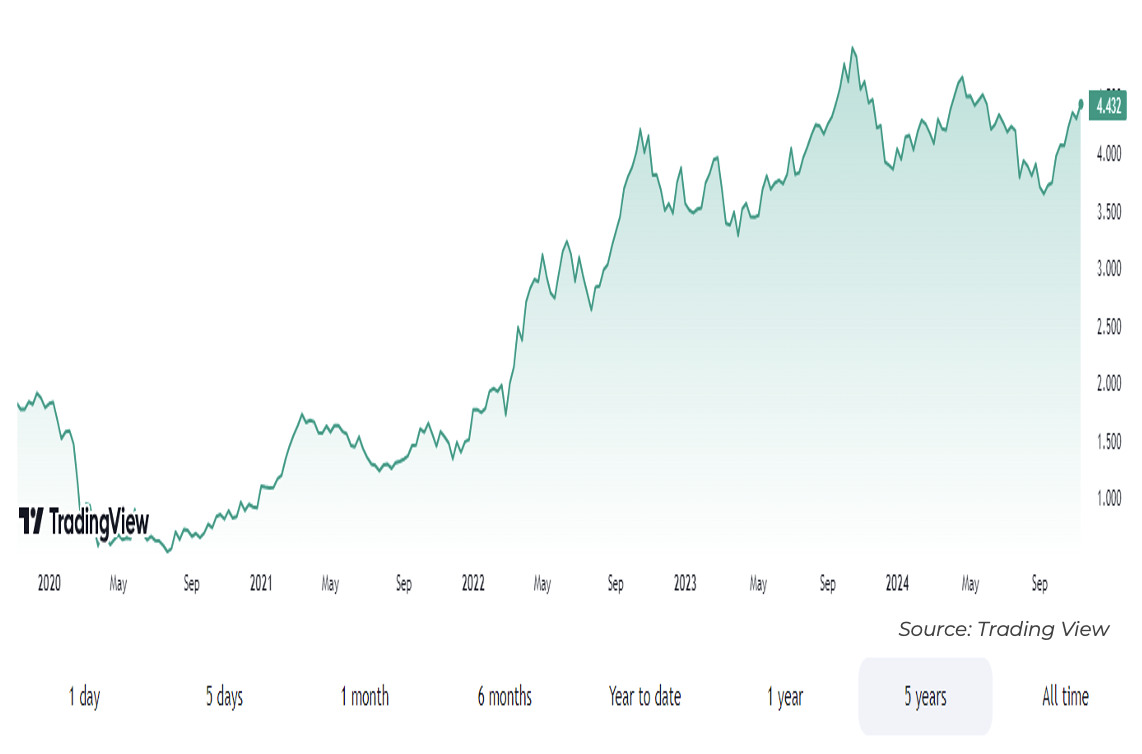
I. Yields Up Big After Rate Cuts?
Bond Yields Are Broken Down into 2 Components:
#1: Expected Fed Funds Rate (FFR)
Currently, the expected neutral rate (where the Fed bottoms out its cutting cycle) is ~3.75%. Looking ahead, we expect the Fed Funds rate to average approximately at this rate.

#2: Term Premiums
The term premium of a bond is simply the additional spread a lender requires for longer-duration bonds over what is available at the front end of the curve. This could also be referred to as the “Price of Time.”

II. Stocks & Bonds Can Correlate
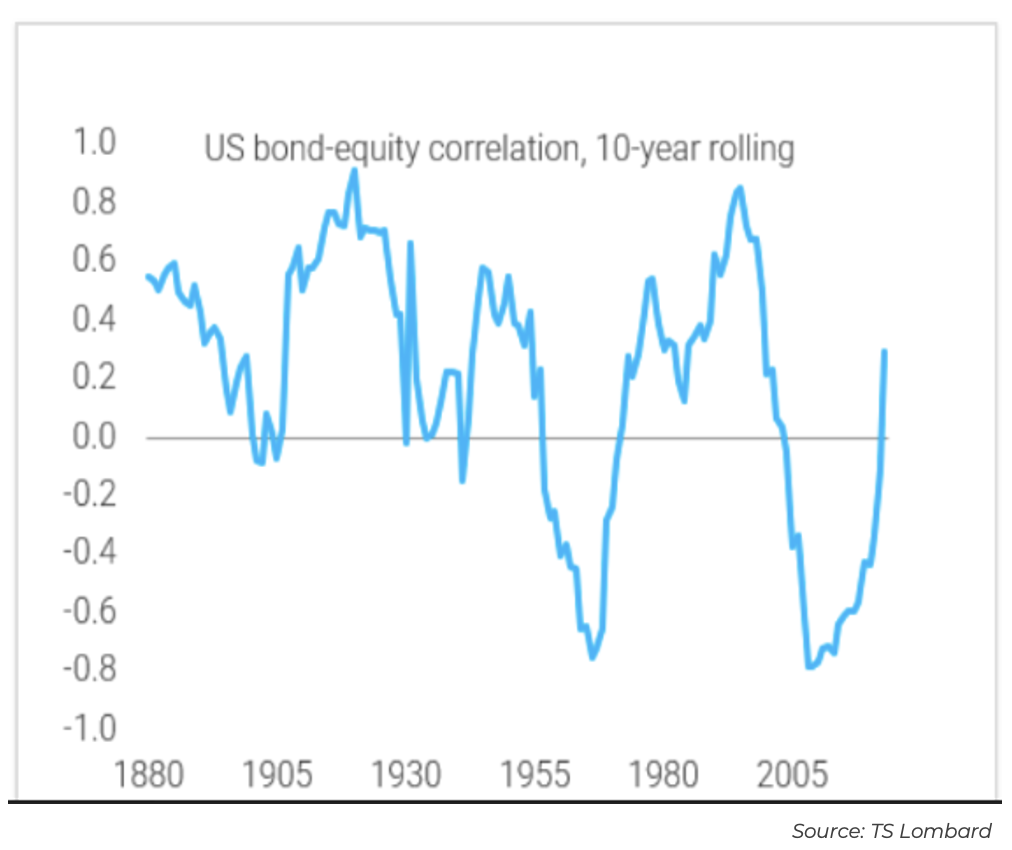
Most investors assume negative correlations between stocks and bonds are a fact of life. This is the bedrock of modern portfolio construction, think “60/40”. This has been a modern phenomenon and not what historical data indicates.
How It Translates to Portfolios:
- Investors buy bonds for portfolio stability, and they accept a lower rate of return because bonds can serve as a hedge to risk assets when things get choppy.
- The last couple of years have challenged that theory and bonds and stocks have been positively correlated, limiting the effectiveness of bonds in an allocation.

- If bonds are positively correlated to stocks, investors should require more compensation for bonds given the lack of certainty of protection which could pressure bond yields higher.
III. What’s Driving Yields Higher?
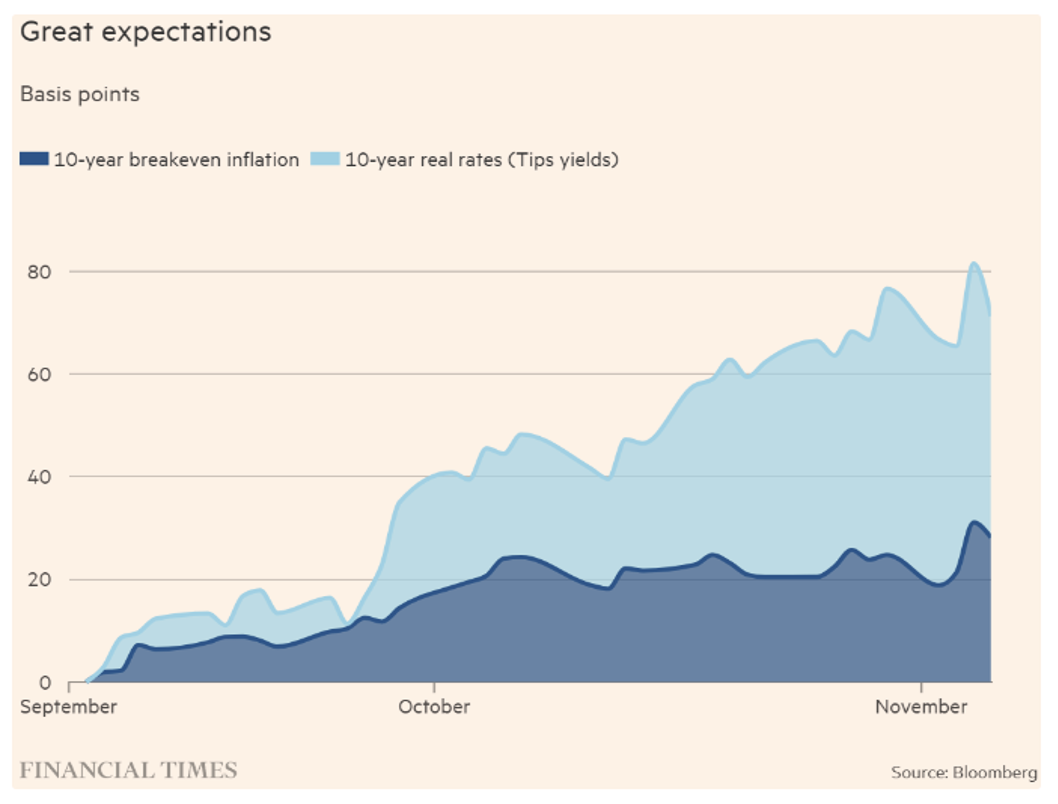
The chart below breaks down the increase in 10-year Treasury yields since they bottomed in late September. The larger part of the increase is accounted for by real interest rates, proxied by yields on inflation-protected Treasuries (TIPS), shown in light blue. Almost 40 percent of the increase is, however, down to higher break-even inflation (the difference between nominal yields and TIPS), in dark blue.
- Growth expectations are certainly driving rates higher as the aggressive Fed cuts increase a higher likelihood of a soft landing.
- Higher inflation expectations are also playing a role in higher yields.
- Investors require more premium to compensate themselves for higher interest rate volatility (fiscal risks.)

Bottom Line:
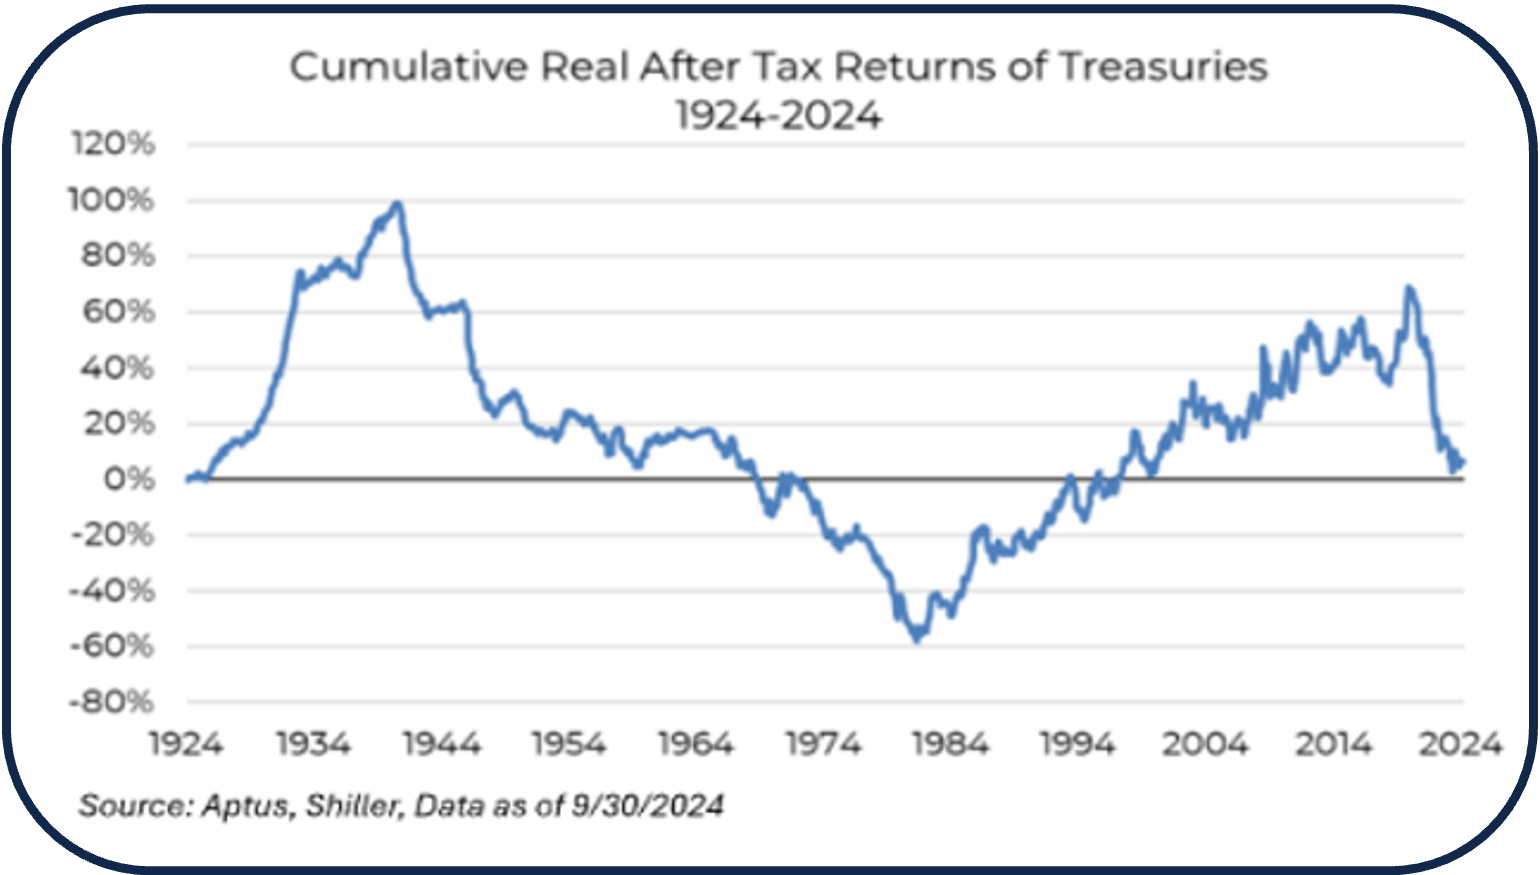
Bonds After Taxes & Inflation
Are Not Exciting
- The Fed sets short-term interest rate policy and has less control over longer-term rates (unless they are actively doing QE and buying LT bonds).
- Long-term yields are a factor of growth and inflation and are set by the markets based on many things (supply and demand, inflation, growth rates, volatility, etc.).

- Fed funds rate is 4.75% (after the cut last week) with neutral expected to be 3.75%
- Term premiums average 75 bps when inflation is low and 150 bps when inflation is high/ volatile, making a fair value of 10yr 4.75%-5.25%.
Our Take
#1: A higher nominal growth rate signals stronger economic activity and higher inflation, both of which tend to push bond yields up as investors seek compensation for inflation and risk associated with higher growth.
Nominal GDP at 5.7% and money supply at 5-7% growth, why would you want to own something yielding less than this??
#2: At 4.30% yield on a 10yr Treasury after tax, 1.72% goes to Uncle Sam (@ 40% rate) leaving you with 2.58% net. If inflation averages 3% over the 10yr period (which has been long term avg and I’d argue it’s going to be higher the next 10) you are left with a real return of -0.42%.
Not very attractive!
Past performance is not indicative of future results. This material is not financial advice or an offer to sell any product. The information contained herein should not be considered a recommendation to purchase or sell any particular security. Forward looking statements cannot be guaranteed.
Projections or other forward-looking statements regarding future financial performance of markets are only predictions and actual events or results may differ materially.
Aptus Capital Advisors, LLC is a Registered Investment Advisor (RIA) registered with the Securities and Exchange Commission and is headquartered in Fairhope, Alabama. Registration does not imply a certain level of skill or training. For more information about our firm, or to receive a copy of our disclosure Form ADV and Privacy Policy call (251) 517-7198.
The 2 Year Treasury Rate is the yield received for investing in a US government issued treasury security that has a maturity of 2 year.
The 10 Year Treasury Rate is the yield received for investing in a US government issued treasury security that has a maturity of 10 year. The 10 year treasury yield is included on the longer end of the yield curve. Many analysts will use the 10 year yield as the “risk free” rate when valuing the markets or an individual security.
This is not a recommendation to buy, sell, or hold any particular security. The holdings shown above are target portfolio weights and do not reflect the entire portfolio. The holdings are sorted by target portfolio percentage weight then alphabetized within each asset range. Actual portfolio investments will vary when invested. A complete list of holdings is available upon request.
Information presented on this presentation is for educational purposes only and offers generalized speech. It is for informational purposes only and does not constitute a complete description of our investment services or performance. Information specific to the underlying securities making up the portfolios can be found in the Funds’ prospectuses. Please carefully read the prospectus before making an investment decision. All investments involve risk and unless otherwise stated, are not guaranteed. Be sure to consult with an investment & tax professional before implementing any investment strategy.
The Consumer Price Index (CPI) measures the change in prices paid by consumers for goods and services. The CPI reflects spending patterns for each of two population groups: all urban consumers and urban wage earners and clerical workers.
Treasury Inflation-Protected Securities, or TIPS, provide protection against inflation. The principal of a TIPS increases with inflation and decreases with deflation, as measured by the Consumer Price Index.
The opinions expressed are those of the Aptus Capital Investment Team. The opinions referenced are as of the date of publication and are subject to change due to changes in the market or economic conditions and may not necessarily come to pass. Forward looking statements cannot be guaranteed.
Investing involves risk. Principal loss is possible. Diversification is not a guarantee of performance and may not protect against loss of investment principal. ACA-2411-20.

