Paying a $39 million salary to LeBron is reasonable. He’s going to bring the team tremendous value. He’ll stuff the stat sheet and fill the stands. Is there risk he’s going to have a down year…sure, but he’s still LeBron.
It is different than paying Greg Oden $39 million in salary. My return on that $39 mil could be zero. If you’re asking yourself, who the heck is Greg Oden? That’s the point.
What is a Stock?
A stock is simply a claim on future cash flows.
Where does return come from?
Your investment return while owning the stock is driven by yield, growth, and/or valuation changing. In simple terms, let’s say you own a stock with a stock price of $10, it pays no dividend, has $1 of earnings, and trades at a 10x multiple of earnings (1 x 10). How could you generate return?
- Yield = 0% as it pays no dividend.
- Growth = The company grows earnings at 25%, so it now earns $1.25 of income. If multiples stay intact (10x), your stock price is now $12.50. This increases your investment return by 25%.
- Valuation = Multiples expand. Let’s assume the market values this business at 15x earnings rather than 10x – investor sentiment and expectations of future growth has gone up. This positive expansion in multiple translates to a stock prices of 15 x 1.25 = $18.75. Rising multiples generate returns.
We want to take our capital, exchange it for claims on the future cash flows of businesses set to compound. We look through a good bit of data to get to a simple place – a combined yield + growth score that’s double digits. We are aware of valuation, just not dependent on multiples expanding. Reason being, we think multiples are a wash over time.
Markets ebb and flow from high valuation to low (impacting total return in a negative way) and then from low valuation to high (this is a great time to own stocks). Where do you think we are today???
Our process is consistently simple, looking for what we see as profitable, quality companies, priced reasonably (we don’t want to get in front of crashing multiples), and hopefully positioned for growth. We will not be perfect in all environments, and that’s ok. Perfection is not required when you have the right perspective on time horizon and what a stock really is.
Price Matters…So does Cash flow
To state the obvious – a claim on future cash flows (a stock) derives its value by taking those future cash flows and discounting them to today. This requires assumptions around what those cash flows will be, and an appropriate discount rate. There’s some complexity there, but to simplify, think about it this way:
If you know you own a claim to $100 a year from now, what would that claim be worth today? If you could buy that claim at $50 vs $95, your return will obviously be better. The lower price you pay the greater potential for return. This is valuation in a nutshell. The valuation environment can be lucrative to shareholders…or not. You can substitute valuation for the word multiple like our example above.
The last obvious point is the cash flow itself. With stocks, there’s no guarantee of cash flows. It’s a competitive world. What happens if that $100 you expect to receive in a year turns out to be $75…or worse – ZERO?
It makes sense to think about the price you’re paying for future cash flows and the risk around those cash flows themselves, doesn’t it?
An Introduction
Before we get further, let us introduce you to an index. An index is simply a basket or group of stocks whose grouping is dependent on a certain criterion. For example, the S&P 500 Index is a grouping of 500-ish stocks based on company size. It is roughly the largest 500 US based companies.
Enter stage… ‘Goldman Sachs Non-Profitable Tech Index’. This can be tracked within Bloomberg under the ticker GSCBNPTC. Here is the description of this basket of stocks:
“The GS Non-Profitable Tech basket consists of non-profitable US listed companies in innovative industries. Tech is defined quite broadly to include new economy companies across GICS industry groupings.”
You read that right – this is a basket of stocks that make ZERO dollars. In fact, they lose dollars. Their businesses are funded with outside capital (equity or debt) and the price of the future claims from this business (their stock price) is purely based on expectations and potential. Some of the companies will end up producing crazy amounts of cash flow, some of them won’t ever produce a dollar. There’s no magic 8 ball, so seems like you should proceed with caution, especially if valuations (multiples) are sky high.
Below is a chart from the end of 2015 through the bottom of the COVID chaos in 2020. We compare the Non-Profitable Tech basket to the S&P 500 on price return only. As you’d expect, the S&P does a little better. You would have made just 17% or so by owning the S&P and you would have lost 11% or so in the Non-Profitable tech basket. This was not a great stretch for stocks as we are ending the chart with the cliff that was COVID. The point is that the performance is about like you’d expect. Companies generating sales in a profitable way performed better than those that generate sales in a negative way.
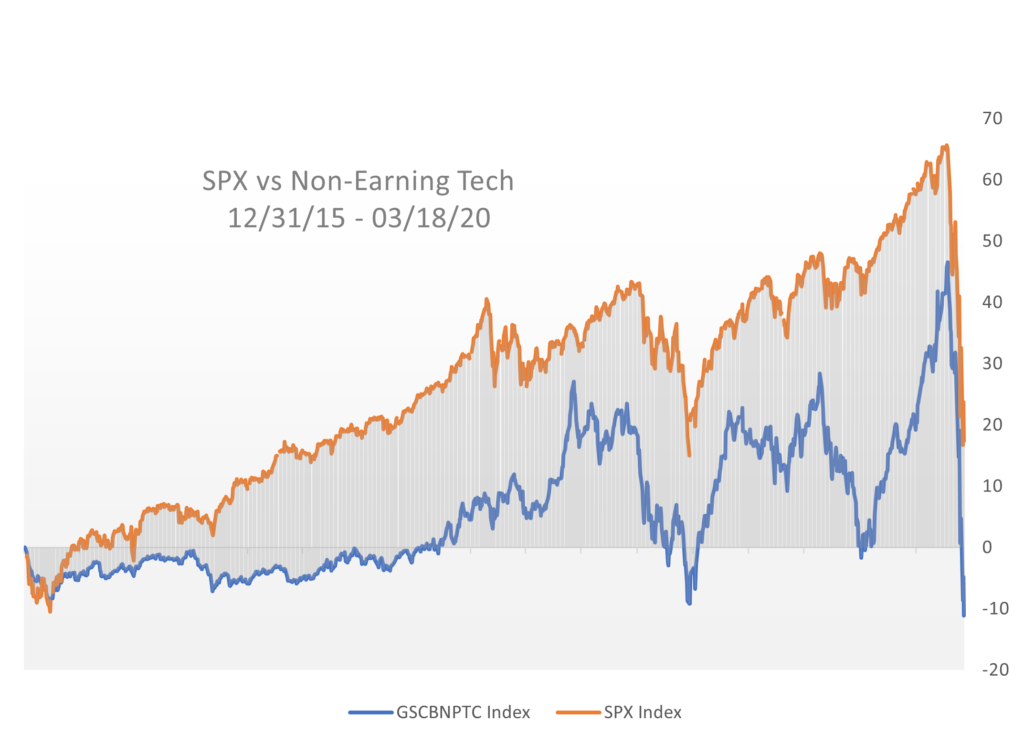 Source: Bloomberg, 01.14.2021
Now let’s take a look at what has happened since 3/18/2020 – this is where things get interesting.
Before we peek at the chart, think about what has happened – pandemics, monetary and fiscal stimulus like never before, interest rates at rock bottom prices, etc.
The Non-Profitable tech index is up nearly 400% vs the S&P 500 up just 58%.
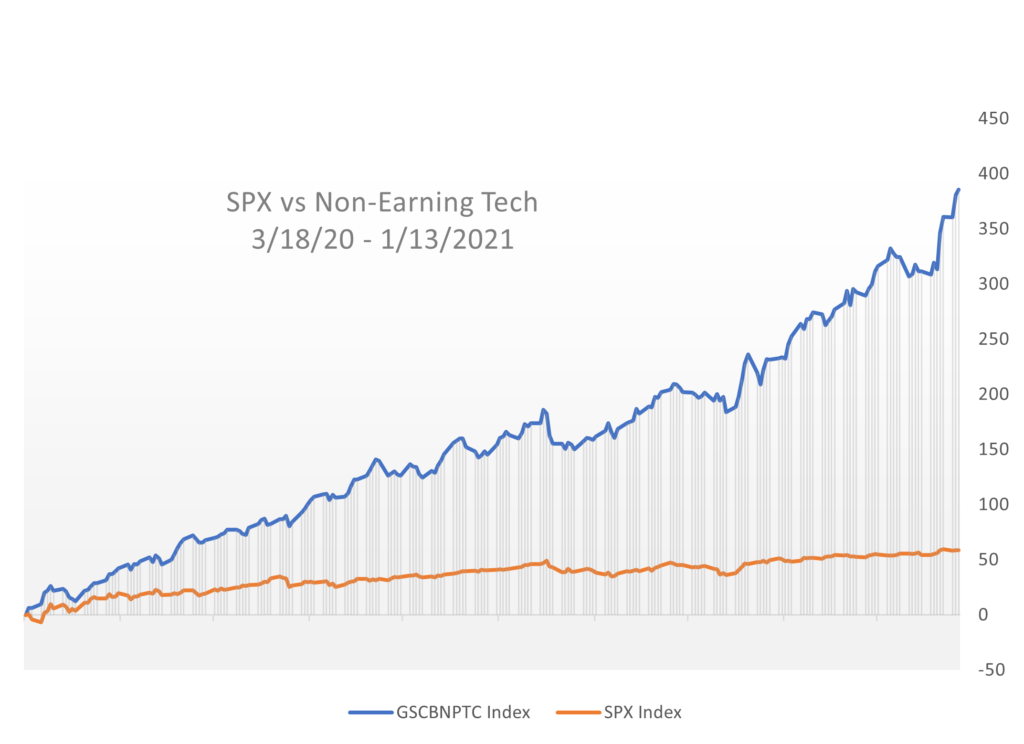 Source: Bloomberg, 01.14.2021
Conclusion
The current market environment is full of risk. There are multiples on future cash flows that are sky high, as evidence by the outperformance you see above.
Investors must remember – where do my returns come from and what risk is associated with those returns?
The risk of a market slowdown while owning profitable companies is one thing. The risk that comes with paying a historically extreme multiple on the hope of future cash flows is much different, and beyond our appetite.
There are companies embedded in the chart above that may never generate a dollar of profitability. Paying 25x sales or higher (not earnings, sales!) for a company that may or may not be with us in the future, much less generate any income, puts capital at undue risk of being destroyed. Not impaired…destroyed.
There are Greg Odens everywhere.
History has shown that valuation environments like this have usually not ended well. Making tons of money quickly is fun and addicting – just not sustainable. We’ll stick with our simple y + g framework for sustainable outcomes.
Disclosures
Past performance is not indicative of future results. This material is not financial advice or an offer to sell any product. The information contained herein should not be considered a recommendation to purchase or sell any particular security. Forward looking statements cannot be guaranteed.
This commentary offers generalized research, not personalized investment advice. It is for informational purposes only and does not constitute a complete description of our investment services or performance. Nothing in this commentary should be interpreted to state or imply that past results are an indication of future investment returns. All investments involve risk and unless otherwise stated, are not guaranteed. Be sure to consult with an investment & tax professional before implementing any investment strategy. Investing involves risk. Principal loss is possible.
When a page is marked “Advisor Use Only” or “For Institutional Use”, the content is only intended for financial advisors, consultants, or existing and prospective institutional investors of Aptus. These materials have not been written or approved for a retail audience or use in mind and should not be distributed to retail investors. Any distribution to retail investors by a registered investment adviser may violate the new Marketing Rule under the Investment Advisers Act. If you choose to utilize or cite material we recommend the citation, be presented in context, with similar footnotes in the material and appropriate sourcing to Aptus and/or any other author or source references. This is notwithstanding any considerations or customizations with regards to your operations, based on your own compliance process, and compliance review with the marketing rule effective November 4, 2022.
Advisory services are offered through Aptus Capital Advisors, LLC, a Registered Investment Adviser registered with the Securities and Exchange Commission. Registration does not imply a certain level or skill or training. More information about the advisor, its investment strategies and objectives, is included in the firm’s Form ADV Part 2, which can be obtained, at no charge, by calling (251) 517-7198. Aptus Capital Advisors, LLC is headquartered in Fairhope, Alabama. ACA-2211-4.
