For today’s musing, I’m just going to throw some thoughts out there regarding the current market – so my rants may be all over the place. The end of each day feels as if we are coming out of the boxing ring after a bout with Mike Tyson. The whipsaws in the market, the continued incremental news, and earnings necessitate that, as investors, we all need to take a deep breath and utilize weekends as a cleansing experience. As always, it’s never great to invest with emotions – invest with a plan, stick to that plan, and let the structural benefits of how we are allocated do the talking over longer periods of time, i.e., be more exposed to areas of the market with actual return drivers.
The first line of T.S. Elliot’s 1922 poem,” The Waste Land”, reads “April is the cruelest month” – and it certainly was for investors this year. The S&P 500 just suffered its 3rd worst monthly performance in the past 10 years, led by the Tech sector which had its worst month since 2008. The volatility in the market has everyone on edge and it’s not just the huge swings in trillion-dollar companies, like we saw with Amazon, but the overall market plumbing appears under stress too – the market has been grinding lower and gapping higher – particularly intraday. On most trading days this year, the market has witnessed a greater than 1%+ intraday move!
…It’s wild out there!
The S&P 500 dropped sharply Friday, breaking the 2022 YTD lows, and the technical outlook turned decidedly more negative as markets continue to face multiple headwinds from: 1) A hawkish Fed, 2) Global growth risks from the Russia/Ukraine war and 3) Global growth risks from China’s “Zero COVID” policy and lockdowns.
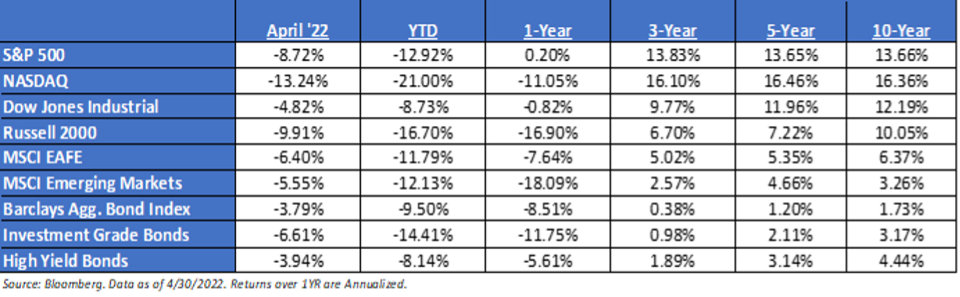
Looking at Friday, we believe the negative catalysts were 1) Earnings (AMZN and AAPL, although neither report was that bad, the market doesn’t have tolerance for underwhelming numbers right now), and 2) Unit Labor Costs (“ULC”). Yes, the Core PCE Price Index slightly underwhelmed, but ULCs were hotter than expected and that implies inflation is becoming entrenched as wages don’t tend to go down much (they set a floor)— and that will keep the Fed hawkish. This was the highest ULC growth reading since Q3 1985.
Until we get some catalyst to make the Fed less hawkish (2022 has ten rate hikes priced in), real progress on a Ukrainian ceasefire or China abandoning the “Zero COVID,” policy, it’ll be hard to get a sustained stock rally. A lot of these aforementioned bearish points didn’t get worse over the last two weeks, as the market is down ~10% during that period, it’s the fact that these bearish points didn’t get incrementally better.
Many investors may not recognize this, but the S&P 500 is now flat year-over-year:
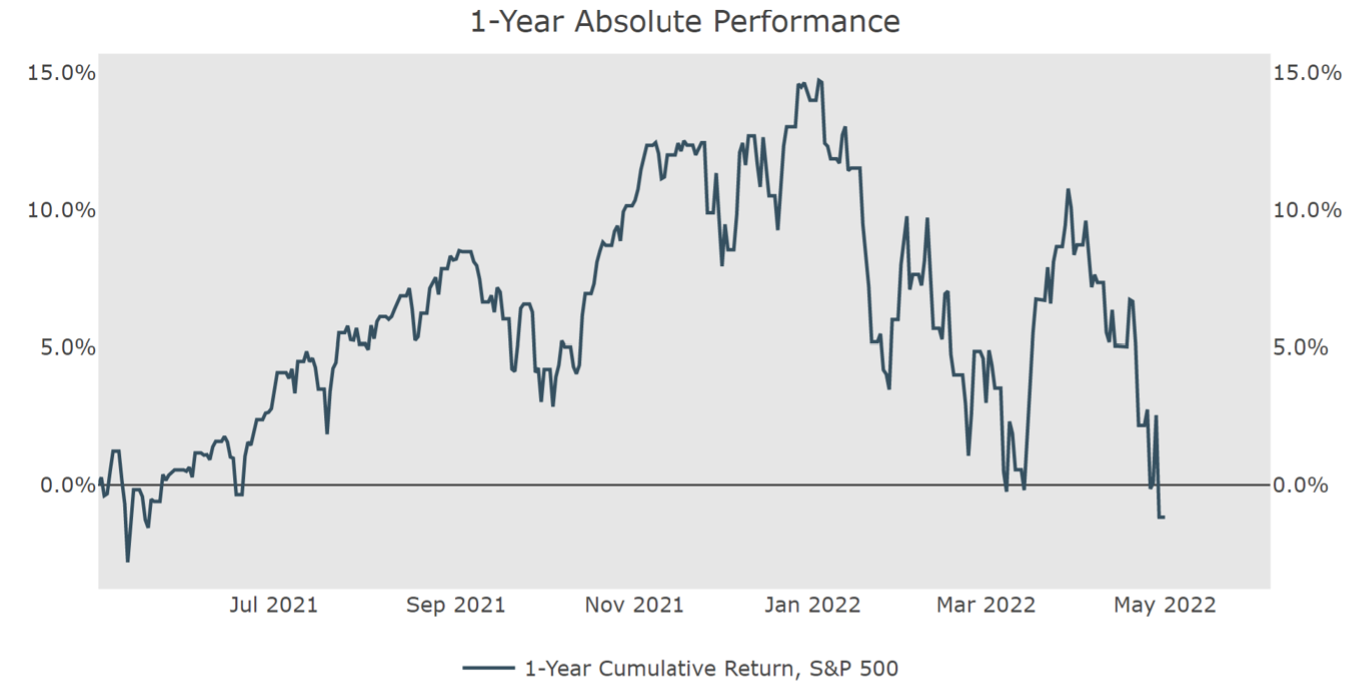
Source: PSC, Data as of 4/30/2022
Finally, the FOMC meets this week on Wednesday. A 50-basis-point increase in the federal-funds target range, from the current 0.25%-0.50%, is a 99% certainty at the coming gathering, according to the fed-funds futures market. What we want to know is whether more 50- or even 75-basis-point hikes in the future are likely and what the plan is for shrinking the central bank’s enormous balance sheet.
The anticipation of a change in policy seems to be more powerful than the actual event. Just look at the last meeting when the Fed hiked rates, the S&P 500 went on to rally about 10% in the weeks after the meeting. Bottom-line, there is a lot of macro uncertainty right now, which my comments below, may surprise people, as I’ll be focusing on market fundamentals, i.e., valuations.
How Should Investors Look at Market Valuations?
While valuation is a poor ST timing tool, it does give the average investor some sense of how much risk they are taking at a given time. We believe that the relatively rapid transition of Fed policy from quantitative easing to quantitative tightening may be one of the most significant developments for the financial markets since the 2008 global financial crisis à Read this again x2.
Given the market pullback, many people are starting to point to valuation as a catalyst. But, when we look at historical data, valuations and short-term market movements tend to not be a contributing factor. Yes; valuations are a meaningful factor over longer-periods of time, but not in the very short-term.
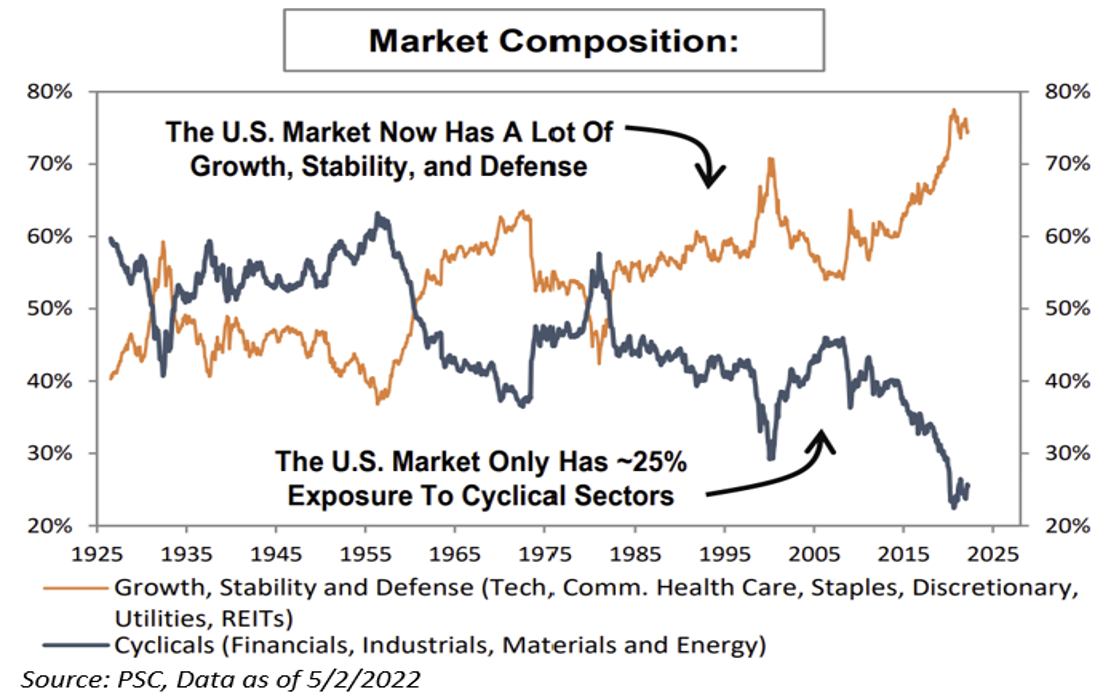
When comparing multiples to history, it is important to remember that index composition changes over time, and because of this, one cannot make a direct comparison of today’s market to a previous market episode. There wasn’t a single financial company in the S&P 500 until 1976, and until 1988, 400 of the S&P 500 companies were Industrials! Comparing the P/E of the market today vs history is akin to comparing apples and oranges.
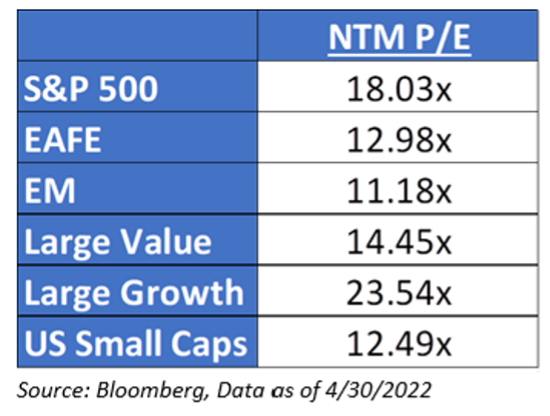
I understand that I just had a rant on short-term readings of market valuations. But, as we know, they are a great longer-term tool. And just this morning, I sent out to the investment committee some thoughts regarding small cap valuations.
Right now, U.S. Small Caps are trading at a discount to Large Cap (we all knew this), but also MSCI EAFE. Remember, we believe that Europe is looking down the barrel of the recession gun. Yet, the market is pricing domestic small caps at a cheaper valuation – sentiment is very low in this space. Take this a step further, U.S. small caps as an asset class have the least amount of exposure to international revenues – 30% of US Large Cap Revenues come from international exposures, while US Small Cap is around 20%.
To me, when you finally take a step back to look at this market in a clearer lens – we believe that there are opportunities over longer periods of time – and we look to take advantage of these chances.
Disclosures
Past performance is not indicative of future results. This material is not financial advice or an offer to sell any product. The information contained herein should not be considered a recommendation to purchase or sell any particular security. Forward looking statements cannot be guaranteed.
This commentary offers generalized research, not personalized investment advice. It is for informational purposes only and does not constitute a complete description of our investment services or performance. Nothing in this commentary should be interpreted to state or imply that past results are an indication of future investment returns. All investments involve risk and unless otherwise stated, are not guaranteed. Be sure to consult with an investment & tax professional before implementing any investment strategy. Investing involves risk. Principal loss is possible.
The S&P 500® is widely regarded as the best single gauge of large-cap U.S. equities. There is over USD 11.2 trillion indexed or benchmarked to the index, with indexed assets comprising approximately USD 4.6 trillion of this total. The index includes 500 leading companies and covers approximately 80% of available market capitalization.
The Nasdaq Composite Index measures all Nasdaq domestic and international based common type stocks listed on The Nasdaq Stock Market. To be eligible for inclusion in the Index, the security’s U.S. listing must be exclusively on The Nasdaq Stock Market (unless the security was dually listed on another U.S. market prior to January 1, 2004 and has continuously maintained such listing). The security types eligible for the Index include common stocks, ordinary shares, ADRs, shares of beneficial interest or limited partnership interests and tracking stocks. Security types not included in the Index are closed-end funds, convertible debentures, exchange traded funds, preferred stocks, rights, warrants, units and other derivative securities.
The Dow Jones Industrial Average® (The Dow®), is a price-weighted measure of 30 U.S. blue-chip companies. The index covers all industries except transportation and utilities.
The Russell 2000® Index measures the performance of the small-cap segment of the US equity universe. The Russell 2000® Index is a subset of the Russell 3000® Index representing approximately 10% of the total market capitalization of that index. It includes approximately 2,000 of the smallest securities based on a combination of their market cap and current index membership. The Russell 2000® is constructed to provide a comprehensive and unbiased small-cap barometer and is completely reconstituted annually to ensure larger stocks do not distort the performance and characteristics of the true small-cap opportunity set.
The MSCI EAFE Index is an equity index which captures large and mid-cap representation across 21 Developed Markets countries*around the world, excluding the US and Canada. With 902 constituents, the index covers approximately 85% of the free float-adjusted market capitalization in each country.
The MSCI Emerging Markets Index captures large and mid-cap representation across 26 Emerging Markets (EM) countries*. With 1,387 constituents, the index covers approximately 85% of the free float-adjusted market capitalization in each country.
Investment-grade Bond (or High-grade Bond) are believed to have a lower risk of default and receive higher ratings by the credit rating agencies. These bonds tend to be issued at lower yields than less creditworthy bonds.
Non-investment-grade debt securities (high-yield/junk bonds) may be subject to greater market fluctuations, risk of default or loss of income and principal than higher-rated securities.
The Bloomberg Barclays U.S. Aggregate Bond Index is a broad-based benchmark that measures the investment grade, U.S. dollar-denominated, fixed-rate taxable bond market. This includes Treasuries, government-related and corporate securities, mortgage-backed securities, asset-backed securities and collateralized mortgage-backed securities
The core PCE price index measures the prices paid by consumers for goods and services without the volatility caused by movements in food and energy prices to reveal underlying inflation trends.
Unit labour costs are often viewed as a broad measure of (international) price competitiveness. They are defined as the average cost of labour per unit of output produced. They can be expressed as the ratio of total labour compensation per hour worked to output per hour worked (labour productivity). This indicator is measured in percentage changes and indices.
No representation is being made that any model or model mix will achieve results similar to that shown and there is no assurance that a model that produces attractive hypothetical results on a historical basis will work effectively on a prospective basis.
Advisory services are offered through Aptus Capital Advisors, LLC, a Registered Investment Adviser registered with the Securities and Exchange Commission. Registration does not imply a certain level or skill or training. More information about the advisor, its investment strategies and objectives, is included in the firm’s Form ADV Part 2, which can be obtained, at no charge, by calling (251) 517-7198. Aptus Capital Advisors, LLC is headquartered in Fairhope, Alabama. ACA- 2205-5.
