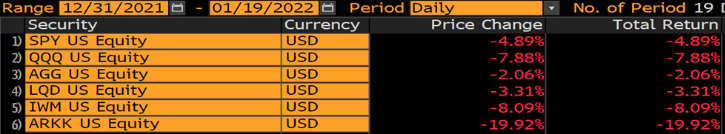
Source: Bloomberg LP. As of 1/19/22.
Markets have started off on a rough note to begin 2022. The fear of a reduction in market accommodation as the Fed pulls support and (likely) hikes rates has spooked markets. In response to rising rates, persistent inflation and a less friendly Fed, stocks have traded lower.
The S&P 500 is down almost -5% so far in ’22 with only two sectors positive: Energy (XLE +15.86%) and Financials (XLF +0.51%). While the market selloff has been across the board, long duration assets, i.e., QQQs -7.88% & ARKK -19.92%, have gotten smoked. Bonds have performed poorly as interest rates have risen, having a positive correlation with stocks – this has led to a rough start for 60/40 portfolios in ‘22.
Political Pressures Are Mounting
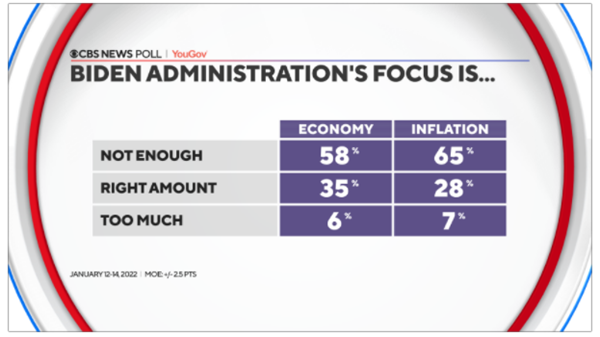
Source: CBS News. As of 1/18/22.
Until recently, the Fed thought that erring on the side of being overly accommodative was preferable because inflation was not a threat. While we are not at the point where inflation or inflation expectations are out of control, the risk is increasing and so erring on the side of hawkishness is now becoming more attractive. The political cost of faster tightening is also diminishing, as few politicians these days seem inclined to downplay the risk of inflation.
Inflation is now a political issue – President Biden recently indicated that bringing down inflation is now his top priority. We are hearing the same questions from Senators of both parties as they have questioned Powell aggressively at recent testimonies. The Fed is independent, yes, but they are also accountable to Congress and can’t entirely ignore the direction of politics, especially in a mid-term election year.
Fed’s Gameplan: Aggressive Rate Hikes vs. Less Hikes and more Balance Sheet Reduction.
Historically, well since QE began, the Fed’s playbook has consisted of two tools to tighten market liquidity and combat inflation. They’ve utilized interest rate hikes and balance sheet reductions.
Right now, the Fed’s balance sheet is nearly $9 trillion – Jerome Powell stated in his hearing earlier this week, “It’s far above where it needs to be.” He also reminded us that the Fed hasn’t made any decisions on whether they would sell assets off their balance sheet, but also commented that they hadn’t ruled it out, either – “It’s something we will be looking at.”
Seems like most participants are focused on the Fed aggressively hiking rates this year (4 rate hikes are currently priced in) with lift off beginning in March, immediately following the end of QE. We’ve even seen an increase in the possibility for a 50bps hike in March (the last time the Fed hiked by 50 bps in one meeting was almost 22 years ago). Could market assumptions be missing the mark? We think the likelihood of less hikes and more assets sales in ’22 is a real possibility. A preferable one in our opinion for a softer landing.
Back in 2010, Jim Bullard rallied the Fed troops to look at asset sales as the first order of removing accommodation from the markets BEFORE hiking interest rates. Rates didn’t move until the end of 2015 and the asset sale discussion was put aside. In 2017, Janet Yellen termed the idea of balance sheet reduction as “paint drying” where securities that matured weren’t replaced, specifically no asset sales, as they would just roll off at maturity. To note, there actually was about $200bn in agency MBS sold off the Treasuries balance sheet (product of QE0 in ’08) in early ’11 – with no problem. So – it has (quietly) been done!
So why haven’t asset sales been a more popular tool versus rates hikes as a mechanism to tighten policy? The answer gets a little complicated. Banks make free money on excess reserves and the higher front end rates go, the more money they make. For example, in ’15, before liftoff there were $2 trillion in excess reserves in the system. Every 100bps hike in the Fed Fund’s rate yields about $20bn in interest income for participating banks. As a side note, prior to ’06, it was illegal for the Fed to pay interest on reserves. Banks lobbied and banks won and in ’08 it become status quo for banks to get paid for their reserves (never let a good crisis go to waste?). Simply, monetary incentives drive the bank’s plea for more rate hikes and less asset sales (if you think a little deeper, banks own many of the same FI instruments the Fed does and in turn would be selling – less buyers and more sellers probably leads to lower prices).
Today, there are about $4 trillion in excess reserves (quick math 1% Fed funds rate = $40bn CASH MONEY) which makes banks profitability highly levered to rates rising.
While this is all a bit technical and nuanced, the bottom line is these numbers are astronomical and in turn likely hard to hide from the public. Between Elizabeth Warren’s distaste for bankers and conservatives’ views of lowering the Fed’s balance sheet, we could see a rare alignment of forces when it comes to handling the current monetary debacle.
So, What is the Solution?
Right now, the market is pricing in four rate hikes in ’22. Many view an aggressive Fed as having the potential to derail the economic recovery too quickly by over tightening financial conditions. We believe this is the reason we’ve seen a flatter yield curve. In addition, while current inflation is high, assuming as goods inflation slows and supply chain issues recover, it’s reasonable to assume inflation slows substantially by the end of year. With that in mind, are four rate hikes, too much (I.e., hiking into slowing growth and inflation)?! We think there COULD be another, more amicable solution.
If the goal is to remove accommodation, does it matter how the accommodation gets removed? We see a potential for fewer rate hikes and more asset sales. The Fed rule of thumb is for every $100bn in asset purchases/ sales it is equivalent to an 8bps rate cut/ hike. Can the Fed sell enough assets to offset the need of hiking rates 3-4 times in ’22?
Potential Recipes: Hike 3-4x in ’22 (Status Quo at this point); Two rates hikes and $25bn per month in sales; One hike and $50bn per month in sales. Either way, in option 2 or 3, accommodation gets removed and the balance sheet starts to shrink from its elevated level. Overall, we think this could check multiple boxes: #1 keep the curve steep (inverted curve = BAD); #2 Slow the housing market (fueled by artificially low rates); #3 Appear as hard on big banks (looks good in the eyes of us small folk). Maybe crazy man Bullard was onto something?!
So, How High can Interest Rates Go?
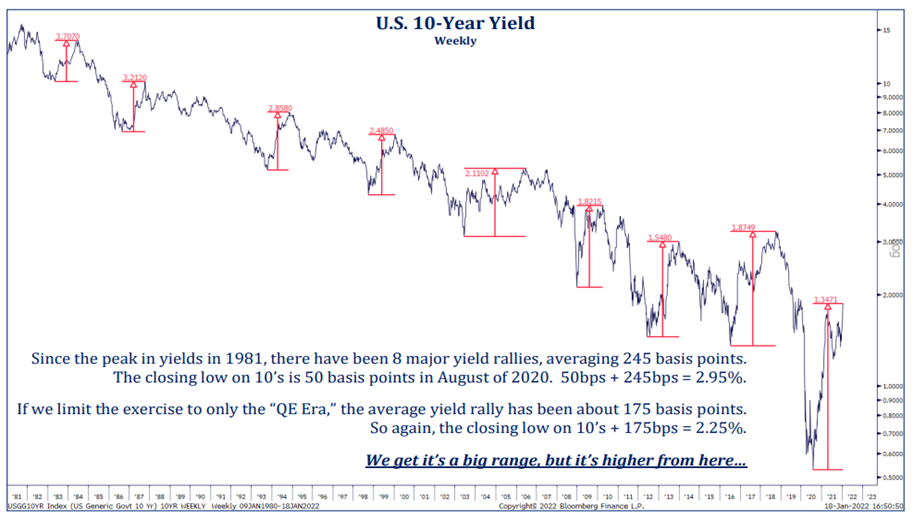
Source: Strategas. As of 1/19/22.
We’ve been getting the same question from clients the last few weeks, “how high can rates go?” The move in rates to start ’22 has been eye opening. 10s started ’22 at 1.51% and currently sit at 1.86%, a 23% increase… in 19 days. So, how much higher can they go? Well, first we will state the obvious, being a bond market bear the last 40 years plus has been a widow maker trade. BUT if we had to guess, we’d look to the 2.25% – 2.50% area for a test. Since yields peaked in 1981, the average rate rally has been about 245 basis points… 245bps + the 2020 low in yields (about 50bps) gets us to 2.95%. If we limited the exercise to only the rate rallies in the QE era, the average move is 175bps. Again, 175bps + the low of 50bps = 2.25% (see graphic on pg. 2).
Guessing short term interest rate fluctuations is a loser’s game. However, the trend for higher yields firmly remains intact and until those changes, we look for rates to keep rising. In saying that, we don’t really care! With inflation printing a 7 handle and interest rates below 2%, we are steering clear as much fixed income as possible in our portfolios – and we aren’t just saying that — it’s TRUE!
There is a lot to shake out over the next couple of months moving into March, but we believe the Fed must do something. Biden said it again last night, “Need to get inflation under control”. Maybe there are other alternatives to aggressively hiking rates that could be “less” bad for risk assets? We think a more aggressive, well communicated balance sheet reduction could be it. Time will tell.
Disclosures
Past performance is not indicative of future results. This material is not financial advice or an offer to sell any product. The information contained herein should not be considered a recommendation to purchase or sell any particular security. Forward looking statements cannot be guaranteed.
The S&P 500 Index is the Standard & Poor’s Composite Index and is widely regarded as a single gauge of large cap U.S. equities. It is market cap weighted and includes 500 leading companies, capturing approximately 80% coverage of available market capitalization.
This commentary offers generalized research, not personalized investment advice. It is for informational purposes only and does not constitute a complete description of our investment services or performance. Nothing in this commentary should be interpreted to state or imply that past results are an indication of future investment returns. All investments involve risk and unless otherwise stated, are not guaranteed. Be sure to consult with an investment & tax professional before implementing any investment strategy. Investing involves risk. Principal loss is possible.
Advisory services offered through Aptus Capital Advisors, LLC, a Registered Investment Adviser registered with the Securities and Exchange Commission. Registration does not imply a certain level or skill or training. More information about the advisor, its investment strategies and objectives, is included in the firm’s Form ADV Part 2, which can be obtained, at no charge, by calling (251) 517-7198. Aptus Capital Advisors, LLC is headquartered in Fairhope, Alabama. ACA-2201-21.
