Another Hot Inflation Report
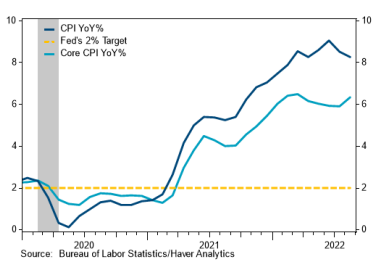
CPI came in above expectations yet again. In fact, headline inflation has only come in below expectations once in the past year. The U.S. CPI rose +0.1% m/m in Aug, and 8.3% y/y. The core CPI (ex food & energy) surged +0.6% m/m and 6.3% y/y. Food prices rose 0.8%, while energy prices dropped 5.0% in August, following a 4.6% decline in July. Excluding food and energy costs, the core CPI rose 0.6%, double the 0.3% rise expected and following a 0.3% increase in July.
 Source: Stifel/ BLS. As of 9/13/22
The Details: housing prices increased 0.8%, thanks to a 0.7% rise in the OER, medical care prices increased 0.7%, other goods and services costs also gained 0.7%, and recreation prices rose 0.2% in August. Also, apparel prices rose 0.2%, and education and communication prices gained 0.1%. On the other hand, transportation prices fell 2.3%, due to a 0.1% decline in used cars and truck prices. New vehicle prices, however, rose 0.8%. Additionally, commodities prices fell 0.8%, and airline fares dropped 4.6% in August, the third consecutive month of decline.
This morning’s report was a mixed bag, underscoring the complexities of inflation. With a reduced pace of growth in the headline fueling optimism for ongoing relief, broadly speaking, prices remain stubbornly elevated. The bottom line is U.S. inflation is still too high, and monetary policy needs to continue to tighten, in our opinion (we continue to look for the fed funds rate to approach 4% by the end of the year). The Sep FOMC meeting looks like another +75 bp hike.
Financial Conditions Remain Soft
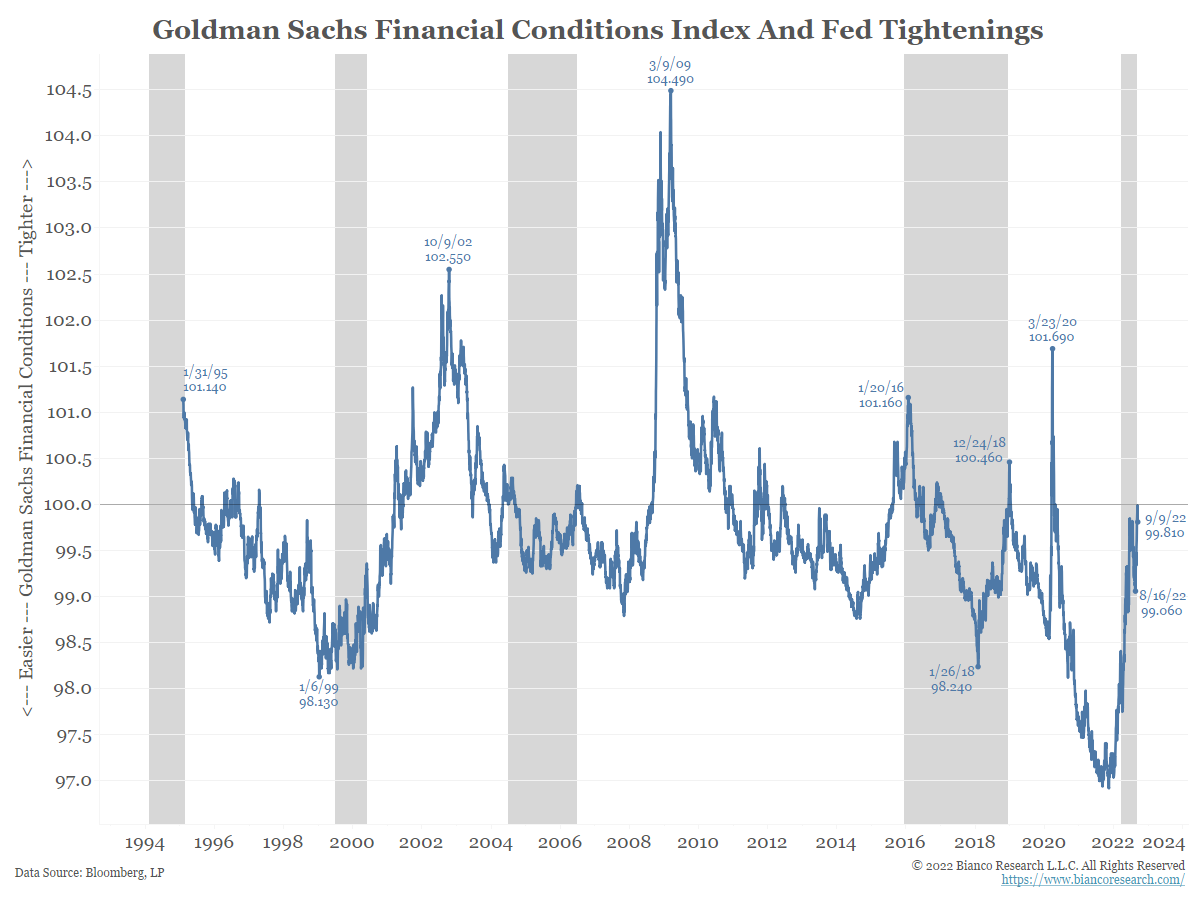
The bond market, particularly high yield credit, is an important risk indicator across the markets gauging market sentiment and risk acceptance. Even as complex as things appear (equity market & rising yield environment), credit spreads are just back to their historically average levels (not much stress). Again, this suggests that financial conditions are still accommodative and growth is holding up. Consequently, there isn’t much of a catalyst for real yields to decline (as the Fed keeps jacking up front end rates). We believe rate hikes drive yields, but QT drives spreads. QT might take a few months to bite, but for now, financial conditions remain accommodative.
 Source: Bianco. As of 9/9/22
QT is Lurking
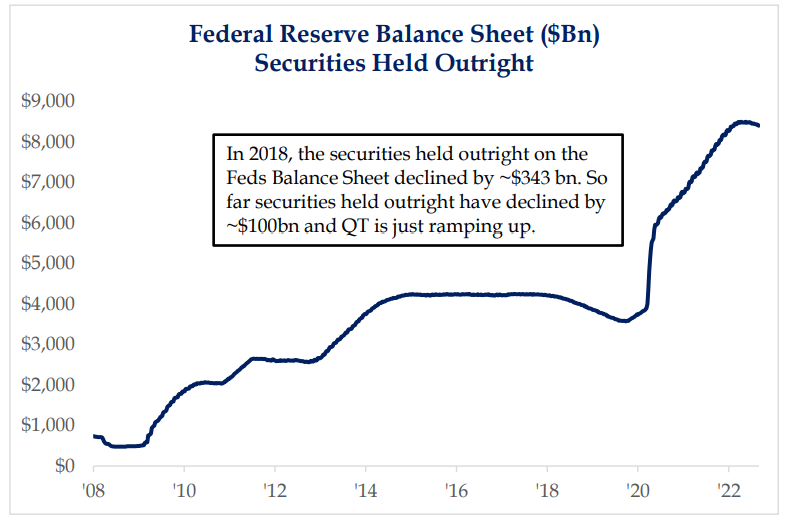
Quantitative Tightening (QT) has not been discussed enough – the scheduled run-off in the size of the assets on the Fed’s Balance Sheet to the tune of $95 billion a month. As the chart below indicates, the Fed is in the very early stages of draining the $5 trillion in excess liquidity pumped into the economic system since the pandemic began.
While there is a wide array of data on the impact of Fed tightening via more conventional means, neither the central bank nor investors have much historical context for QT. Caution remains warranted.
 Source: Strategas. As of 9/12/22
Inflation Still Not Under Control… Rates going Higher!
The Fed will need to see several month-on-month inflation numbers annualizing to less than 3% before turning less hawkish and even thinking about a pause in rate hikes. For now, we are not remotely close. In addition to lower actual inflation, the Fed needs to see lower inflation expectations and a weaker labor market before pivoting.
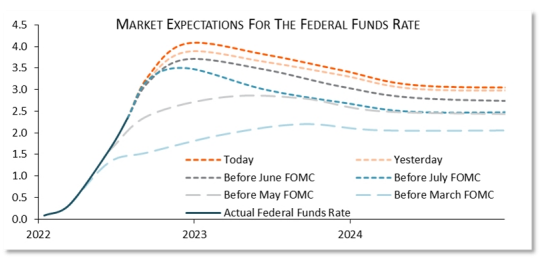
It’s very clear to at least the bond market that the Fed won’t turn less hawkish any time soon. The bond market expects the Fed to continue to raise rates, even at an aggressive pace, for at least the rest of the year—another 75-bp hike next week is priced in with certainty, with a chance of 100 bps.
In fact, as the chart below shows, expectations for rate hikes have moved up for the past several months despite misplaced narratives about a “pivot,” and today expectations for the peak rate are exceeding 4%. We think there is a plausible scenario we could see another 75bp hike in November followed by 50bps in December. This would put the funds rate at 4.5% at the end of the year… it doesn’t appear the equity market was expecting this!
 Source: PSC. As of 9/13/22
Disclosures
Past performance is not indicative of future results. This material is not financial advice or an offer to sell any product. The information contained herein should not be considered a recommendation to purchase or sell any particular security. Forward looking statements cannot be guaranteed.
This commentary offers generalized research, not personalized investment advice. It is for informational purposes only and does not constitute a complete description of our investment services or performance. Nothing in this commentary should be interpreted to state or imply that past results are an indication of future investment returns. All investments involve risk and unless otherwise stated, are not guaranteed. Be sure to consult with an investment & tax professional before implementing any investment strategy. Investing involves risk. Principal loss is possible.
Projections or other forward-looking statements regarding future financial performance of markets are only predictions and actual events or results may differ materially.
The Consumer Price Index (CPI) measures the change in prices paid by consumers for goods and services. The CPI reflects spending patterns for each of two population groups: all urban consumers and urban wage earners and clerical workers. The Core Consumer Price Index (CPI) measures the changes in the price of goods and services, excluding food and energy. The CPI measures price change from the perspective of the consumer. It is a key way to measure changes in purchasing trends and inflation.
The 2 Year Treasury Rate is the yield received for investing in a US government issued treasury security that has a maturity of 2 years.
The 10-2 Treasury Yield Spread is the difference between the 10-year treasury rate and the 2 year treasury rate. A 10-2 treasury spread that approaches 0 signifies a “flattening” yield curve. A negative 10-2 yield spread has historically been viewed as a precursor to a recessionary period.
Advisory services are offered through Aptus Capital Advisors, LLC, a Registered Investment Adviser registered with the Securities and Exchange Commission. Registration does not imply a certain level or skill or training. More information about the advisor, its investment strategies and objectives, is included in the firm’s Form ADV Part 2, which can be obtained, at no charge, by calling (251) 517-7198. Aptus Capital Advisors, LLC is headquartered in Fairhope, Alabama. ACA-2209-14.
