Tug of War: Goods vs Services Inflation
Goods inflation is rising because of tariffs, while the rise in services prices stabilizes.
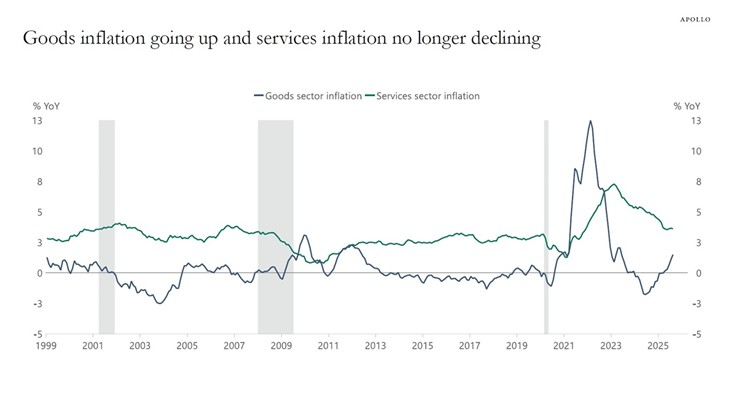
Source: Apollo. As of 9/22/25.
As a whole, 72% of CPI components are growing faster than the Fed’s 2% inflation target. Service inflation continues to linger above target. On top of that, there is certainly a risk of delayed impact from tariffs as companies try to push through price increases over next year.
Inflation continues to stay stubbornly above target (it’s been over the Fed’s target for >50 months), and it’s expected (per the Fed’s most recent SEP) to stay there until 2028. If that is the case, inflation will be above target for over 80 months. With inflation above target, seemingly for another 2-3 years, deep Fed cuts appear unlikely.
Inflation Picture
The graphic below shows market-based pricing for inflation swaps. In effect this is what the market expects CPI to average over various tenors.
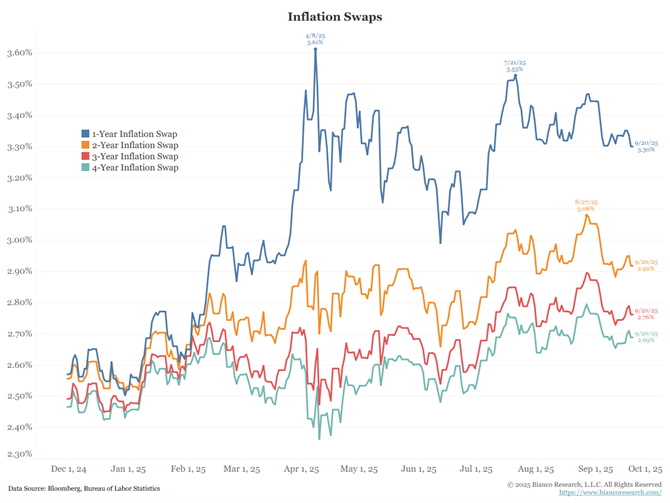
Source: Bianco. As of 9/22/25.
Short-term inflation swap rates are significantly elevated, while longer term inflation fears are only modestly above the Fed’s target. However, the market is still expecting inflation to be at least 2.7% (or higher) over the remainder of President Trump’s term. This level of inflation is likely to be unacceptable to the Fed.
- Over the next year (blue), CPI is expected to be 3.3%
- Over the next two years (orange), CPI is expected to be 2.92%
- Over the next three years (red), CPI is expected to be 2.76%
- Over the next four years (cyan), CPI is expected to be 2.69%
Checking Back in on Shelter Inflation
Owners’ equivalent rent (OER) should start to come down, with the historical relationship of home prices leading rents by 18 months.
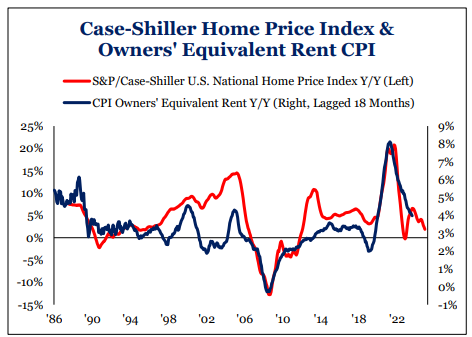
Source: Strategas. As of 9/22/25.
Given that OER comprises 30% of CPI, it is significant and should serve as a counterweight on inflation. The good news is we don’t see a big runaway risk to inflation. The bad news is it will be awhile before aggregate inflation comes back to the Fed’s target.
Thinking About the Fed’s Next Move(s)
A big question remains about where the neutral rate sits. This graphic looks at a few market-based indicators compared to what the Fed has penciled in. We think this can be helpful in “keeping the market honest” and restrain from getting overly optimistic in terms of rate cut expectations.

Source: Bianco. As of 9/22/25.
- The black line is the current federal funds rate target (mid-point). Currently, it is 4.13%.
- The orange line is the Fed’s long-term estimate from their dot plot. This is the Fed’s estimate of neutral, currently 3%.
- The green line is one market estimate of neutral from the swaps market. It is where the forward curve is pricing the 3-month rate in 18 months, currently 3.61%.
- The blue line is another market estimate of neutral from the fed funds futures market. It plots the lowest future rate, currently 2.97%.
The Fed appears to be erring on the side of growth. The committee is fairly well-aligned that the Fed can continue slowly lowering their policy rate (dots bunching together shows alignment). Based on last week’s Fed meeting, the data required to reverse course (i.e., not get at least 1-2 more cuts this year) is high. We would need to see substantial inflation and labor market strength. However, looking into next year, there is substantial uncertainty about the extent of further easing.
So here is where we sit. The labor market has slowed, which is a major concern to the Fed. However, inflation remains above target. The Fed has pivoted to worrying about their employment mandate and given recent weakness is inching their policy rate towards neutral (best guess is 3-3.5%). Inflation data specifically related to tariffs has spooked some Fed members into hesitating on the pace of cuts.
We think we’ll see more cuts than currently projected, if labor weakens further. The market is in this camp, pricing in more cuts than the Fed. On the other hand, if the data comes in hotter than expected, we will get fewer Fed cuts (especially in ‘26) and a repricing of the long end as cut expectations decline (i.e., 10-year yield higher).
The other risk is if the Fed overdoes the cuts, they risk reigniting the economy and inflation with further backdrop of stimulus from the One Big Beautiful Bill coming next year. Simply put, there are whipsaw risks involved with both scenarios but the end result likely leads to the same place: stickier long-term yields.
In light of the above, we would advise against typical playbook of buying duration into Fed cuts, especially if we do get the soft landing. It’s hard to see environment where 10-year rates fall durably below 3.5%.
Credit Spreads
Investment-grade credit spreads are tight, sitting at a 3-decade low of about 70 bps.

Source: TS Lombard. As of 9/24/25.
Prior periods of spread widening have been linked to financial instability concerns in the private sector: existing macro imbalances and/or growing leverage among corporates. History shows consistently that those are the primary sources of financial crisis, and major factors in precipitating serious recessions.
We see the current macro backdrop as radically different. Post-Global Financial Crisis (GFC), the private sector has spent years deleveraging balance sheets, with firms reluctant to take on debt even through the recovery phase. Broad-based private sector balance sheets have improved, lifting the quality of corporate bond indices. On the contrary, there has been much debt issuance coming from the public sector (i.e., governments).
Many investors have altered their duration preference following the fixed income debacle of 2022, ditching long duration USTs for shorter duration corporates. On the front end of the curve, corporates offer an attractive yield pick up relative to UST while also shortening duration profile (i.e., less interest rate risk). The bottom line is with improved corporate fundamentals and reduced volatility compared to longer duration government bonds, tight IG spreads don’t seem overwhelmingly concerning.
Disclosures
Past performance is not indicative of future results. This material is not financial advice or an offer to sell any product. The information contained herein should not be considered a recommendation to purchase or sell any particular security. Forward looking statements cannot be guaranteed.
This commentary offers generalized research, not personalized investment advice. It is for informational purposes only and does not constitute a complete description of our investment services or performance. Nothing in this commentary should be interpreted to state or imply that past results are an indication of future investment returns. All investments involve risk and unless otherwise stated, are not guaranteed. Be sure to consult with an investment & tax professional before implementing any investment strategy. Investing involves risk. Principal loss is possible.
Advisory services are offered through Aptus Capital Advisors, LLC, a Registered Investment Adviser registered with the Securities and Exchange Commission. Registration does not imply a certain level of skill or training. More information about the advisor, its investment strategies and objectives, is included in the firm’s Form ADV Part 2, which can be obtained, at no charge, by calling (251) 517-7198. Aptus Capital Advisors, LLC is headquartered in Fairhope, Alabama. ACA-2509-23.
