First, I really wanted to touch base after yesterday’s price decline across indices – it was the worst day since June 2020. I know that I have been saying for quite some time that the market will continue to remain volatile until it perceives that we have seen some signs of peak inflation – this continues to remain true. However, yesterday felt a little bit different.
It felt as if the market was finally starting to price in some sort of earnings decline. Retail stocks tend to lag the traditional earnings season by a few weeks, and here over the past few days, we’ve seen the likes of Walmart (WMT), Target (TGT), and Home Depot (HD) report earnings. On the first two, we saw considerable drops – in fact, it was WMT’s largest single day decline since 1987. What happened?
Let’s take a step back. We’ve continued to preach that all the market’s decline this year can be attributable to a compression in market multiples. We started the year at 21.5x forward P/E and we now sit ~16.5x forward P/E. This is just 10% higher than historical averages.
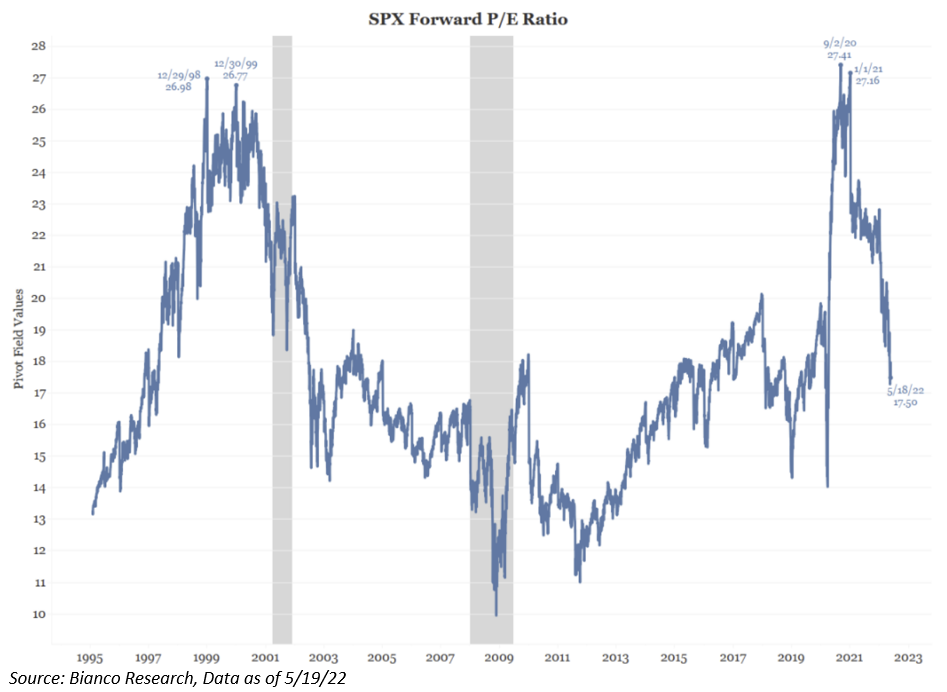
And if you’ve heard me talk lately, I’ve been warning on the case that the denominator of this multiple is becoming increasingly more and more important. Year-to-date, S&P 500 EPS expectations have continued to increase – approximately +9% since 12/31/21. The market has continued to price in optimism on the earnings front. What if we started to see some type of decline in earnings expectations through the remainder of the year?
Anecdotally, as we were working through earnings season, we witnessed a lot of companies decrease their Q2 guidance, while reaffirming full-year guidance. This tells me that management teams understand that demand and inflation will continue to persist through June, but they have no clue how to forecast this into the future. That is why we haven’t seen many analysts decrease their earnings expectations for the year thus far.
But over the last few days, it appears as if the market has started to do that for them. Yesterday’s decline felt as if the market was starting to recognize that earnings growth and S&P 500 profitability may be in jeopardy as inflation will continue to be higher throughout the year – specifically that China’s draconian “Zero-COVID” policy and its effect on the supply chain remains very apparent.
That’s why WMT / TGT / KSS earnings have been very important in the eyes of the market – it gives a (close) real-time look at the spending behaviors of consumers during this inflationary period. More importantly, the effect that higher prices at the gas pump has switched consumer’s spending habits. We’re going to keep watching this, as we’ll receive a few more retail reports over the next week.
Is the “Fed Put” Alive?
Finally, a question that we have received lately is about the “Fed Put”.
We continue to believe that the Fed Put is much lower right now, as FOMC Chairman Jerome Powell said at the WSJ Conference the other day that basically the Fed is going to keep raising until we have a recession unless inflation meaningfully improves.
Many have said that the Fed Put is dead – I don’t believe that – but I agree that it is MUCH lower than where we currently sit, with the S&P 500 at 3900. The size of the decline (i.e., the “strike” of the put) depends both on the level of inflation and how much stocks have appreciated in the recent past.
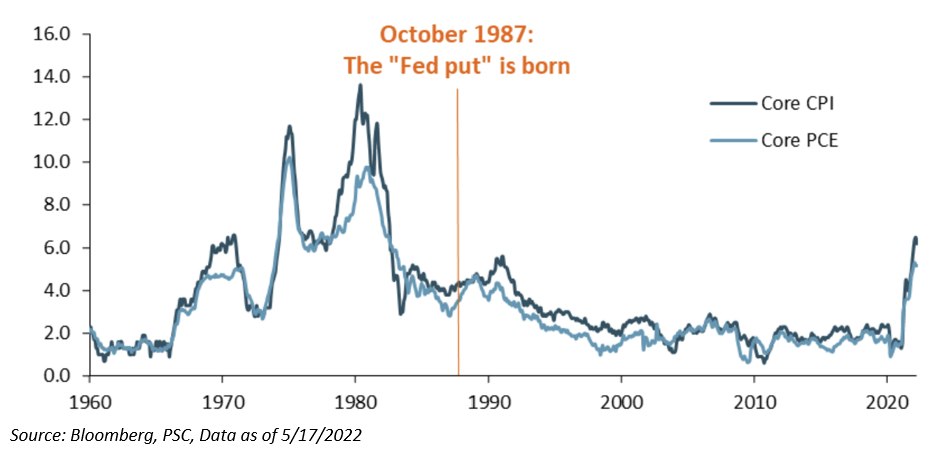
The cause of the decline is equally important. The Fed has a long history of easing policy in response to earnings drops, but there isn’t much evidence that it responds to multiple compression. The fact that inflation is higher than at any time since the genesis of the Fed Put, and that stocks have appreciated a lot over the past two years, suggest the strike is well below current prices.
Similarly, the recent decline in stock prices owes exclusively to lower multiples; it would take another leg down induced by a drop in earnings to impress the Fed. I don’t think what we witnessed from TGT and WMT this week will even jump start a conversation about turning dovish.
Bottom line, the Fed Put is alive, but it’s not even close to being activated.
Disclosures
Past performance is not indicative of future results. This material is not financial advice or an offer to sell any product. The information contained herein should not be considered a recommendation to purchase or sell any particular security. Forward looking statements cannot be guaranteed.
This commentary offers generalized research, not personalized investment advice. It is for informational purposes only and does not constitute a complete description of our investment services or performance. Nothing in this commentary should be interpreted to state or imply that past results are an indication of future investment returns. All investments involve risk and unless otherwise stated, are not guaranteed. Be sure to consult with an investment & tax professional before implementing any investment strategy. Investing involves risk. Principal loss is possible.
The S&P 500® Index is the Standard & Poor’s Composite Index and is widely regarded as a single gauge of large cap U.S. equities. It is market cap weighted and includes 500 leading companies, capturing approximately 80% coverage of available market capitalization.
Advisory services are offered through Aptus Capital Advisors, LLC, a Registered Investment Adviser registered with the Securities and Exchange Commission. Registration does not imply a certain level or skill or training. More information about the advisor, its investment strategies and objectives, is included in the firm’s Form ADV Part 2, which can be obtained, at no charge, by calling (251) 517-7198. Aptus Capital Advisors, LLC is headquartered in Fairhope, Alabama. ACA-2205-18.
