The Federal Open Market Committee (FOMC) has the ability to set interest rates through the Fed Funds rate – the overnight lending rate among US banks. Banks are required to retain a certain amount in deposits as capital to help guarantee their solvency. Bank deposits ebb and flow daily, so do loan balances at any given time. The possibility for a resulting shortfall in capital compared to what is required by regulators creates the necessity for overnight lending by the bank; on the flip side, a bank that finds themselves temporarily overcapitalized would be encouraged to lend out excess capital to other banks in order to earn a return on that idle cash.
The Fed Funds rate provides a reference for institutions to guide such lending. It is chiefly through this mechanism that the Federal Reserve, commonly referred to as “the Fed,” seeks to control its dual mandate designated by Congress – achieving price stability and maximum employment. By changing this overnight lending rate, the price of money becomes more restrictive or more relaxed, which has a direct impact on monetary supply. The flow-through dictates what banks charge on loans they give and deposits they pay to customers, influencing behaviors in the greater economy.
 Data as of 11.21.22
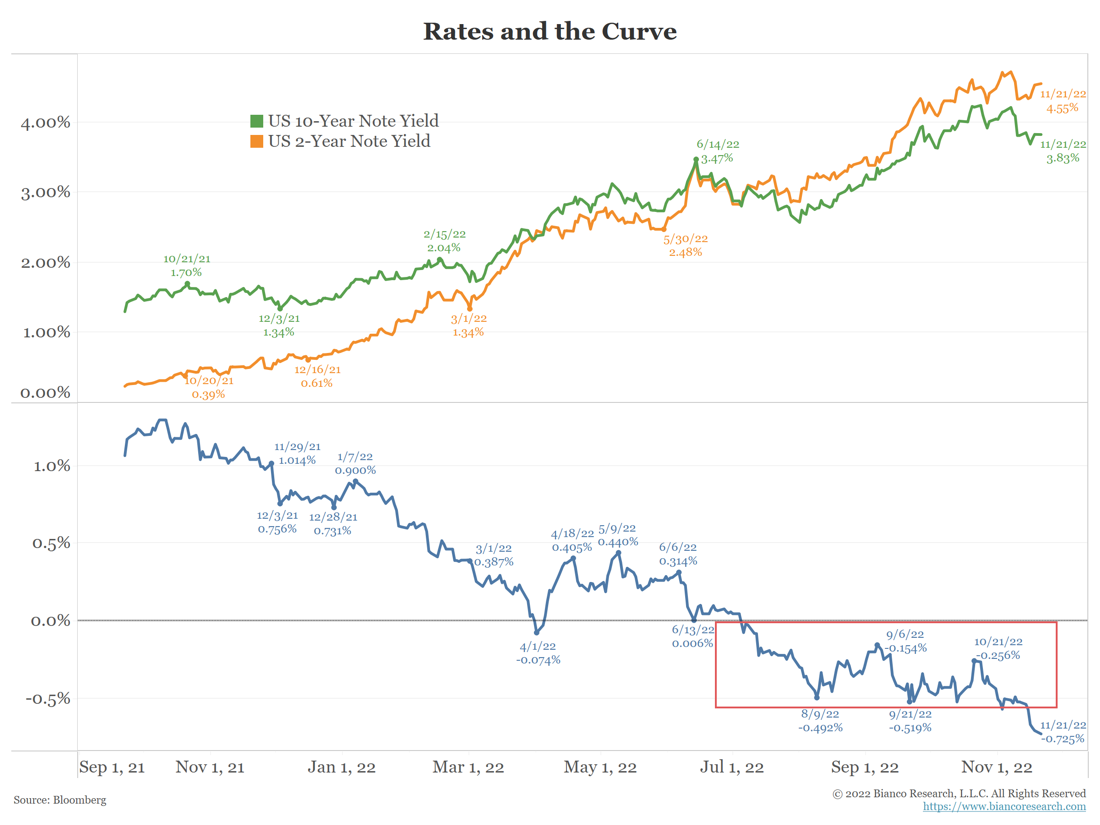
The US Treasury issues debt in many different increments and maturities to fund its activities. Perhaps the most widely followed issue is the 10-year Treasury Note, in part because it is the leading proxy for mortgage debt. Unlike the Fed Funds rate, this rate is dictated by the market. With that said, it would be incorrect to say that the Fed has no influence on this rate. In one sense, the 10-year rate equals the average expected Fed Funds rate over the next ten years, plus a term premium (additional yield to compensate investors for locking funds for ten years vs overnight). But more important for this daily moving rate are future economic expectations – how will the US economy act over the next ten years as reflected by GDP output? As a corollary, when risk sentiment diminishes, investors often flock to the safety of government notes, driving prices higher and yields lower.
What Effect Has The Behavior of These Rates Had on the Equity Markets?
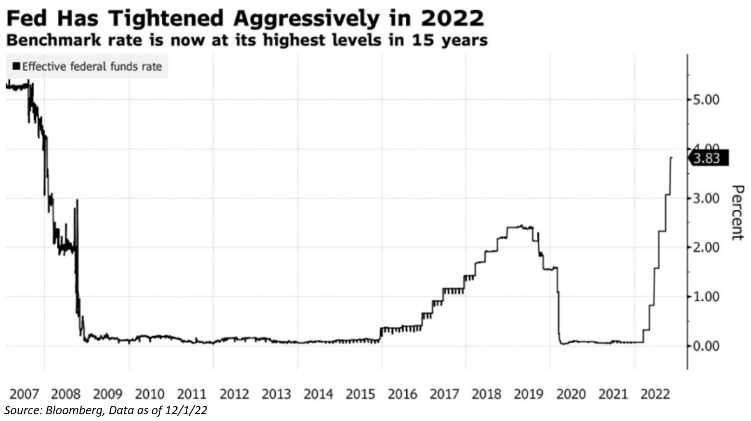
At the beginning of the year, the Fed Funds rate was targeted at 0-0.25% and the 10-year note was at 1.51%. At that time, the Fed was still vocalizing the narrative that rapidly increasing inflation was transitory – in other words, that supply-side disruptions caused by the COVID lockdowns would eventually fix themselves, naturally alleviating elevated pricing levels. By March, they had more or less abandoned that line of thinking, acknowledging that historic increases in the money supply (driven by their own actions in conjunction with massive stimulus payments from the federal government during COVID) were fueling consumer demand in conjunction with said supply-side disruptions. That led to a 25-basis point increase in the Fed Funds rate, the first of seventeen (17!) such increases absorbed by the market through the most recent Fed meeting on December 14, where it currently sits at 4.25-4.5%.
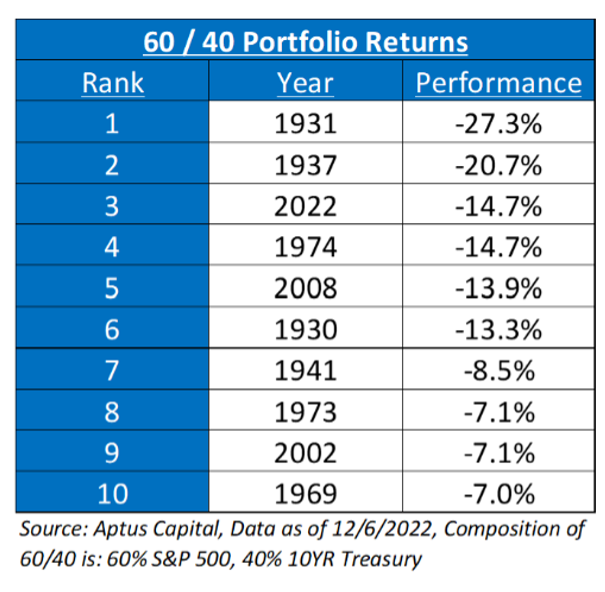
Every rate increase came with further guidance from the Fed that additional increases were likely warranted, leading the markets to continually reprice expectations for where interest rates would eventually settle. As we said earlier, the 10-year Note doesn’t act in a vacuum – it has some correlation to the Fed Funds rate and can’t stay still in an environment such as that where the overnight rate is rising at such an aggressive clip. It peaked in October at 4.24% and currently resides at 3.59%. The high-velocity spike in interest rates this year has been the reason for both equity and bond performance. Higher rates have hurt longer duration fixed income investments, as reinvestment risk is introduced. For equities, higher rates mean a higher discount rate, compressing valuations. In our opinion, rates have been driving the market’s performance all year, and may not likely change in the interim.
Why Would the 10-Year Rate Go Down While the Fed Funds Rate Continues to Go Up?
The answer ties in to the economic output driver of the 10-year rate; simply put, the market believes that the actions taken by the Fed in raising overnight interest rates to quell inflation will have an adverse impact on economic growth over the long-term. This shows itself in what is known as a yield curve inversion. The yield curve is simply a graphical depiction of each interest rate by maturity. Typically, shorter maturities pay lower interest rates than longer maturities, for the simple reason of term premium discussed earlier.
But in a yield curve inversion, near-term maturities (taking the 3-month treasury bill, as an example) yield a higher rate than long-term maturities. In the present case, the 3-month / 10-year inversion is at -67 basis points. This is statistically significant, as yield curve inversions, especially at the 3-month / 10-year comparison, have historically been leading indicators of economic recessions.
What Does This Mean for 2023?
With an inversion of this extremity, the market is telling the Fed that they cannot go on maintaining short-term interest rates at these levels, much less continuing to hike further. By the market’s projection, the pain in doing so will be great to the domestic economy, eventually ending in recession. The Fed, however, has been vocal that they are willing to risk a recession in order to get inflation down to target. We could then see an ensuing rise in unemployment and continued headwinds in the markets.
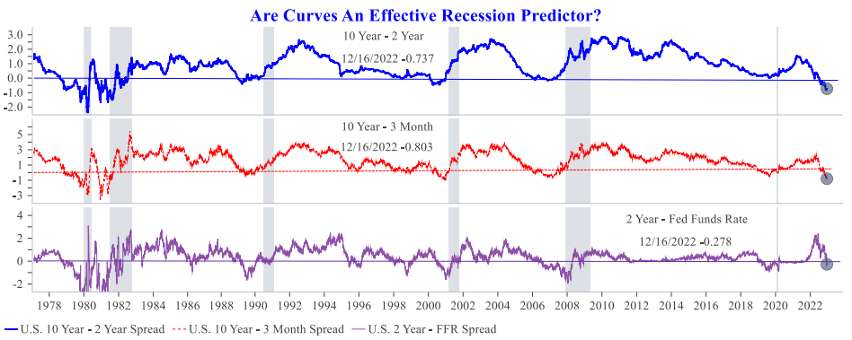 Source: Strategas as of 12/16/2022
Ultimately, there are only two ways to lower inflation – increase supply or decrease demand. Since the supply side is out of their hands, decreasing demand through increasing the cost of money is all they can do, and it is what they are determined to do. While many market prognosticators are hoping for a “soft landing,” (a coincident softening of inflation without the commiserate deterioration of economic conditions), it is more likely that history will ring true and this inversion will signal yet another recession, however mild. In such a case concerning dual decreases in inflation and economic activity, company earnings would almost certainly have to follow suit, bringing the equity market lower in turn.
In Summary
The Federal Reserve is in the driver’s seat, and this year has been a great illustration of the importance of their job and how interest rates can impact both stocks and bonds. While we remain cautious on the markets, there is a silver lining for long-term investors. Throughout the year, the market has had a reset not just on valuations, which entered the year at 21.5x forward earnings and now at 16.4x (as of 12.19.22), but also on interest rates not seen since 2007.
Fixed income broadly offers more attractive risk/reward as rates have increased. Historically, yield has contributed 36% of total return. Yet, in the 2010s, it only contributed 14%. We see this changing going forward and believe that embracing this new yield environment within both your equity and bond allocations will support any muted growth in 2023.
We understand this is a lot to consume, so please leverage our team as a resource to think through managing risk and positioning as we navigate your plan.
Disclosures
Past performance is not indicative of future results. This material is not financial advice or an offer to sell any product. The information contained herein should not be considered a recommendation to purchase or sell any particular security. Forward looking statements cannot be guaranteed.
This commentary offers generalized research, not personalized investment advice. It is for informational purposes only and does not constitute a complete description of our investment services or performance. Nothing in this commentary should be interpreted to state or imply that past results are an indication of future investment returns. All investments involve risk and unless otherwise stated, are not guaranteed. Be sure to consult with an investment & tax professional before implementing any investment strategy. Investing involves risk. Principal loss is possible.
The 10-year Treasury Note is a debt obligation issued by the United States government with a maturity of 10 years upon initial issuance. A 10-year Treasury note pays interest at a fixed rate once every six months and pays the face value to the holder at maturity.
The 10-2 Treasury Yield Spread is the difference between the 10-year treasury rate and the 2 year treasury rate. A 10-2 treasury spread that approaches 0 signifies a “flattening” yield curve. A negative 10-2 yield spread has historically been viewed as a precursor to a recessionary period.
The 10 Year-3 Month Treasury Yield Spread is the difference between the 10 year treasury rate and the 3 month treasury rate. This spread is widely used as a gauge to study the yield curve. A 10 year-3 month treasury spread that approaches 0 signifies a “flattening” yield curve.
The content and/or when a page is marked “Advisor Use Only” or “For Institutional Use”, the content is only intended for financial advisors, consultants, or existing and prospective institutional investors of Aptus. These materials have not been written or approved for a retail audience or use in mind and should not be distributed to retail investors. Any distribution to retail investors by a registered investment adviser may violate the new Marketing Rule under the Investment Advisers Act. If you choose to utilize or cite material, we recommend the citation be presented in context, with similar footnotes in the material and appropriate sourcing to Aptus and/or any other author or source references. This is notwithstanding any considerations or customizations with regards to your operations, based on your own compliance process, and compliance review with the marketing rule effective November 4, 2022.
Advisory services are offered through Aptus Capital Advisors, LLC, a Registered Investment Adviser registered with the Securities and Exchange Commission. Registration does not imply a certain level or skill or training. More information about the advisor, its investment strategies and objectives, is included in the firm’s Form ADV Part 2, which can be obtained, at no charge, by calling (251) 517-7198. Aptus Capital Advisors, LLC is headquartered in Fairhope, Alabama. ACA-2212-24.
