
I rarely share other people’s charts in these posts. This one is too good not to share.
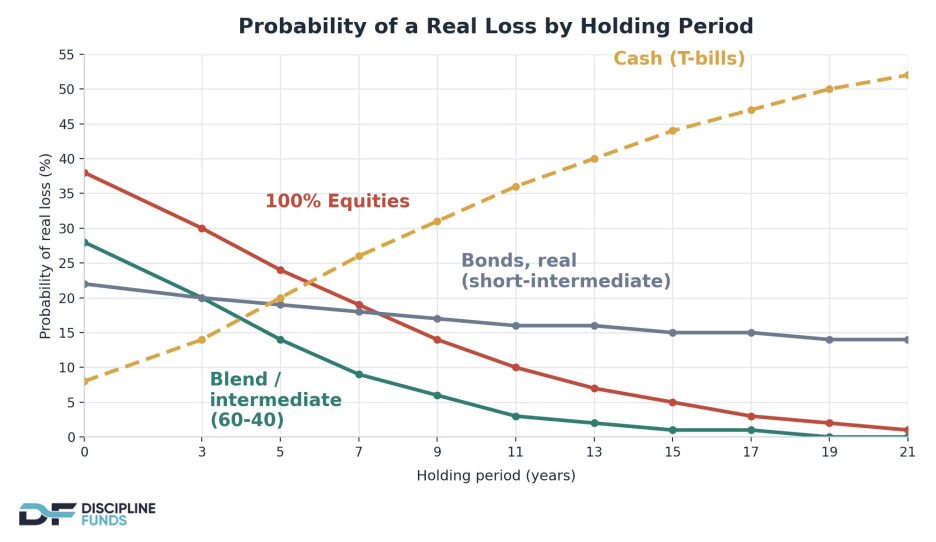 Chart source: Cullen Roche, Discipline Funds 07.15.2026
Ask most investors to rank assets by risk, and you will get the same answer.
1. Cash is safe
2. Bonds are safer than stocks
3. Stocks are risky
That ranking is clearly correct on one measure: short-term volatility.
It is wrong on the measure that determines whether a portfolio succeeds: long-term purchasing power.
The chart makes the point cleanly. It shows the historical probability of a real loss, meaning a loss after inflation, across different holding periods.
The Ranking Flips
Look at the starting point. Over very short horizons, the conventional wisdom holds. A 100% equity portfolio has carried roughly a 38% chance of a real loss over short holding periods. Cash sits near 8%.
Stocks are the risky asset. Cash is the safe one.
Now follow the lines out.
By roughly year 5 to 6, the lines cross. Beyond that point, cash is the riskier asset in real terms and the gap only widens. At a 20-year horizon, the historical probability of a real loss in equities falls to roughly 1%. For cash, it rises to roughly 50%. The “safest” asset on the risk questionnaire becomes a coin flip against inflation over a generation.
The 60/40 blend tells a similar story. It starts at roughly a 28% probability of real loss and grinds toward 0% by year 20. Short and intermediate bonds have improved more slowly, flattening out near 14% (yet are highly dependent on yield). They never get much better than that, because their real return is structurally thin. Taxes (not shown here) make that math much worse.
Risk Is Not One Number
We believe this is the key distinction most portfolios miss. Risk changes with time horizon. Short-term volatility gets all the attention because it is visible, quotable, and uncomfortable. Long-term purchasing power is what determines whether an allocation actually funds the goal it was built for.
An asset is not safe or risky in the abstract. It is safe or risky relative to a liability.
Cash is a genuinely safe asset for a bill due in 6 months. It is a genuinely dangerous asset for a retirement that is 20 years away. Same instrument, opposite risk profile. The only thing that changed is the horizon.
This is why we believe portfolio construction should start with matching assets to the appropriate time horizon rather than with a volatility score. A portfolio built to minimize short-term fluctuation is often maximizing the probability of long-term failure. That is not conservatism. It is just moving the risk somewhere the statement doesn’t show it.
3 takeaways from the chart:
-
- Volatility is the price of admission, not the risk: Equities are the most volatile asset on the chart and the least likely to produce a real loss over 15+ years.
-
- Cash and short bonds are horizon-specific tools: They belong against near-term liabilities. Held against long-term liabilities, they quietly compound a shortfall.
-
- Time in the market changes the distribution, not just the average: Diversified equity exposure historically converts from a 4-in-10 chance of real loss to a near-0 chance as the holding period extends. Few risk conversations with clients start there. We believe they should.
None of this argues for ignoring volatility. Sequence risk is real, and investors have to survive the short run to reach the long run. It argues for defining risk correctly first, then structuring around it. The question is never “how much can this portfolio move?” The question is “what is the probability this portfolio fails to fund the liability it exists for?”
The Menu Is Bigger Than the Chart
One caveat. The analysis is great, but it only includes traditional asset classes. Stocks, bonds, cash, and blends of the three. That was the full menu for most of market history. It isn’t anymore.
Hedged equity and other alternative strategies are now easily accessible in liquid, transparent, tax-efficient structures. That changes the picture. The chart frames the investor’s choice as a hard tradeoff: accept short-term drawdown risk to reduce long-term purchasing power risk… or the reverse. Hedged equity exists to soften that tradeoff. It aims to keep the portfolio anchored to the asset class with the best long-term real return profile, and address the short-run drawdowns that push investors toward cash and bonds in the first place.
We believe this matters because the biggest risk on the chart is behavioral. Investors don’t abandon equities because of the 20-year numbers. They abandon them in year one. Structures that make equity exposure more survivable in the short run make the long-run probabilities on this chart actually attainable, rather than theoretical. We believe an allocator matching assets to liabilities in 2026 has more ways to hold the long-horizon line than the four on this chart.
On the core question, though, the chart speaks for itself.
Disclosures
Past performance is not indicative of future results. This material is not financial advice or an offer to sell any product. The information contained herein should not be considered a recommendation to purchase or sell any particular security. Forward looking statements cannot be guaranteed. Hypothetical examples are for illustrative purposes only, do not reflect the deduction of fees or expenses, and are not indicative of any actual investment result.
This commentary offers generalized research, not personalized investment advice. It is for informational purposes only and does not constitute a complete description of our investment services or performance. Nothing in this commentary should be interpreted to state or imply that past results are an indication of future investment returns. All investments involve risk and unless otherwise stated, are not guaranteed. Be sure to consult with an investment & tax professional before implementing any investment strategy. Investing involves risk. Principal loss is possible.
Advisory services are offered through Aptus Capital Advisors, LLC, a Registered Investment Adviser registered with the Securities and Exchange Commission. Registration does not imply a certain level of skill or training. More information about the advisor, its investment strategies and objectives, is included in the firm’s Form ADV Part 2, which can be obtained, at no charge, by calling (251) 517-7198. Aptus Capital Advisors, LLC is headquartered in Fairhope, Alabama. ACA 2607-24.