Funds such as SCHP/TIP own actual TIPS and track their performance. Despite all of the ongoing chatter about inflation and quasi hysteria in the media about the Fed falling behind the curve in recent months, the bond market (being the smart market that it is) has been pricing in inflation since the start of 2019. The trend accelerated coming out of the initial pandemic shock given all the stimulus money being pumped into the economy, and that sent 5-Yr TIPS yields decidedly negative, pushing – 2.00% at the lows.
Since the economy began to stabilize in early 2021 and investors started to see the light at the end of the “COVID tunnel,” 5-Yr TIPS yields turned sideways (still in very negative territory) as investors remained concerned about inflation, thinking that the Fed was likely falling behind the curve given the rocky and uneven recovery in the labor market. As a result, real rates chopped sideways in very negative territory for much of 2021 while nominal rates steadily climbed higher. This resulted in market- based inflation expectations via 5-Yr breakeven to rise, peaking at just over 3% in November. Once the Fed took a more hawkish pivot in December, however, 5-Yr TIPS yields began to climb and recently reached new one- year highs as the market gained confidence that the Fed would, and could, control inflation given the hawkish shift in tone. Underscoring that point, the 5-Yr Breakeven inflation rate has pulled back by 40-50 basis points to the mid-2.70% zone, which is still above the Fed’s target but notably below the highs.
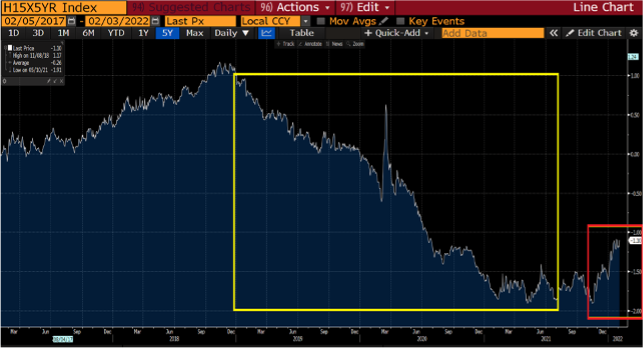
5-yr Real Yields. Source. Bloomberg LP. As of 2/4/21.
So, over the last month, the market has actually become less concerned with the Fed’s ability to control inflation which led to profit taking in inflation protected investments and a rise in TIPS yields, hence the negative YTD return for funds such as VTIP. The chart above offers a good visual of the 5-Yr TIPS yield with the yellow square encompassing the increased demand for inflation protection via TIPS beginning in 2019 while the red square shows the recent profit taking and the market’s vote of confidence that the Fed will be successful in containing inflation.
It’s also worth noting that TIPS are longer duration vehicles, so they have been double-whacked by real yields rising (especially on the front end) and long end rates moving upward.
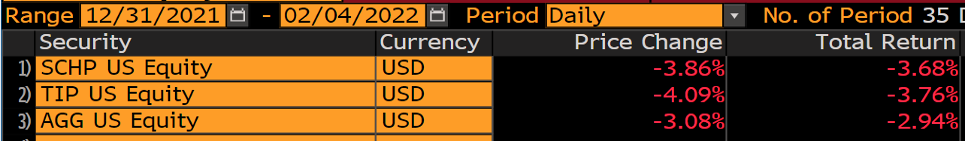
Source. Bloomberg LP. As of 2/4/21.
Disclosures
Past performance is not indicative of future results. This material is not financial advice or an offer to sell any product. The information contained herein should not be considered a recommendation to purchase or sell any particular security. Forward looking statements cannot be guaranteed.
This commentary offers generalized research, not personalized investment advice. It is for informational purposes only and does not constitute a complete description of our investment services or performance. Nothing in this commentary should be interpreted to state or imply that past results are an indication of future investment returns. All investments involve risk and unless otherwise stated, are not guaranteed. Be sure to consult with an investment & tax professional before implementing any investment strategy. Investing involves risk. Principal loss is possible.
Advisory services offered through Aptus Capital Advisors, LLC, a Registered Investment Adviser registered with the Securities and Exchange Commission. Registration does not imply a certain level or skill or training. More information about the advisor, its investment strategies and objectives, is included in the firm’s Form ADV Part 2, which can be obtained, at no charge, by calling (251) 517-7198. Aptus Capital Advisors, LLC is headquartered in Fairhope, Alabama. ACA-2202-7.
