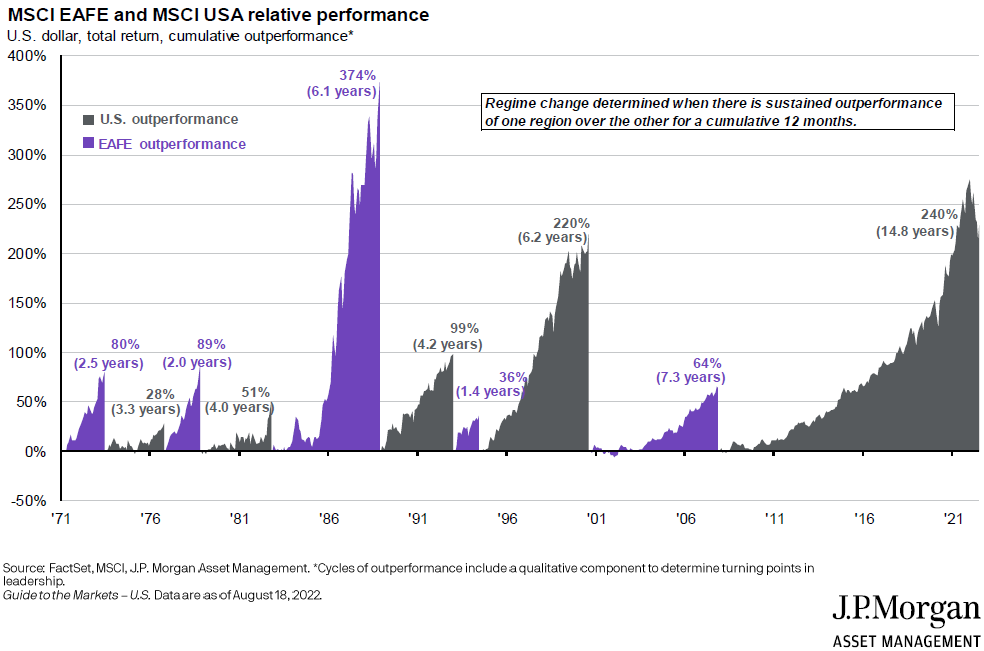
Why do we own international stocks? This is one of the most common questions we receive from advisors. Who can blame them? We are nearly 15 years into a regime in which US equities have outperformed international equities. You read that correctly – 15 years of US equity domination relative to international – the longest such duration for either group since MSCI started tracking Developed International stocks through the MSCI EAFE Index in 1970.
The chart below shows you this isn’t the largest period of relative outperformance; that was in a much shorter period back in the 1980s in which the MSCI EAFE outperformed the MSCI US by a whopping 374% in just over six years (you think people were questioning if they should eliminate their international exposure then?). The chart also shows that relative performance waxes and wanes, but the last 15 years have been an incredible period of relative performance for US equities.
In this writeup, we are going to dive into this question. Should we own international? We will try to show you why you should not only own international stocks but also look to figure out the optimal weight at which to allocate to them in strategic allocation portfolios.
Setting the Stage
Let’s first look at the performance from several indices that cover US and International equities. It is easy to see that US equities have had a much better run over the last 50 years. In fact, they have quite literally outperformed over every period shown. Case closed, right? Not quite.
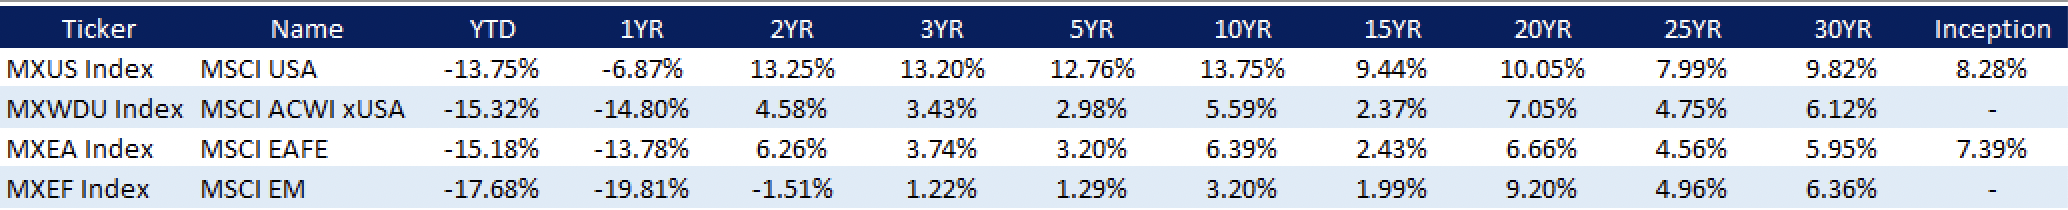 Source: Bloomberg/Aptus research. As of 07.31.22. Data from 12.31.1969 to 07.31.22
Running these same returns on 11/30/2007, almost fifteen years ago, the MSCI US Index since inception returned 7.84% per annum and the MSCI EAFE Index would have been 9.48% per annum. The last 15 years have really flipped the script in the allocation debate as the lackluster returns have worn down the patience of investors.
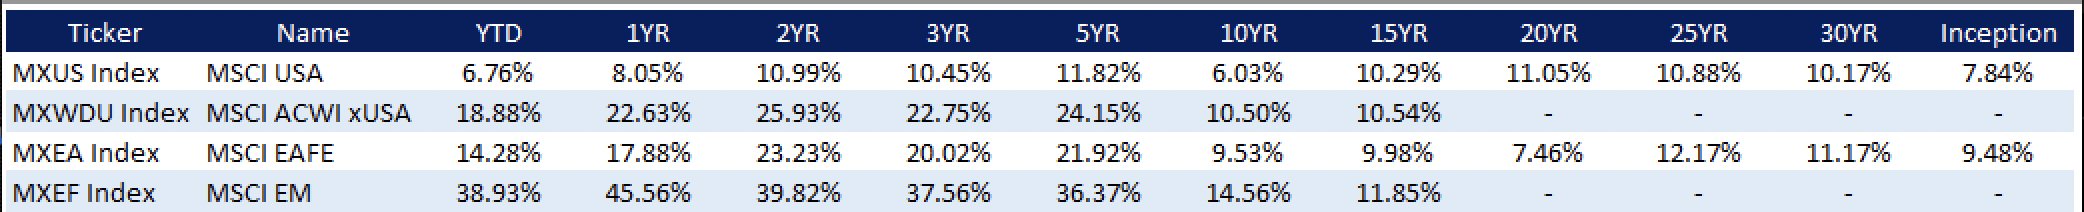 Source: Bloomberg/Aptus research. As of 11.30.07. Data from 12.31.1969 to 11.30.2007
What Changed?
We would be remiss to not review the last 15 years first. After all, it has been a key driver in the disparity between returns of US and International stocks. We feel that analyzing this period is imperative to see if there has been a structural shift in US equities that would lead one to conclude that this trend will continue. The data here will be imperative in the confidence an investor can have in an international equity allocation. If the data suggests that there has been a structural change between the two asset classes, it will change the way we look at forward-looking data.
Quality: Has there been a major separation in the relative quality of companies over the last 15 years? The charts below look at relative metrics of the MSCI US Index and MSCI ACWI EX-US Index. To measure quality, we used Return on Assets (“ROA”), Return on Capital (“ROC”), Return on Equity (“ROE”) and EBITDA Margins. Reviewing the data, it does not appear that there has been a major shift in relative quality. In fact, relative EBITDA margins have fallen over the period and the other metrics have remained somewhat constant.
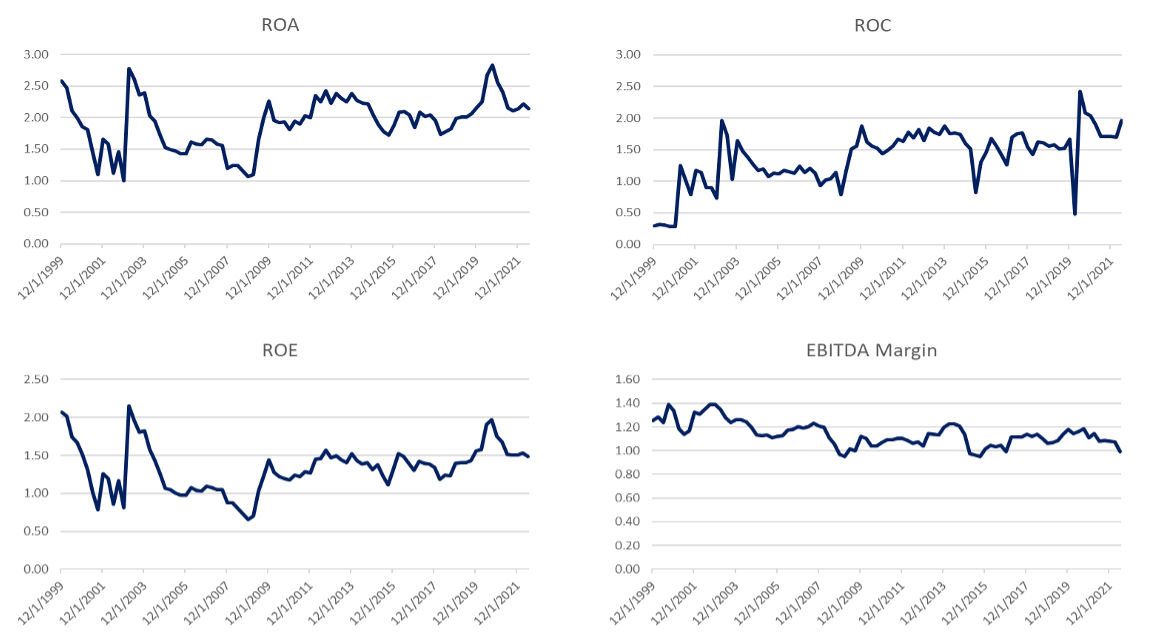 Source: Bloomberg/Aptus research. Calculated using quarterly data and looking at the MXUS Index relative to MXWDU Index from 12.31.1999-6.30.2022
Growth: Has there been a major separation in growth over the last 15 years? The charts below look at different growth metrics. All are calculated using rolling 3-YR CAGRs. While US growth has been more consistent and, in most cases, higher, we find it hard to believe that this is the main driving force behind the performance disparity given there is not a stark contrast between the two.
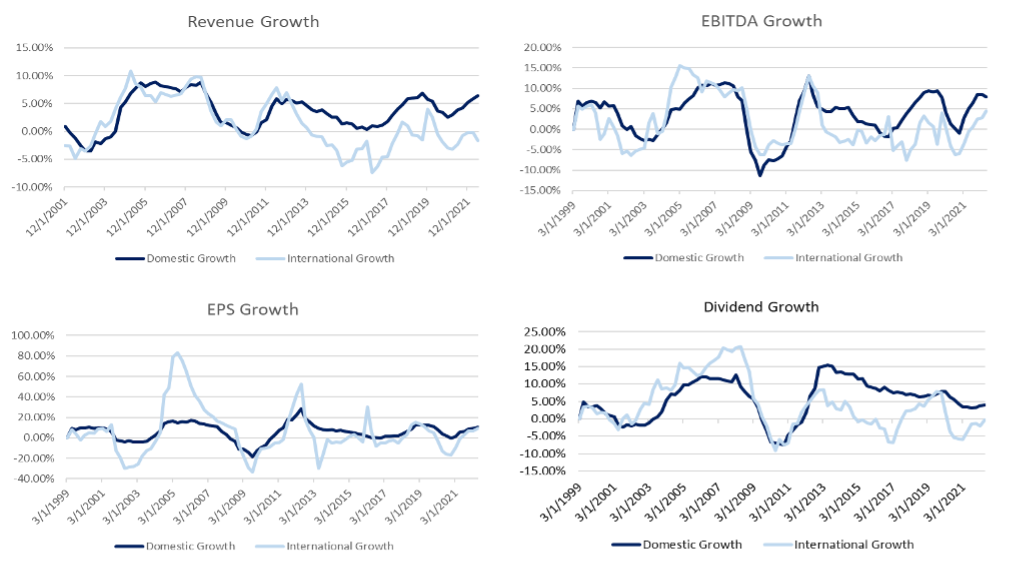 Source: Bloomberg/Aptus research. Calculated rolling 3-Year CAGR’s for the MXUS Index relative to MXWDU Index from 12.31.1999-6.30.2022
Valuation: Has there been a shift in valuations over the 15 years? This appears to be the major culprit. Relative valuations across the board have continued to rise and until recently were at, or near, their all-time highs. Relative valuations are unlikely to expand forever!
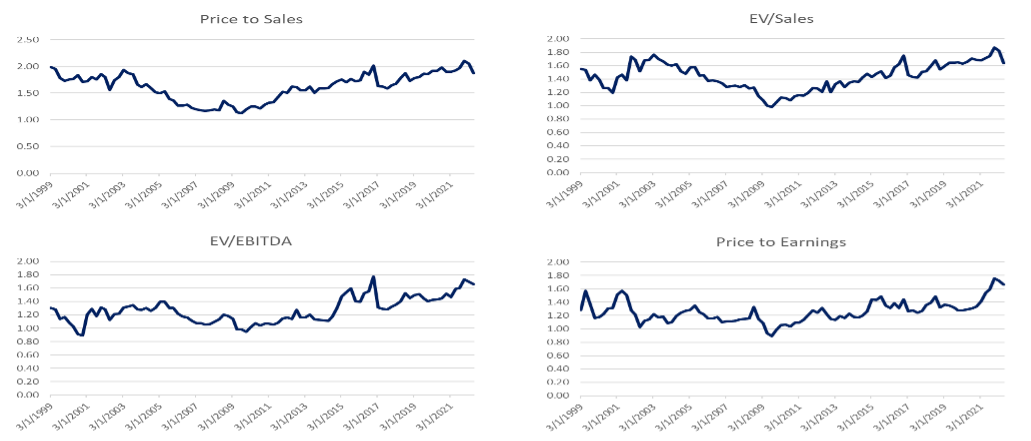
Source: Bloomberg/Aptus research. Calculated using quarterly data and looking at the MXUS Index relative to MXWDU Index from 12.31.1999-6.30.2022
Optimal Weight
Now that we have found that there hasn’t been a structural shift in quality or growth long-term, and the biggest driver of the performance disparity over the last 15 years has been relative valuations, we think it’s appropriate to assume that international equities do have a place in portfolios. Let’s explore how much of an allocation makes sense. We will first do this by looking at benchmark weights, followed by the weightings that have historically optimized Sharpe ratios.
Benchmark
We feel a logical place to begin is to look at benchmarks. Most investors will look to use a globally diversified market-cap weighted equity portfolio. For the sake of this writing, we’ll use the MSCI ACWI Index. As of 6/30/22, the US makes up just under 62% of the index – meaning 38% of the index is international equities.

If you’re looking to minimize your benchmark risk – the logical starting point for your international exposure in your portfolios is 38%. However, this may not be the optimal positioning in a strategic allocation.
1970-2007
It all depends on when your data starts and stops, right? 1970 is the start date of MSCI Index data so we will use this as our starting point. Data prior to the MSCI ACWI ex-US Index (pre-1988) is completed using the MSCI EAFE Index. The numbers in the table show the mix of MSCI US and MSCI ACWI ex-US (using the method described above). The top row shows the splits, with the first number being the weight in US equities and the number following the slash the weight in international equities, rebalanced monthly. If you ran this analysis at the end of November 2007, the numbers look much different than they do through July 2022. A 15-year run of outperformance to the magnitude that we have seen unsurprisingly changes those numbers. The table shows that through 2007, the maximized Sharpe ratios would be between about 30-40% in US equities and 60-70% in international equities. Who would have thought that?!
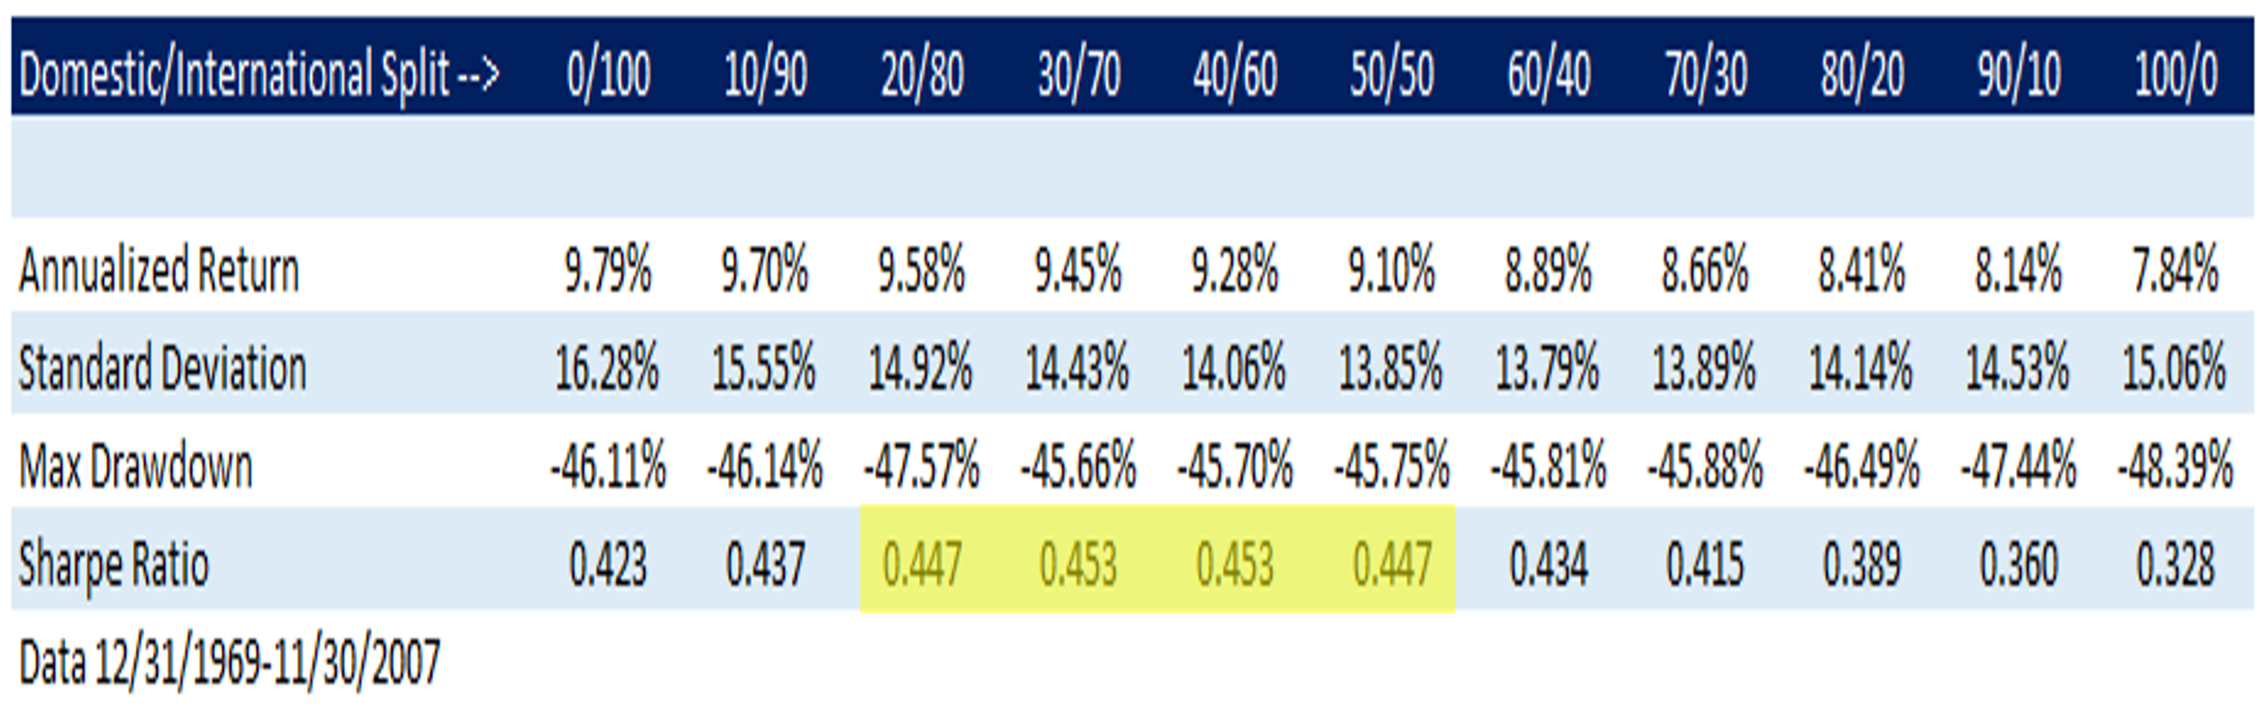 Source: Bloomberg/Aptus Research
1970-2022
Now we will extend the study through July 2020. The numbers change markedly (no surprises there). We can see that the Sharpe ratio over this period is maximized at 70% in the US and 30% internationally and relatively close in the 60/40 and 80/20 range. This is a major shift in just 15 years – but makes sense considering the prolific run that US equities have had relative to international equities.
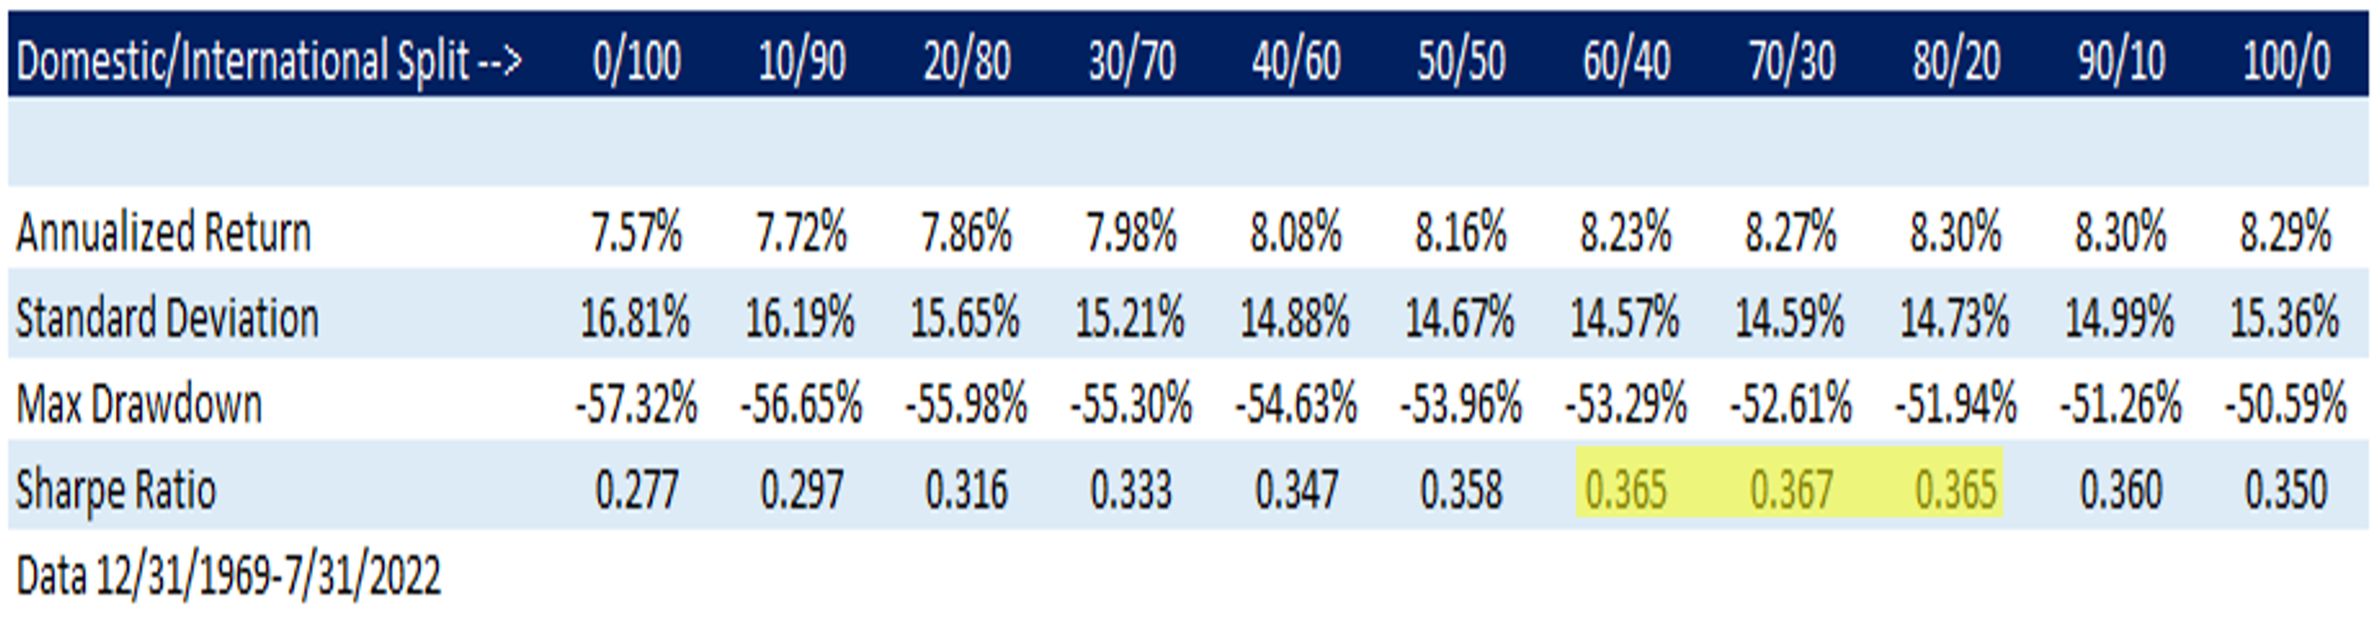 Source: Bloomberg/Aptus Research
Final Thoughts
Why do we own international stocks? Simply put, we think owning international equities helps to meet our mandate: to maximize risk-adjusted returns. The last 15 years have worn thin the patience of even the most ardent international equity advocates, as well as advisors who likely have had to explain to clients why they have owned an asset class that has consistently underperformed. We must remember that while this is the longest such period of relative outperformance, there have been other periods when international returns have dominated domestic.
We believe there will always be a place for international equities in strategic portfolio allocations. There has not been a structural shift in the relative quality or growth between domestic and international stocks – we showed this by looking at the last 20+ years of trailing metrics. The biggest driver in the performance disparity over the last 15 years has been valuation change. We know that relative valuations cannot expand forever, but do not know when we will see a reversal of this trend.
When looking to find the optimal weight, it takes a balanced approach of reviewing one’s benchmark and historical data and then using that information to combat behavioral biases that lead to too high a domestic equity allocation. Our studies show the the optimal strategic allocation to maximize Sharpe ratio over the last 50+ years has been a 70/30 domestic/international split. We don’t know if this will be the best mix moving forward but think that using history as a guide is a great place to start.
Disclosures
Past performance is not indicative of future results. This material is not financial advice or an offer to sell any product. The information contained herein should not be considered a recommendation to purchase or sell any particular security. Forward looking statements cannot be guaranteed.
This commentary offers generalized research, not personalized investment advice. It is for informational purposes only and does not constitute a complete description of our investment services or performance. Nothing in this commentary should be interpreted to state or imply that past results are an indication of future investment returns. All investments involve risk and unless otherwise stated, are not guaranteed. Be sure to consult with an investment & tax professional before implementing any investment strategy. Investing involves risk. Principal loss is possible. The MSCI USA Index is designed to measure the performance of the large and mid-cap segments of the US market. With 628 constituents, the index covers approximately 85% of the free float-adjusted market capitalization in the US.
The MSCI ACWI ex USA Index captures large and mid-cap representation across 22 of 23 Developed Markets (DM) countries (excluding the US) and 24 Emerging Markets (EM) countries. With 2,270 constituents, the index covers approximately 85% of the global equity opportunity set outside the US.
The MSCI EAFE Index is an equity index which captures large and mid-cap representation across 21 Developed Markets countries around the world, excluding the US and Canada. With 800 constituents, the index covers approximately 85% of the free float-adjusted market capitalization in each country.
The MSCI Emerging Markets Index captures large and mid-cap representation across 24 Emerging Markets (EM) countries. With 1,382 constituents, the index covers approximately 85% of the free float-adjusted market capitalization in each country.
Advisory services are offered through Aptus Capital Advisors, LLC, a Registered Investment Adviser registered with the Securities and Exchange Commission. Registration does not imply a certain level or skill or training. More information about the advisor, its investment strategies and objectives, is included in the firm’s Form ADV Part 2, which can be obtained, at no charge, by calling (251) 517-7198. Aptus Capital Advisors, LLC is headquartered in Fairhope, Alabama. ACA-2209-18.
