Real Rates… Was the Post-GFC Period the Anomaly?
The current real rate (interest rate adjusted for inflation) sits around 2.93%, which is the highest level since 2007. However, the post-financial crisis real rate period, shown in red, was not a “normal” period. During the QE period from 2009 to 2020, real rates averaged -1.08%.
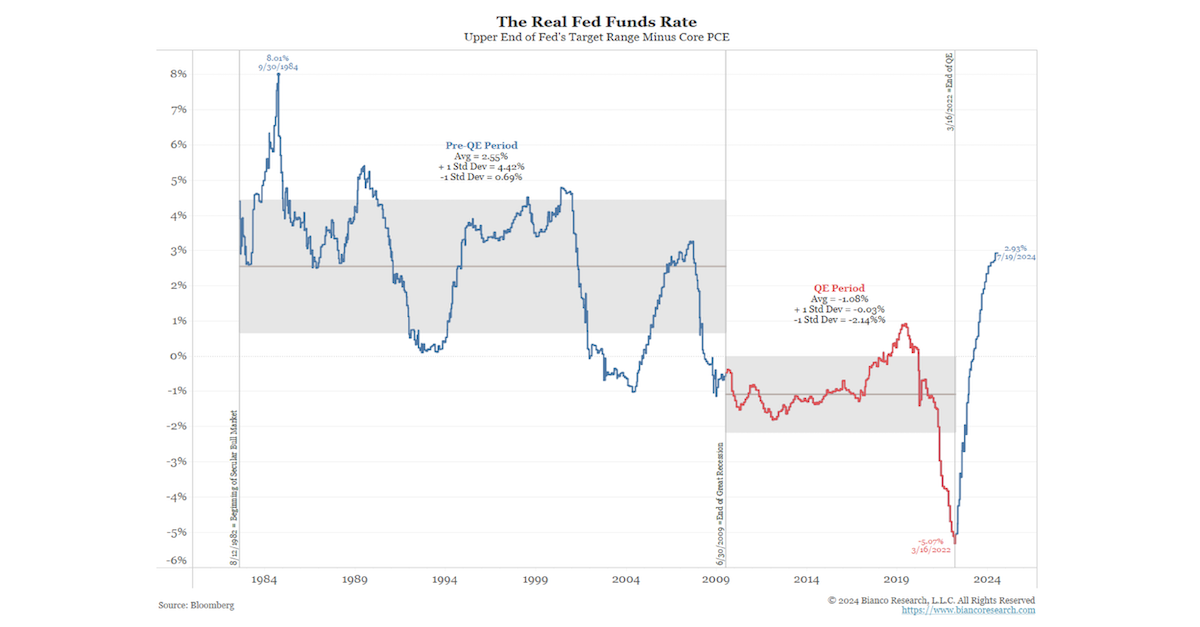 Source: Bianco as of 07.23.2024
That said, from 1982, the start of the bond bull market, to 2007, real rates averaged 2.55%, not too dissimilar from current levels. We believe the QE period was the anomaly.
One key argument of this thesis relates to the high government debt levels and implies that real rates should be lower. This is known as fiscal dominance, where fiscal policy dictates monetary policy. Chairman Powell has repeatedly said the Fed would not let fiscal dominance dictate momentary policy. In other words, if debt levels are too high, that is an issue for Congress to address, not the Fed to accommodate.
Bill Dudley Urging for a Rate Cut…NOW!
Bill Dudley is no stranger to mixing politics with Fed policy. Notably, he recommended the Fed consider the impacts of their monetary policy going into the 2020 election to keep Trump from winning the election. He was heavily criticized for mixing Fed independence and politics but arguably he’s back at it again where (in the op-ed) he’s encouraging the Fed to start cutting rates now. While it’s unlikely the Fed is taking into consideration his opinion, it does seem like the narrative for sooner cuts is becoming more mainstream.
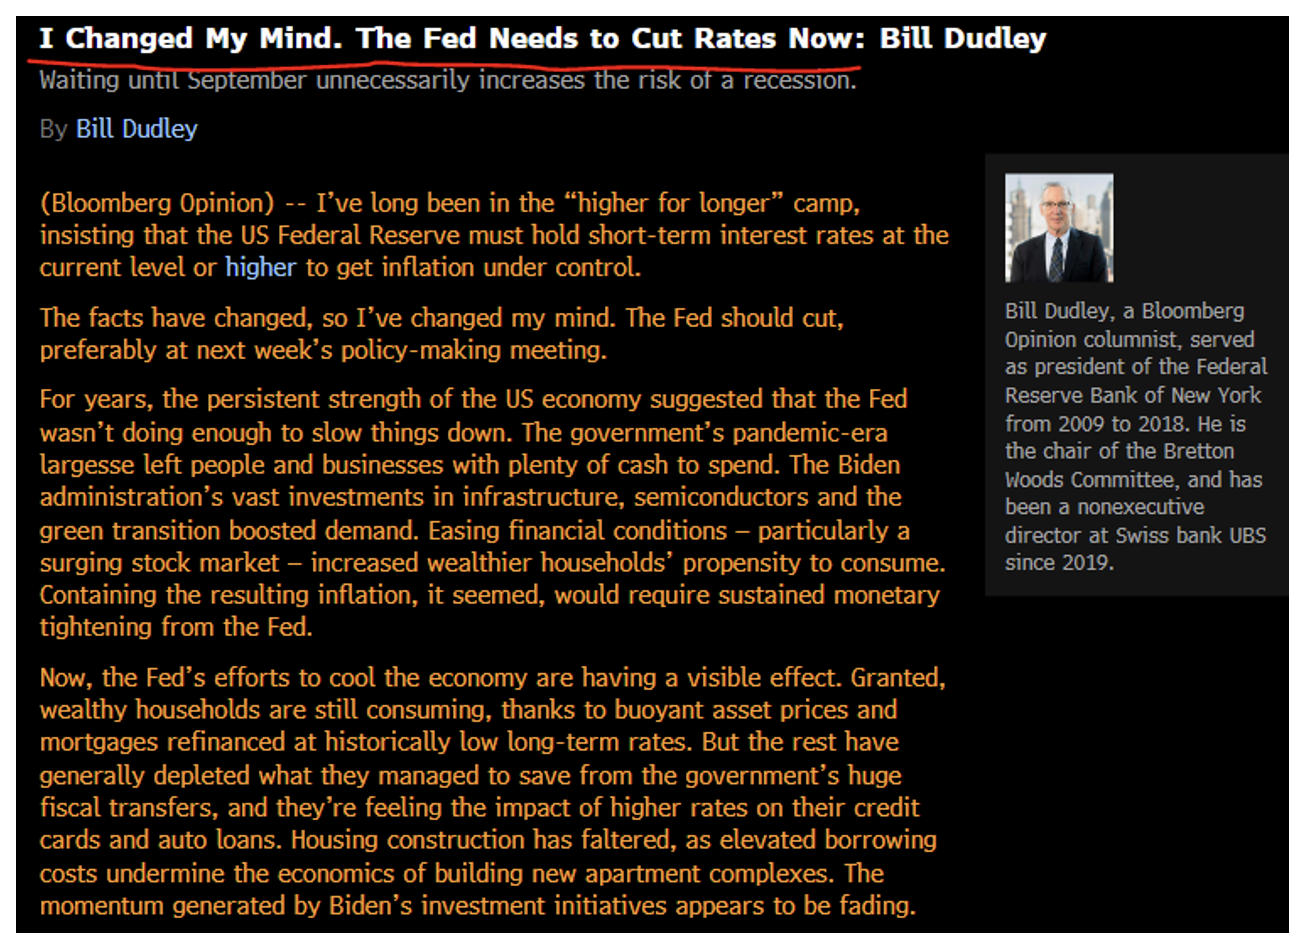 Source: Bloomberg as of 07.24.2024
Dudley’s call for the Fed to get the cutting cycle started was predicated on a weakening labor market. In the next section, we will poke some holes in that thesis.
Keep in mind that inflation typically comes in waves. That is caused by both inflation having a psychological effect on the population (and their spending/investing/saving habits), and also due to the Fed letting off the brakes too quickly.
Sahm Rule Doesn’t Account for Massive Immigration
The Sahm Rule is a Recession Indicator created by Claudia Sahm that signals the start of a recession when the three-month moving average of the national unemployment rate (U3) rises by 0.50 percentage points or more relative to its three-month average low during the previous 12 months. This indicator has been a favorite of those calling for imminent rate cuts.
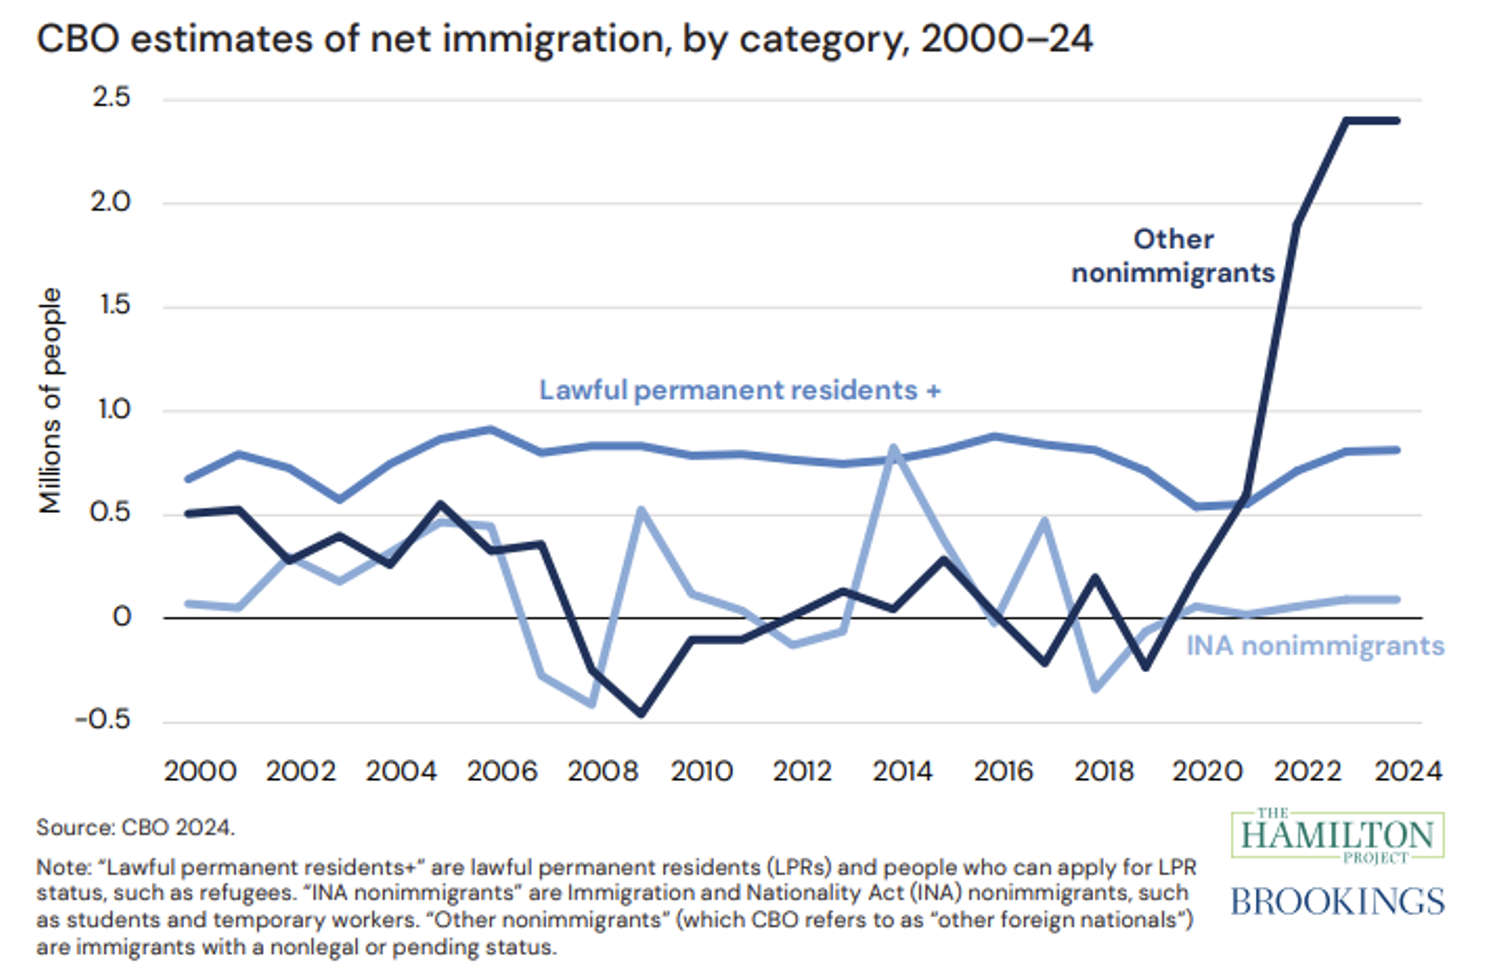 Source: Brookings as of 07.24.2024
The surge in unemployed people can be explained by the flood of unemployed migrants entering the country and getting picked up in the household survey used to calculate the unemployment rate.
The bottom line is that the Sahm Rule’s unstated assumption is of a stable and predictable population growth rate. But when millions of unemployed migrants flood into the country, the unemployment rate will rise. Is this rise telling us the country’s demographics are changing or is the economy slowing into a potential recession? We think this question needs to be answered before economists make monetary policy decisions based on the Sahm Rule.
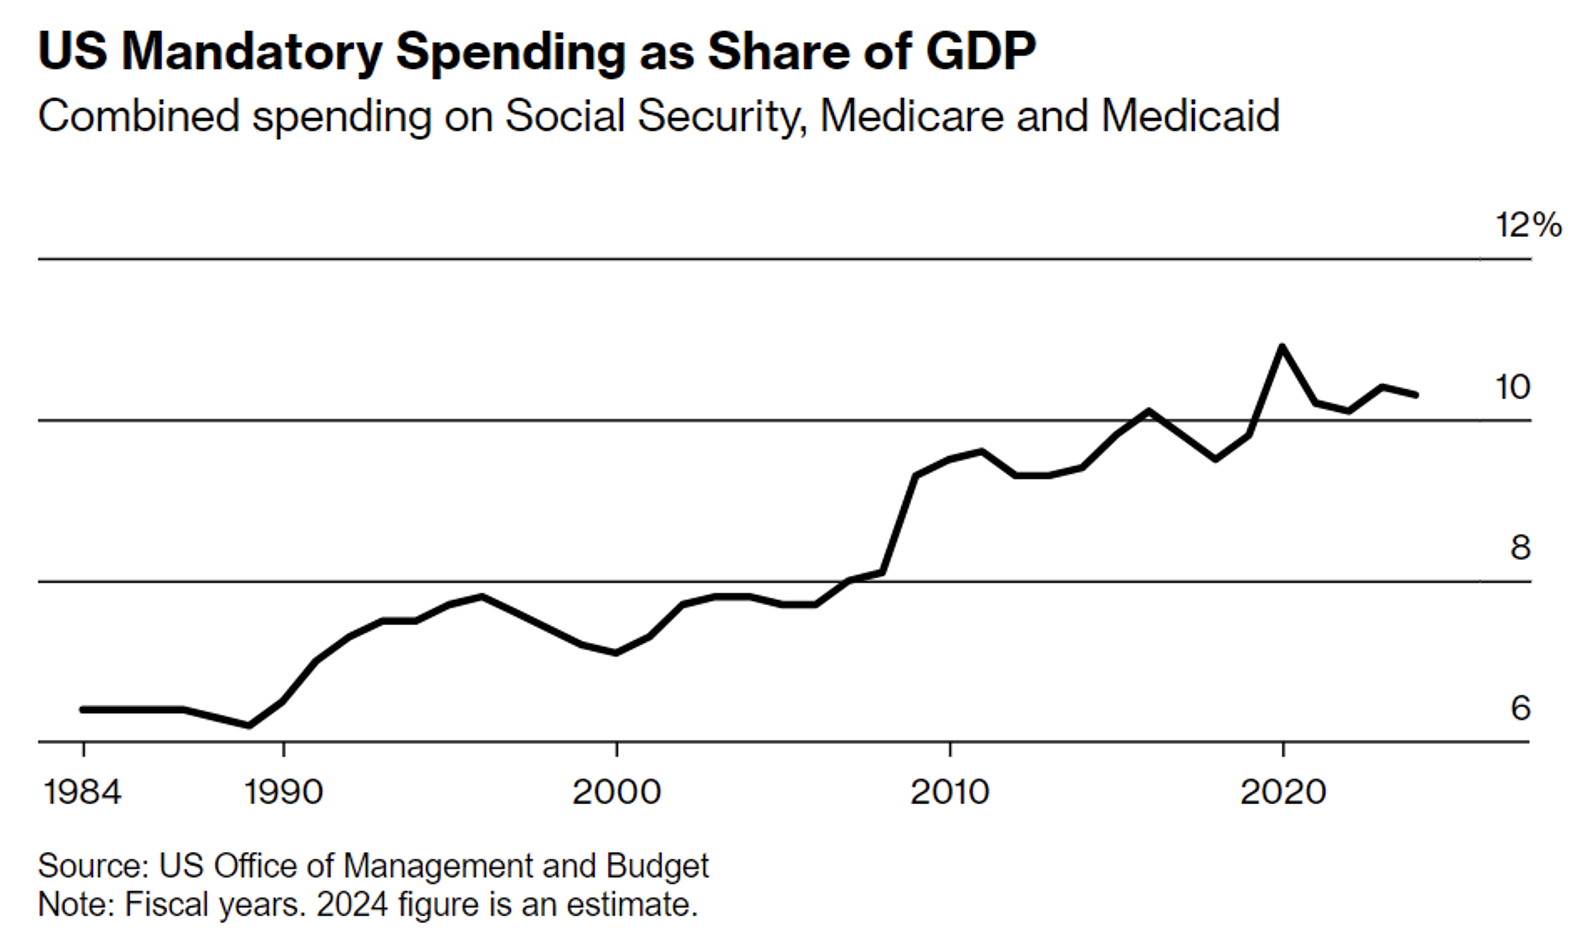
Deficit Spending on Turbo Drive
The deficit for the fiscal year ending on Sept. 30 will amount to almost $1.9 trillion, equal to 6.6% of gross domestic product. Estimates from the nonpartisan Congressional Budget Office put the gap at an even wider 6.7%. What is driving the deficit up? Broadly speaking, there are two culprits: the mandatory programmatic spending (entitlements), and the interest costs on the national debt.
 Source: Charlie Bilello as of 07.10.2024
We’ve got a deficit for the next 10 years that is projected to never go below 6% of GDP, with no recessions, and with unemployment never going above 4.5%. Currently, the market is pricing in 175-200 basis points of rate cuts. Real GDP came in for Q2 at 2.8% this morning (above the 2.0% consensus) even with the Fed Funds rate >5%…those loading the boat with duration into this fiscal powder keg, I’ve got some oceanfront property in Arizona to sell ya!
What Should the 10-Year Treasury Yield?
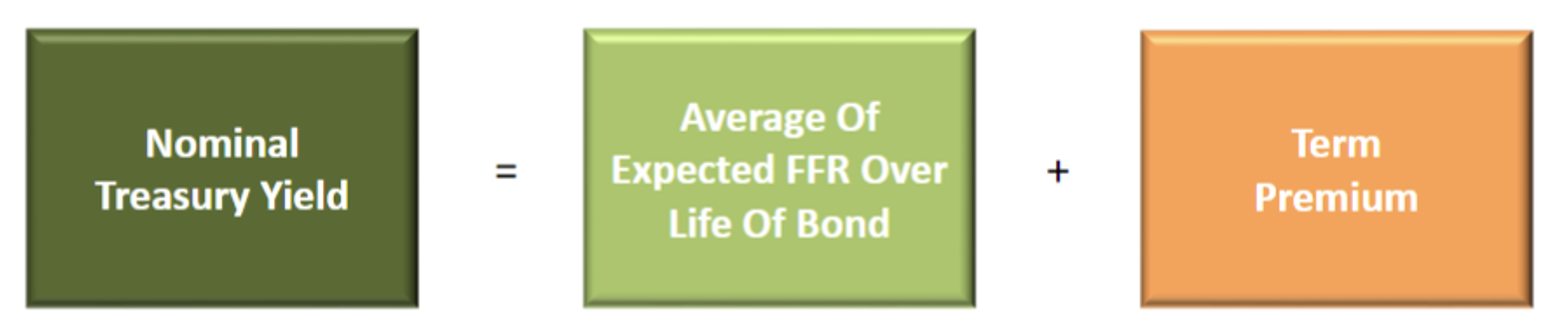
Bond Yields can be broken down into 2 simple components:
- The Expected Federal Funds Rates over the life of the bond
- The Term Premium
 Source: Cornerstone Macro as of 07.25.2024
#1: Expected FFR
The Fed’s recent long-term projection for the Federal Funds rate was recently projected to be 2.8% (Fed’s Summary of Projections). We expect the Fed Funds rate to approximately average this rate looking ahead.
#2: Term Premiums
If the Fed Funds rate averages ~2.8%, and the average Term Premium for 10-year bonds averages 75bps (last 30 years average during low inflation) or 150bps (last 60 years average) that would put the 10-year bond yield in a range between 3.55% – 4.30%.
I’d make two caveats, first, the higher end of the Term Premium range could be more realistic given the deficit spend, increase in inflation/volatility of inflation, and increased supply of Treasuries. Second, given that the economy seems to be handling higher rates better than expected, the average Fed Funds rate could be higher than what is currently projected.
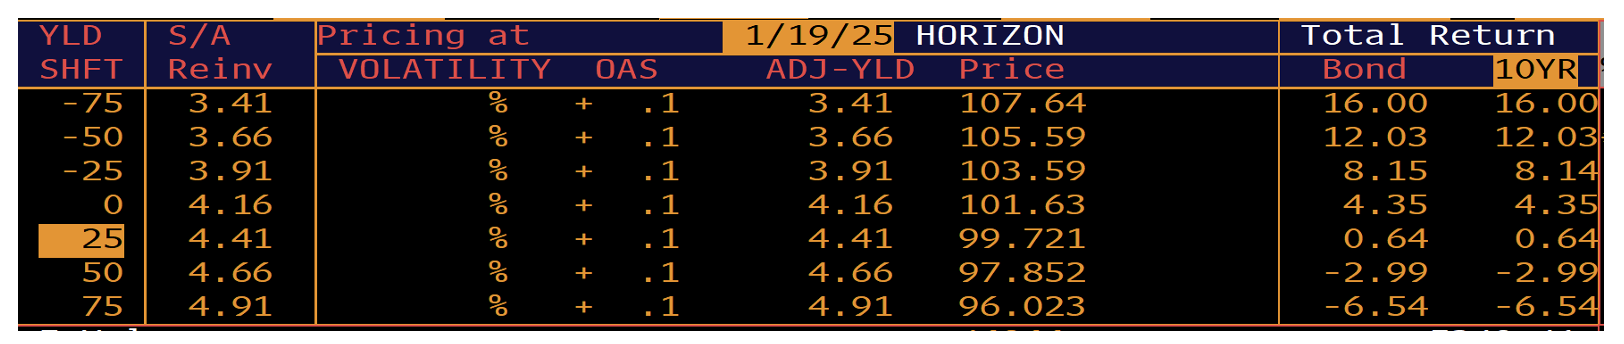
Taking this a step further, we looked at price return from 10yr Bonds in various rate environments (looking out six months).
 Source: Bloomberg
Considering a 10yr Treasury, if rates fell to the lower end of our range (~3.60%) by January of next year, your 10yr bond would have a total return of ~12%. That seems like a large move in rates over the next 5-6 months in an environment where the market is already pricing in ~3 cuts this year (i.e., we’d likely need to see a great number of cuts to see such a large drop in rates).
Disclosures
Past performance is not indicative of future results. This material is not financial advice or an offer to sell any product. The information contained herein should not be considered a recommendation to purchase or sell any particular security. Forward looking statements cannot be guaranteed.
This commentary offers generalized research, not personalized investment advice. It is for informational purposes only and does not constitute a complete description of our investment services or performance. Nothing in this commentary should be interpreted to state or imply that past results are an indication of future investment returns. All investments involve risk and unless otherwise stated, are not guaranteed. Be sure to consult with an investment & tax professional before implementing any investment strategy. Investing involves risk. Principal loss is possible.
Advisory services are offered through Aptus Capital Advisors, LLC, a Registered Investment Adviser registered with the Securities and Exchange Commission. Registration does not imply a certain level or skill or training. More information about the advisor, its investment strategies and objectives, is included in the firm’s Form ADV Part 2, which can be obtained, at no charge, by calling (251) 517-7198. Aptus Capital Advisors, LLC is headquartered in Fairhope, Alabama. ACA-2407-32.
