I’m going to cut to the chase here – I’ve been reading a lot on the debt crisis here recently, especially after the Congressional Budget Office (“CBO”) released its latest Budget and Economic Outlook last week. This report projects the US fiscal and economic outlook over the next 10 years, which ultimately painted a rapidly deteriorating fiscal situation, driven in large part by recent legislative changes, rising interest rates, and a demographic crunch over the long term.
In Part 1 of my Aptus Musings on the Debt Ceiling, I mentioned how the Fed intervened in 2011 with “Operation Twist” and then “QE3”. Given where inflation is, and the stickiness aspects of a few parts of the recent reports, it seems quite unlikely that the Fed will insulate market volatility again in ’23. I won’t delve into Fed Policy in this Musing, but I can tell you that John Luke is having nightly dreams about interest rates going higher in the near-term. And this is after the market has finally started to price in a higher terminal rate than the Fed over the last 2 weeks (we have a cool chart on this – feel free to ask for it).
These updated budget projections could put US policy on a fiscal collision course in 2023 as policymakers balance the need to raise the debt ceiling this summer with the growing imperative to get the US fiscal trajectory on a better footing.
Debt Ceiling Part 2
Recap of Part 1
The biggest thing that the market learned in 2011 is that the process is just as important as the outcome.
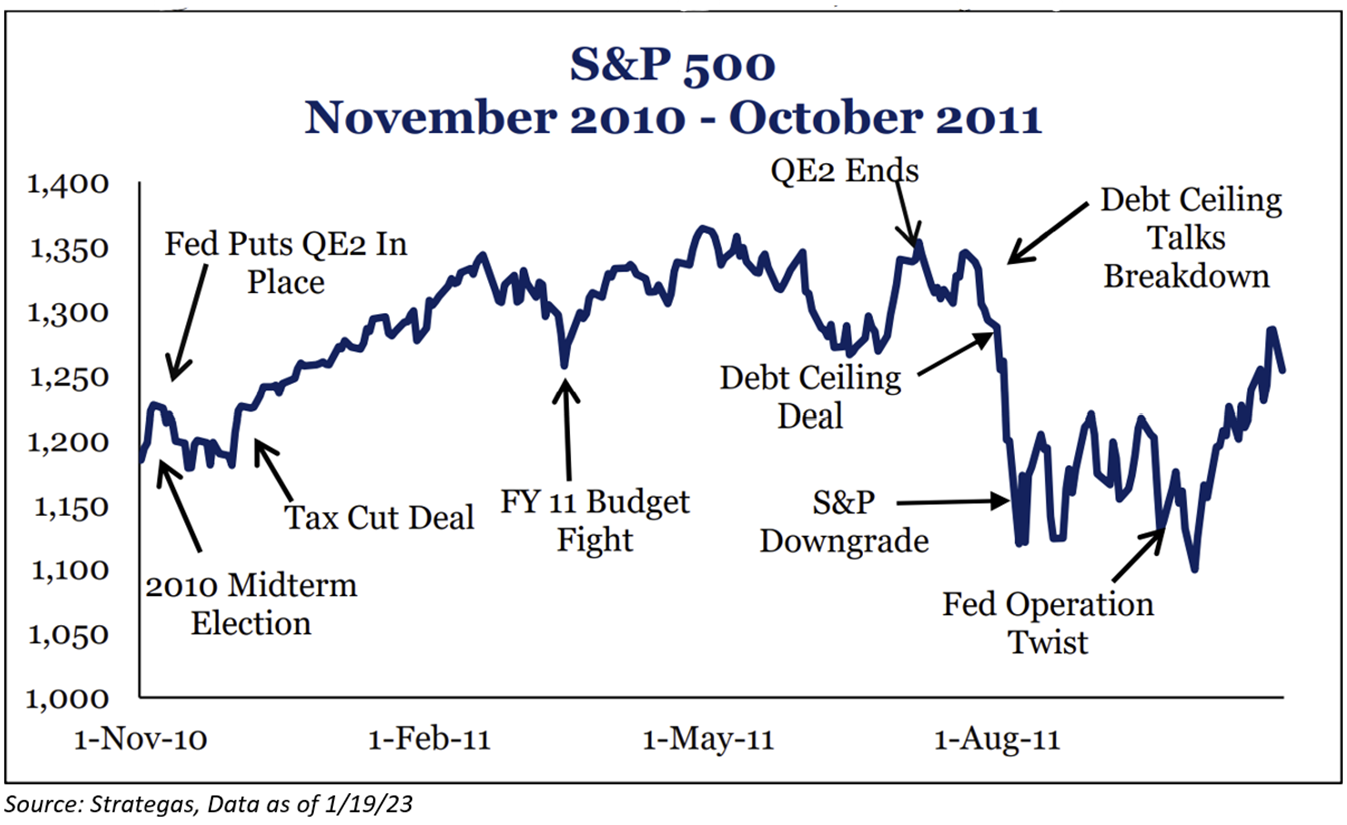
Essentially, the political environment in D.C. in ’11 is much like today – Dem. President / Dem. Senate / Rep. House and the Republicans could not get their own members on the same page regarding policy. Thus, the two parties had to immediately engage in budget trench warfare leading to a gov’t shutdown at the end of Q1 and a debt crisis a few months later. Not only that, but the events were compounded by a series of other occurrences – a slowdown in corporate earnings and an economic crisis in Europe – sound familiar.
The S&P 500 fell 20% during that summer. Though, unlike today, the Fed was able to provide a cushion to these fiscal policy shocks.
Diving Deeper into the Numbers
First glance at the CBO report basically paints a picture that interest costs are going to materially increase, tax receipts are going to continue to fall in the NT, and that they are projecting a large increase in entitlement spending. I’m going to cover the first two items, but I’ll be short on the latter due to obvious reasons – I’m just not going there.
Increasing Interest Expense (Higher Costs):
Interest rates are VERY important to the US gov’t. I’m not sure where I read this, but it’s eye opening: “Doing some rough numbers, the interest expense is way more sensitive to the overall budget. If borrowing costs increase 2%, that is an additional $620B in interest costs; for inflation, a decrease of 2% only captures $75B savings in entitlements cost escalation.”
For the past 30 years the US was able to increase spending and cut taxes without an increase in its debt servicing cost. I believe that those days are over. The CBO forecast adds $1.7 trillion of net interest costs to the budget, a 20% increase from May 2022. As such, the debt service cost notably increases, averaging 16.8% of tax revenues over the next 10 years and up from 13.3 percent in the May 2022 forecast. We have found that once interest costs exceed 15% of tax revenues, financial markets begin to force austerity on policymakers.
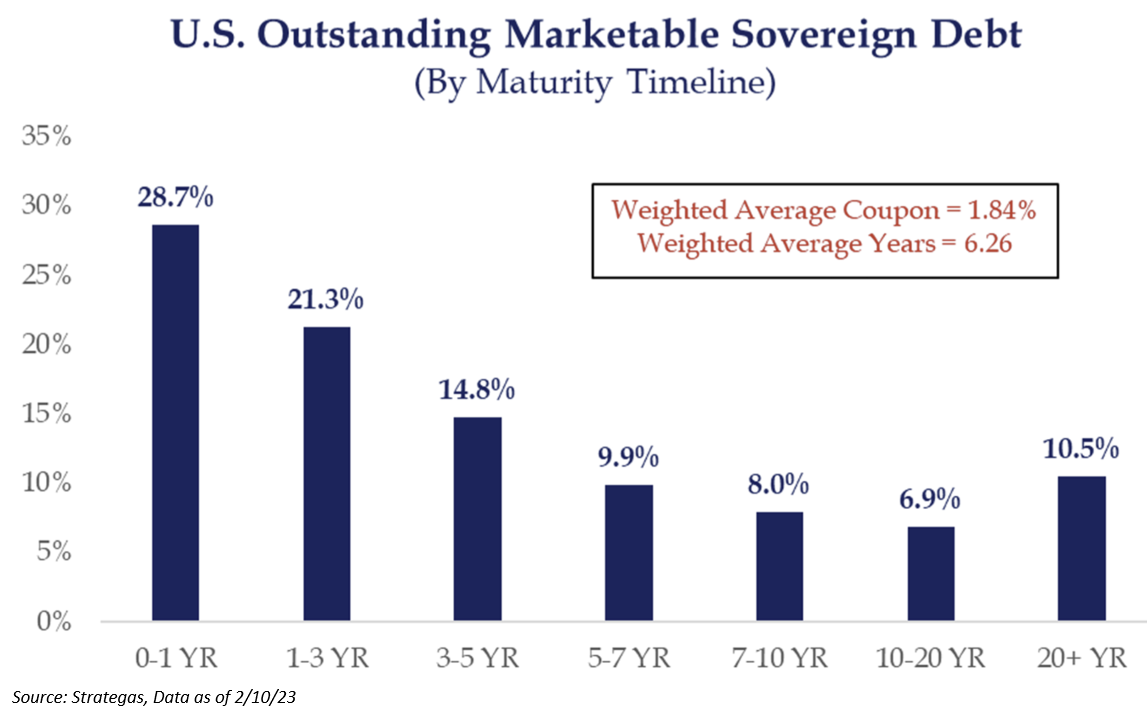
The shocking aspects of gov’t spending was simply the gov’t financing their own debt. Almost 50% of debt matures in the next 3 years w/ an avg. coupon of 1.84% (2YR treasury is at 4.66%).
Falling Tax Receipts (Lower Revenues):
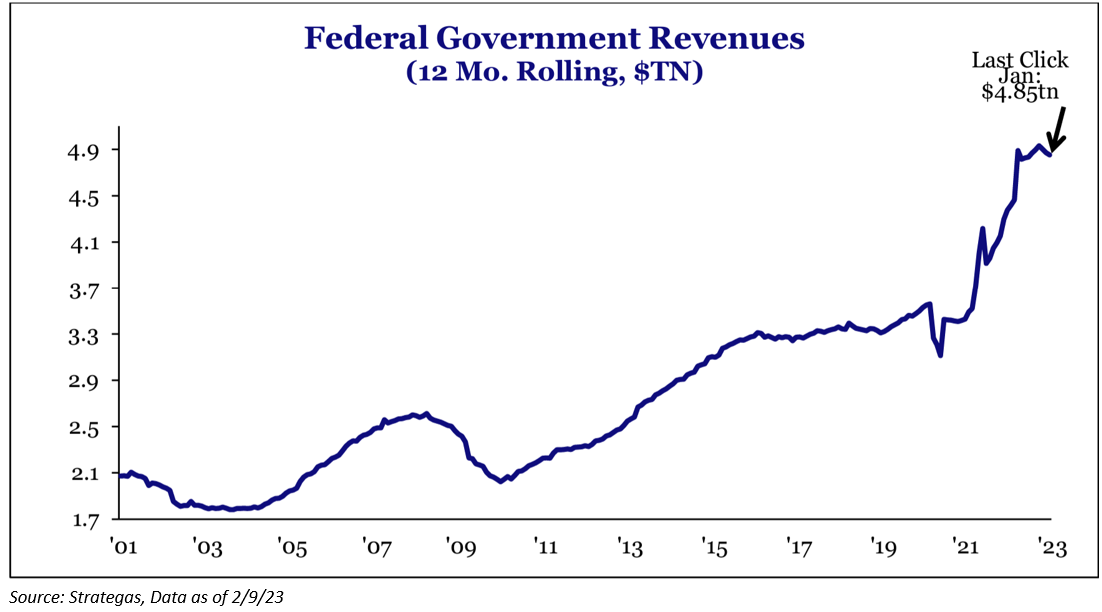
Most Americans pay their taxes in April, making it the largest month of tax collections for the year. There are a few reasons that tax receipts could decrease in the near-term. First, the $9 trillion decline in shareholder wealth in 2022 means there will be less tax revenue this year compared to last – think capital gains and lower M&A.
Secondly, initial numbers out of CA and NY show a decrease in tax revenues of 42.0% and 12.7%, respectively. I would take the California number with a grain of salt, but the state widely acknowledges that it is facing a large deficit and that deficit may widen out even more as tax collections come in this year – California tax revenues are down 2% over the last 12 months.
Investors have recognized that states with income taxes generally move in the same direction and that CA and NY tend to be leading indicators. It appears that Federal tax revenues have peaked and will begin declining on a year-over-year basis.
Entitlement Spending (Higher Costs):
The higher interest rates / higher inflation situation is a pickle for the gov’t/Fed. On one hand, Fed pivots to get gov’t lower borrowing costs. On the other, entitlements are linked to inflation, so higher for longer inflation drives that side of the budget up nominally.
Federal spending is roughly 25% of GDP, putting it 5% points above its long-run average. Historically, when federal spending exceeds its historical average, Congress has used the debt ceiling to enact budget reforms. This was true in the 80’s, 90’s and as recently as 2011. The thing that I’m watching the most here is: 60% of the government’s budget is indexed to inflation: 1) Social Security (the cost-of-living adjustment this year was +8.7%), 2) Medicare, and 3) Medicaid.
Conclusion
It’s never a great concoction when costs are increasing (Federal spending and interest expenses), while revenue could basically be stagnant (tax receipts). I understand that investors have been worrying about the debt clock for decades. For some, this entire line of thinking may seem trivial – I fully understand that. Personally, I tend to be in this camp – I know that it will get resolved.
But there is a tipping point – I just have no idea when that tipping point may occur. Truthfully, I think all of this will be resolved, but that’s why the process is maybe more important than the outcome. And, if things do go south (which I don’t believe that they will), each and every one of you can join my tribe – because that’s how dire the situation would be. All are welcome, even Pittsburgh Steelers fans.
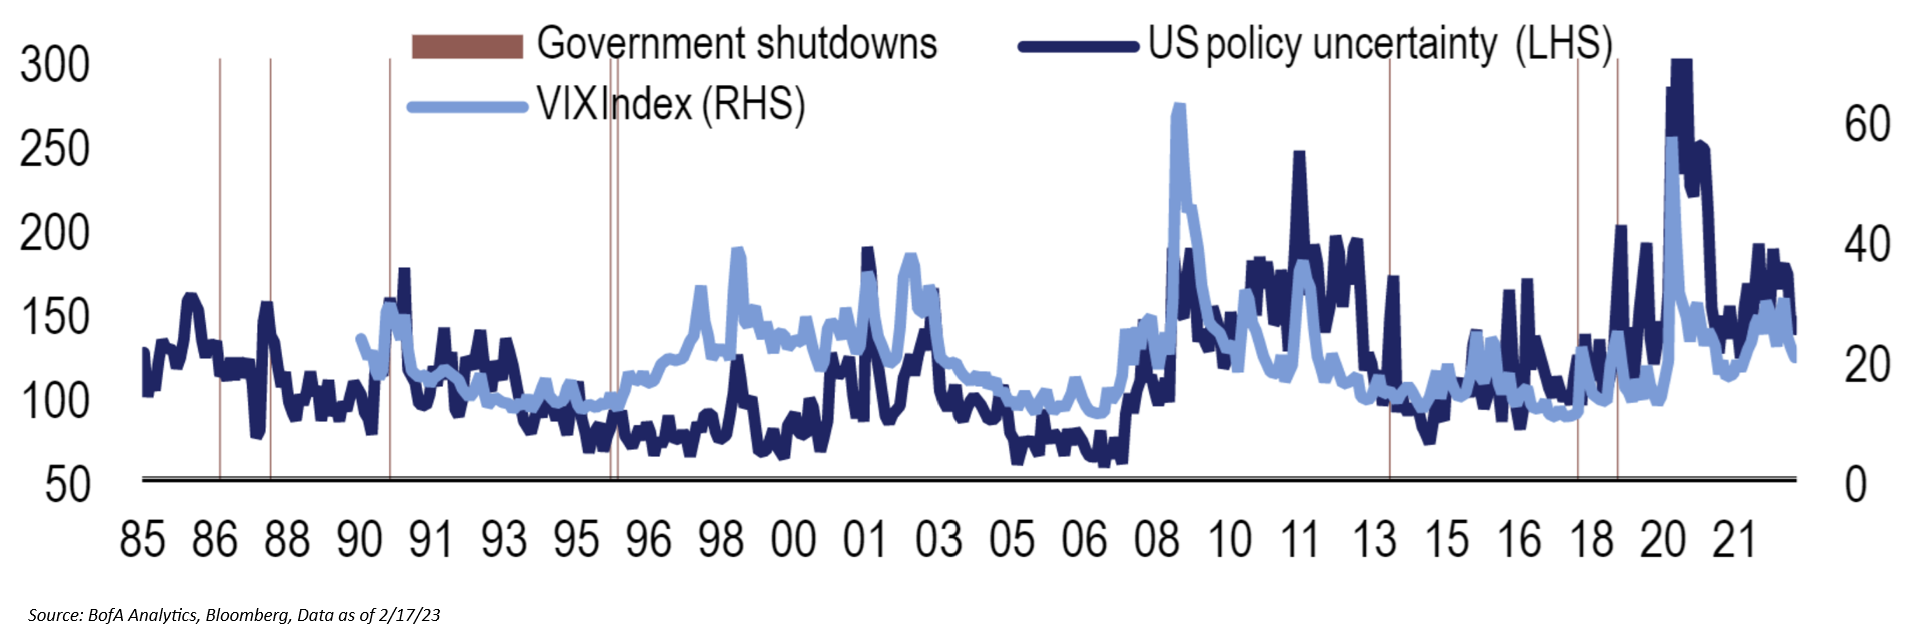
I honestly have no clue how this will play out. This is why owning volatility may be the best way to capitalize on the potential unknowns this year. The below chart shows that the VIX has tended to spike during political uncertainty – just look at 2011:
As always, please reach out with any questions.
Disclosures
Past performance is not indicative of future results. This material is not financial advice or an offer to sell any product. The information contained herein should not be considered a recommendation to purchase or sell any particular security. Forward looking statements cannot be guaranteed.
This commentary offers generalized research, not personalized investment advice. It is for informational purposes only and does not constitute a complete description of our investment services or performance. Nothing in this commentary should be interpreted to state or imply that past results are an indication of future investment returns. All investments involve risk and unless otherwise stated, are not guaranteed. Be sure to consult with an investment & tax professional before implementing any investment strategy. Investing involves risk. Principal loss is possible.
The S&P 500® Index is the Standard & Poor’s Composite Index and is widely regarded as a single gauge of large cap U.S. equities. It is market cap weighted and includes 500 leading companies, capturing approximately 80% coverage of available market capitalization. The VIX Index is a calculation designed to produce a measure of constant, 30-day expected volatility of the U.S. stock market, derived from real-time, mid-quote prices of S&P 500® Index (SPX℠) call and put options. On a global basis, it is one of the most recognized measures of volatility — widely reported by financial media and closely followed by a variety of market participants as a daily market indicator.
Advisory services are offered through Aptus Capital Advisors, LLC, a Registered Investment Adviser registered with the Securities and Exchange Commission. Registration does not imply a certain level or skill or training. More information about the advisor, its investment strategies and objectives, is included in the firm’s Form ADV Part 2, which can be obtained, at no charge, by calling (251) 517-7198. Aptus Capital Advisors, LLC is headquartered in Fairhope, Alabama. ACA-2302-23.
