Last week brought a substantial rally in bonds following a brutal three-month span of higher rates. There are a couple of reasons we can point to for the move lower in rates:
- The US Treasury cut back slightly on the amount of long-term bonds it’s planning to auction, compared to previous plans.
- The Bank of Japan allowed 10-year yields to rise but didn’t release control completely, as some thought possible.
- The Federal Reserve offered guidance that was taken, in our opinion, as a strong hint that it didn’t plan any more rate hikes.
- US unemployment data was weaker than expected.
Market Expects Rate Faster Cuts… Again
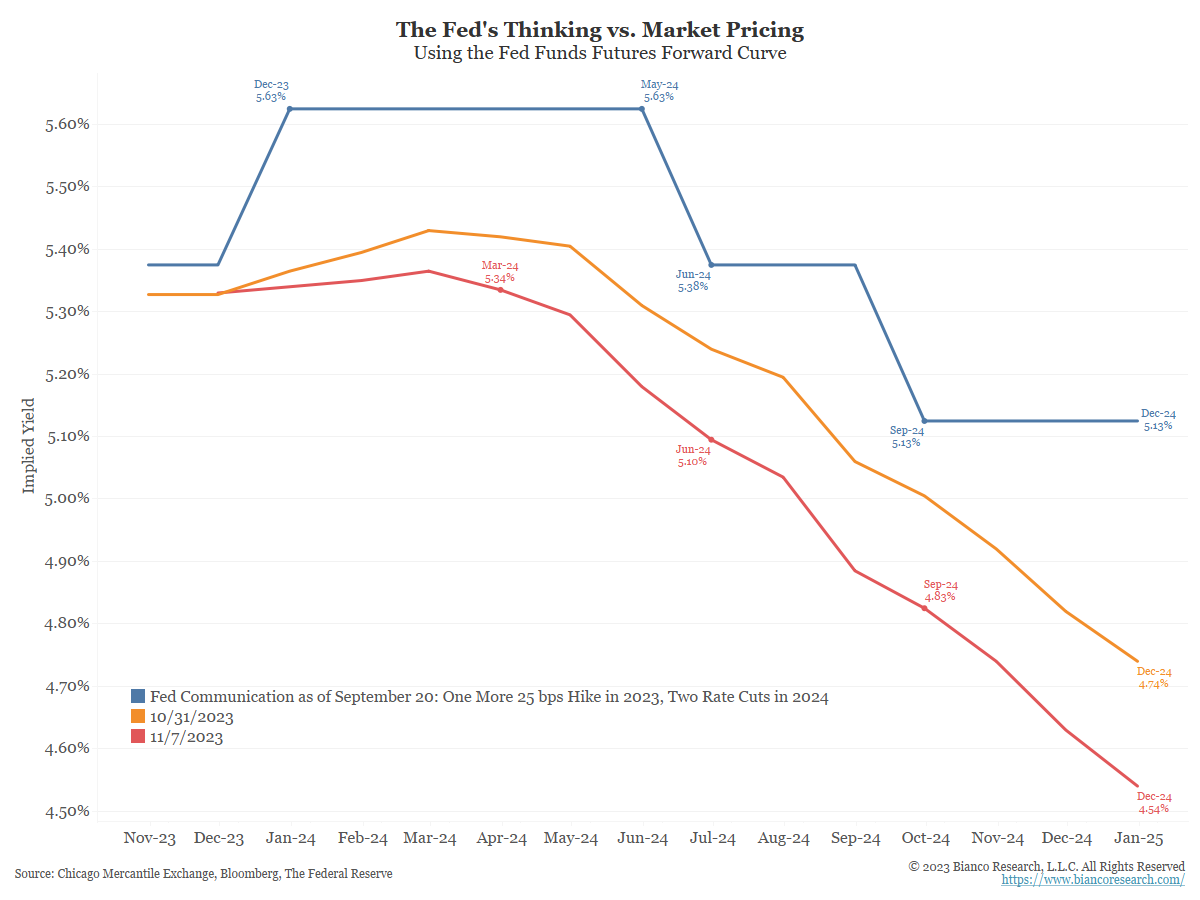 Source: Bianco as of 11.06.2023
The bond market is betting on a “dovish pivot” for the seventh time since the Federal Reserve and other central banks embarked on a tightening cycle, potentially setting up another “false hope”.
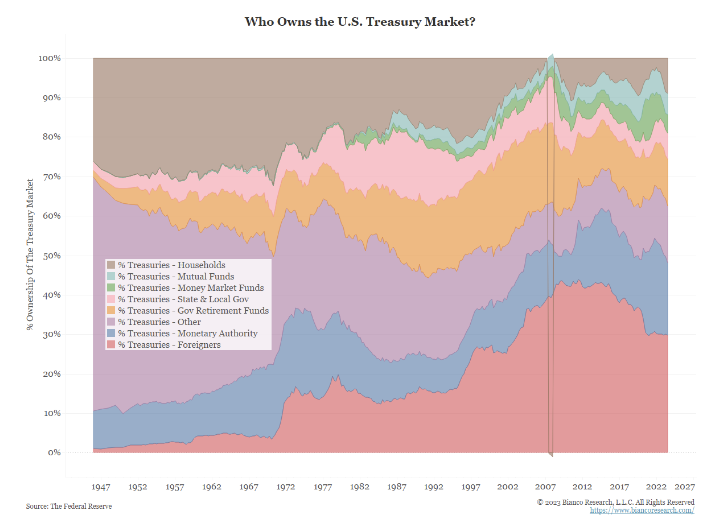
Who Owns the Treasury Market?
The shift away from price-insensitive buyers, like the Federal Reserve or China, and toward price-sensitive buyers, like hedge funds or households, is worth monitoring. The brown area in the chart below shows households’ ownership of the Treasury market.
 Source: Bianco as of 11.06.2023
This label is a bit of a misnomer as it also includes hedge funds. But together, they represent two price-sensitive buyers of Treasuries. As noted, this group held roughly 2% of the market at the beginning of 2022 and now owns 9%.
The red and blue areas represent foreign ownership and central bank ownership. The percentage of the market held by these price-insensitive buyers has decreased over the same period, meaning artificial buyers may not provide the support they once did.
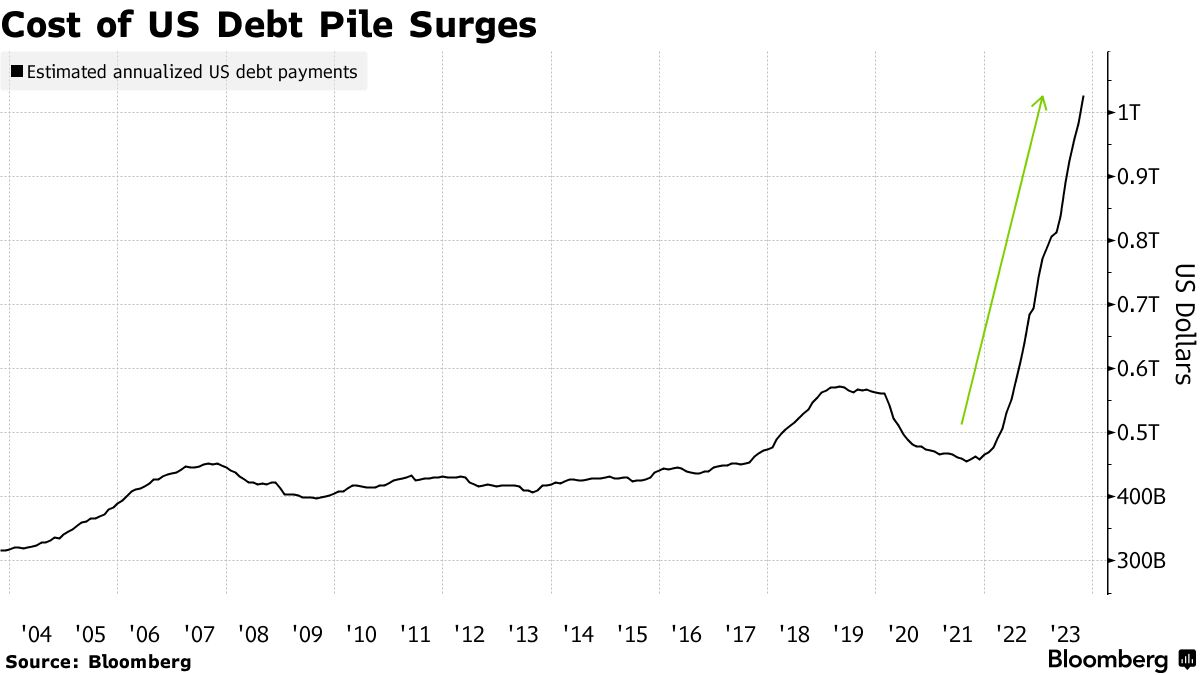
Interest Expense Looks Like a Meme Stock
 Source: Bloomberg as of 11.06/.2023
Following the surge in interest rates, the estimate for annualized interest payments on the US government debt pile has climbed past $1 trillion. That projected amount has doubled in the past 19 months.
The estimated interest expense is calculated using US Treasury data which state the government’s monthly outstanding debt balances and the average interest it pays. Of course, the gauge of estimated interest costs is different than what the Treasury actually paid. Interest costs in the fiscal year that ended September 30th ultimately totaled $879.3 billion, up from $717.6 billion the previous year and about 14% of total outlays.
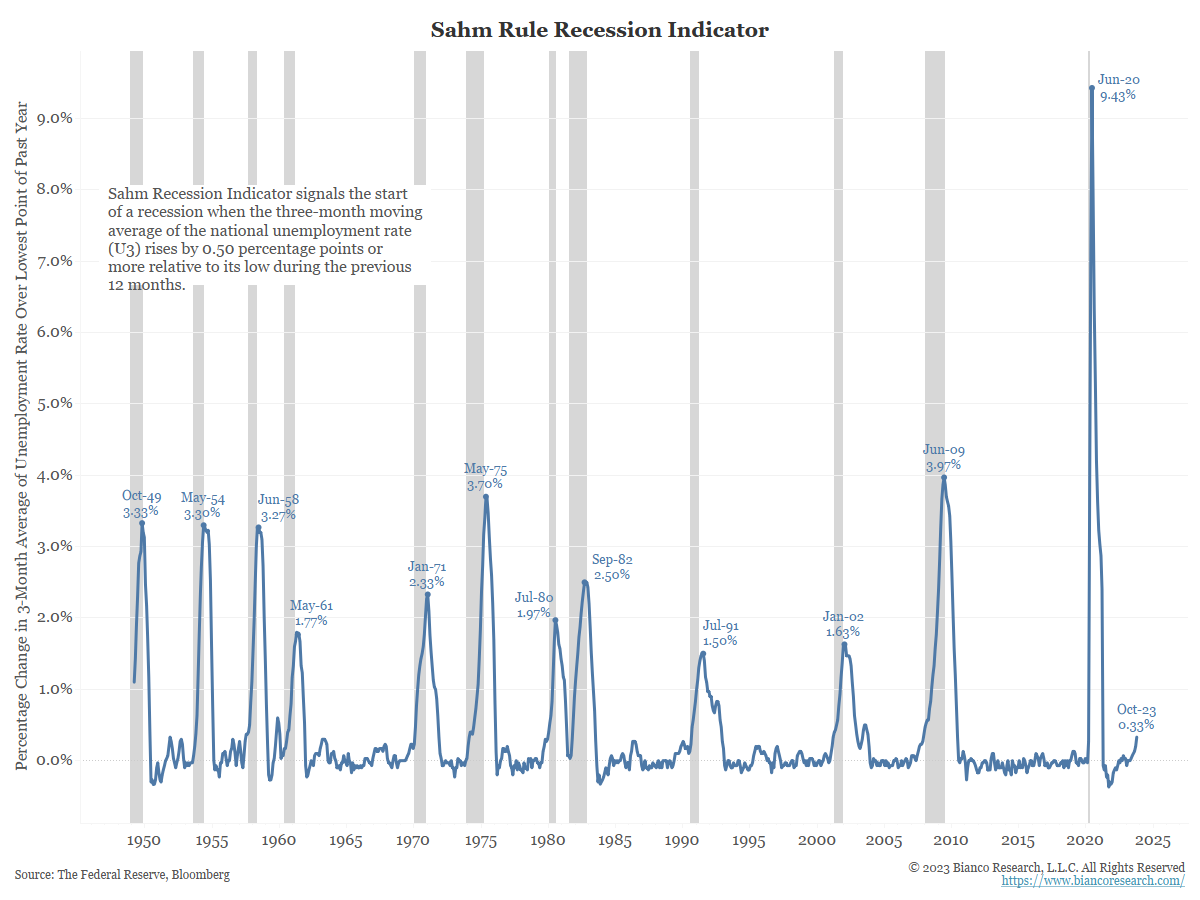
Sahm Rule Still Points to No Recession
The Sahm rule is simple. If the three-month average of the unemployment rate (the monthly rate often bounces around too much) is half a percentage point or more above its low in the prior 12 months, the economy is in a recession. The current value is 0.33 percentage points. According to the calculation, it’s highly unlikely that we are in a recession – at least for now.
 Source: Bianco as of 11.07.2023
Claudia Sahm, the creator of the rule, is cautioning that the pandemic may have temporarily broken her indicator. It is not a law of nature. Just because it worked in the past as an early recession signal does not mean that it will necessarily work this time; all kinds of empirical regularities have broken down in the post-pandemic recovery.
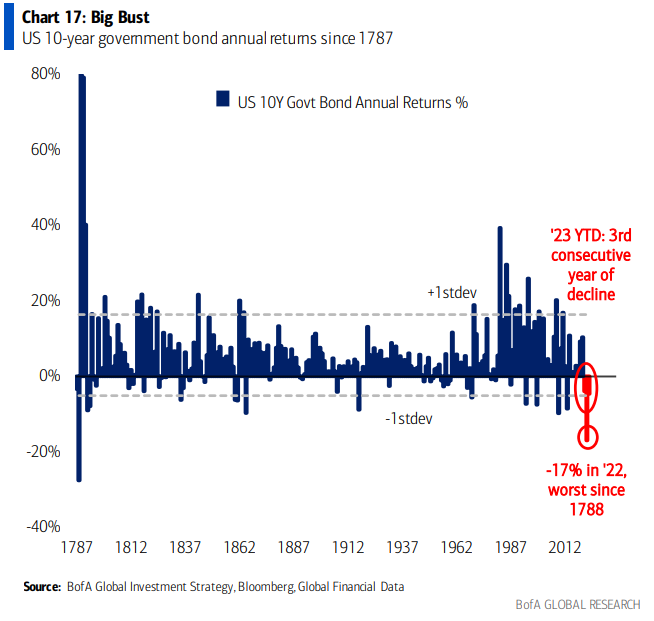
10-Year Treasuries Risk Third Straight Down Year
 Source: BAML as of 10.31.2023
Never before in the history of the US republic has the value of US Treasuries fallen for 3 consecutive years as they are on course to do in 2023 (-7% in ’23, -17% in ’22, -4% in ’21). The start of the month of November has taken some pressure off 10-year bonds, but we are still a ways off from a positive return for the year.
Can the Fed Take Credit for the Decline in Inflation?
One popular question we’ve had has been, does the Federal Reserve deserve credit for the decline in inflation? On the face of it, inflation plummeted after the Fed —which was undoubtedly flat-footed at first— finally caught up by imposing a rapid series of rate increases.
Digging into what has happened, there is no obvious link between the Fed’s action and the slowdown in inflation. Instead, inflation has fallen mostly because of things over which the Fed has little to no control. Most progress has been related to normality returning after the pandemic.
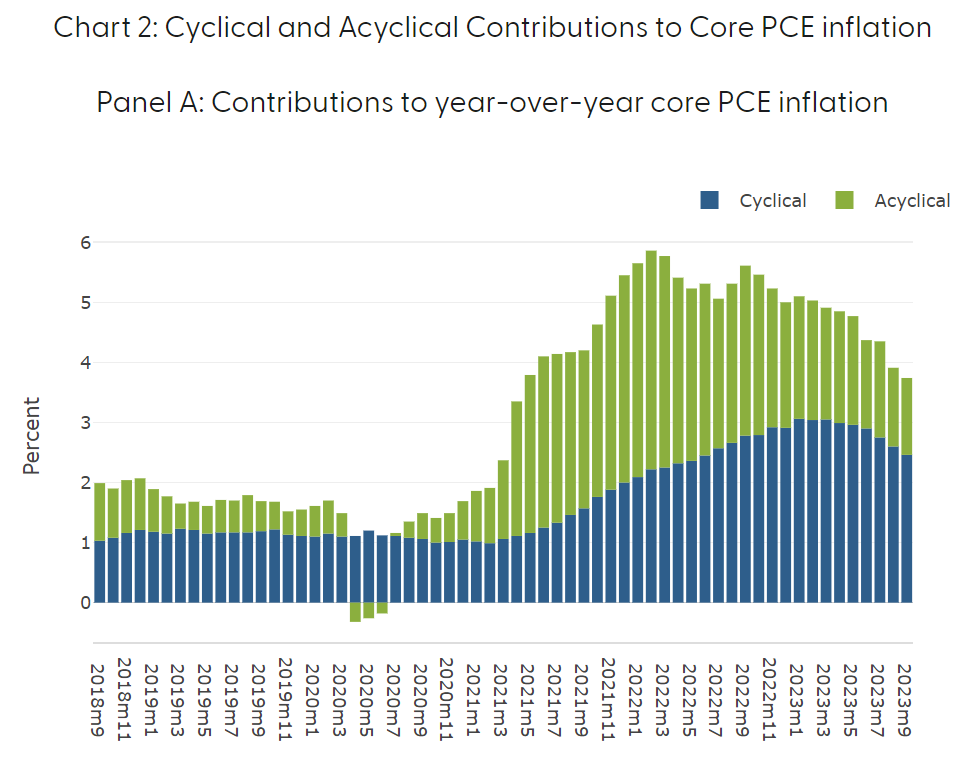
The San Francisco Fed ran an analysis breaking down core PCE’s contributions into cyclical and acyclical components.
 Source: San Fran Fed as of 11.07.2023
The chart above shows that the overwhelming majority of core PCE’s fall thus far has been due to acyclical factors (green). These are industry-specific components that are largely out of the Fed’s hands (such as supply chain issues).
The cyclical components (blue), which are the economically sensitive categories the Fed has more direct control over, have only just started to fall. At their peak in January, cyclical components were contributing 3.06% to core PCE. At the end of September, they were still contributing 2.46%, meaning only 0.60% of core inflation’s fall can be more directly attributed to the Fed thus far.
This is all a statistical way of showing the easy part of the fight against inflation is now over. From here on out, the Fed will have to ensure the cyclical components continue to fall.
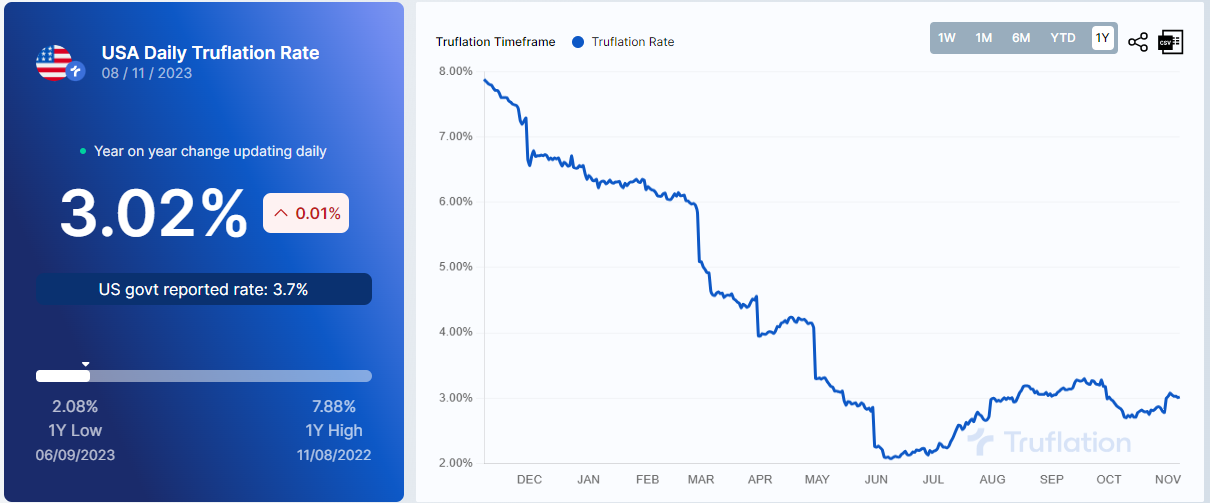
Inflation Sticky at 3%
 Source: Trueflation as of 11.07.2023
We’ve used the Truflation index as a good proxy for where inflation is going to be in a couple of months. Their index led the government inflation indices lower from their peak last fall to the lows it was at this summer.
This measure has since rebounded to ~3%. If this indicator proves to foretell the future of inflation like it has the last 24 months, we could be problematically finding a “sticky point” at a level higher than the Fed’s 2% target.
Disclosures
Past performance is not indicative of future results. This material is not financial advice or an offer to sell any product. The information contained herein should not be considered a recommendation to purchase or sell any particular security. Forward-looking statements cannot be guaranteed.
This commentary offers generalized research, not personalized investment advice. It is for informational purposes only and does not constitute a complete description of our investment services or performance. Nothing in this commentary should be interpreted to state or imply that past results are an indication of future investment returns. All investments involve risk and unless otherwise stated, are not guaranteed. Be sure to consult with an investment & tax professional before implementing any investment strategy. Investing involves risk. Principal loss is possible.
Advisory services are offered through Aptus Capital Advisors, LLC, a Registered Investment Adviser registered with the Securities and Exchange Commission. Registration does not imply a certain level or skill or training. More information about the advisor, its investment strategies and objectives, is included in the firm’s Form ADV Part 2, which can be obtained, at no charge, by calling (251) 517-7198. Aptus Capital Advisors, LLC is headquartered in Fairhope, Alabama. ACA-2311-10.
