Higher Neutral Rate Could Lead to Structurally Higher Interest Rates
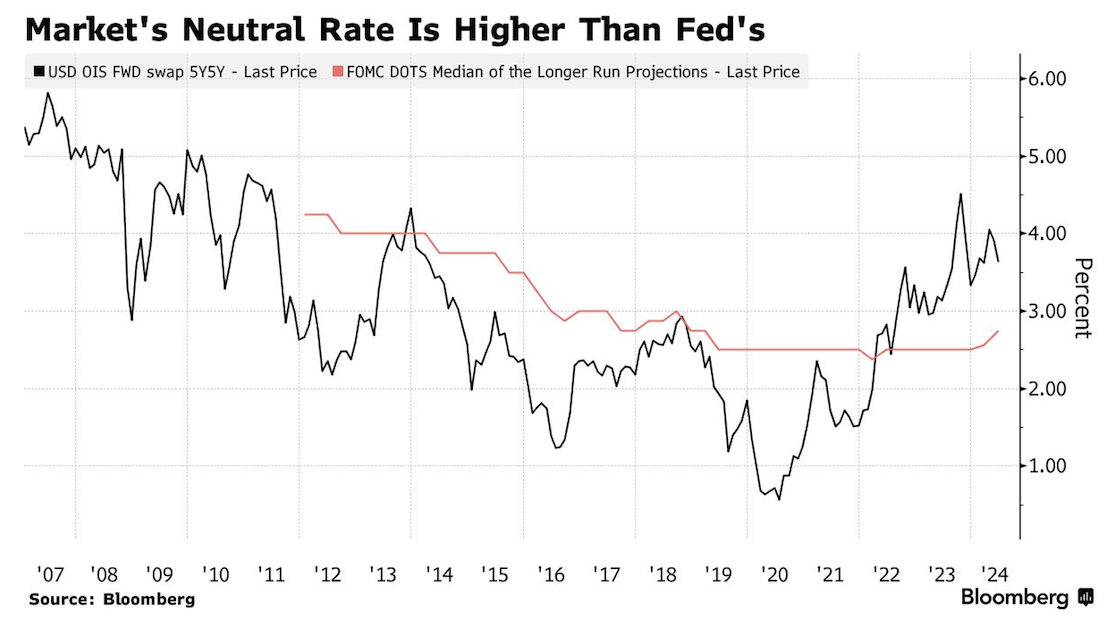
The graphic below shows pricing for forward contracts referencing the five-year interest rate in five years. This gives a proxy for the market’s view of where US rates might end up.
 Source: Bloomberg as of 06.24.2024
The forwards have stalled at 3.6%, down from last year’s peak of 4.5%. However, they currently sit more than one full percentage higher than the average over the past decade and above the Fed’s estimate of the neutral rate at 2.75%. This matters because it means the market is pricing in a much more elevated floor for yields. The practical implication is that there are potential limits to how far bonds can rally. This should be a concern for investors gearing up for the kind of epic bond rally that rescued 60/40 portfolios late last year.
Deficit Spending Continues: The US is Spending like a Drunken Sailor!
The CBO came out last week with an update to their projections. They now project that this year’s budget deficit will clock in at roughly $2 trillion, $400 billion more than forecast in February and $300 billion larger than last year’s deficit.
 Source: CBO as of 06.24.2024
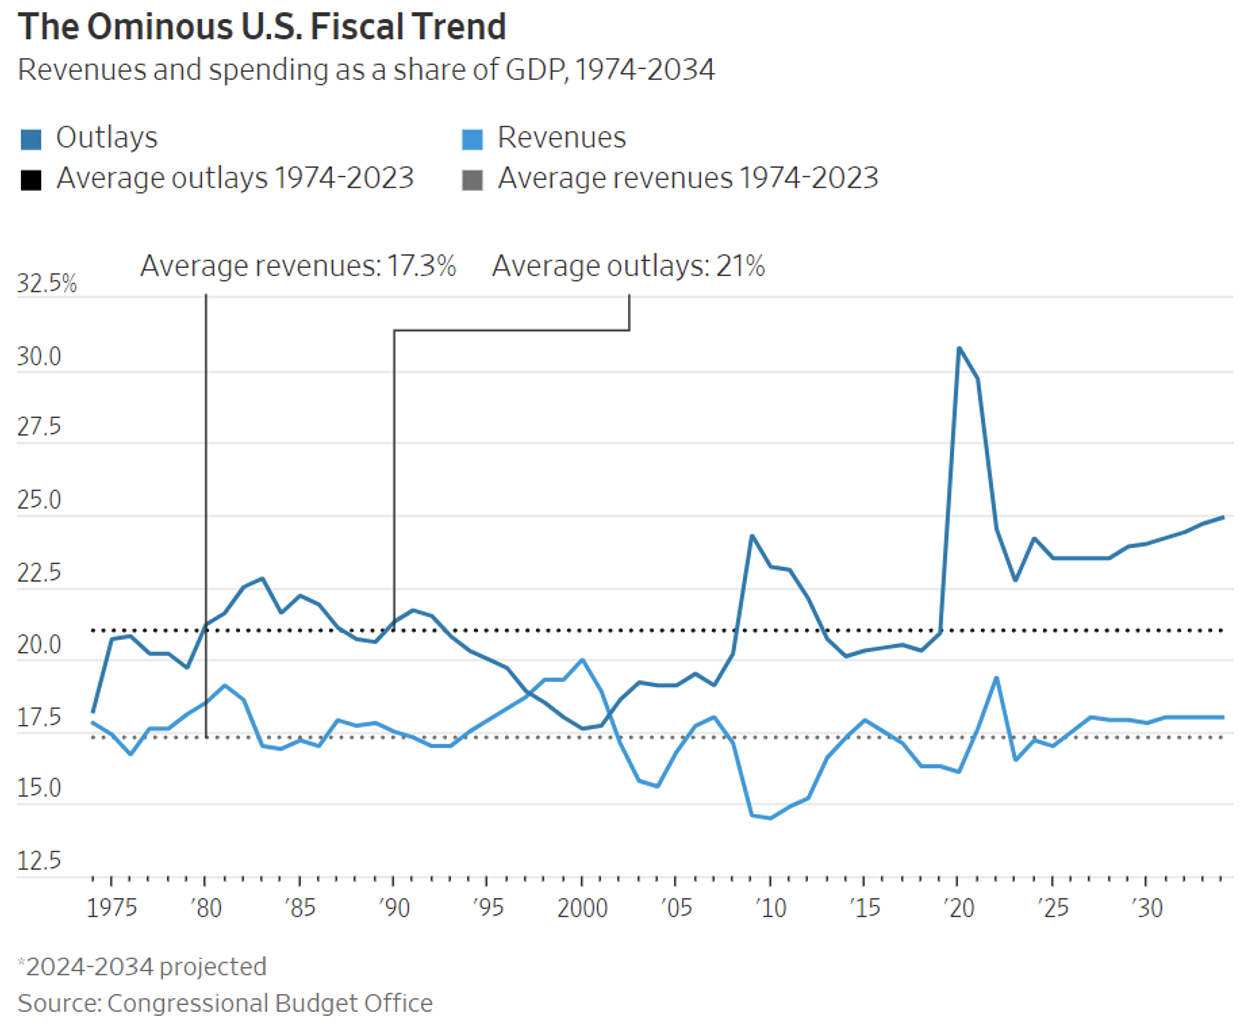
These numbers are hard to fathom given the strong economy and relatively flat defense spending. The deficit this fiscal year will be 7% of GDP, which is more than during some recessions. CBO says deficits will stay nearly this high for years, and the total over the next decade is now expected to total $21.9 trillion compared to $19.8 trillion in its February forecast. Debt held by the public will grow to 122.4% of GDP in 2034 from 97.3% last year.
Notably, CBO’s revenue projections are little changed. Revenue is expected to total 17.2% of GDP this year—roughly the 50-year average before the pandemic, as the chart above shows. However, CBO significantly revised the projections higher for federal spending. Outlays are now expected to hit 24.2% of GDP this year and average 24% over the next decade.
Maybe at some point, this will matter?
CBO Confirms (My) Expectations for Higher Term Premiums Ahead
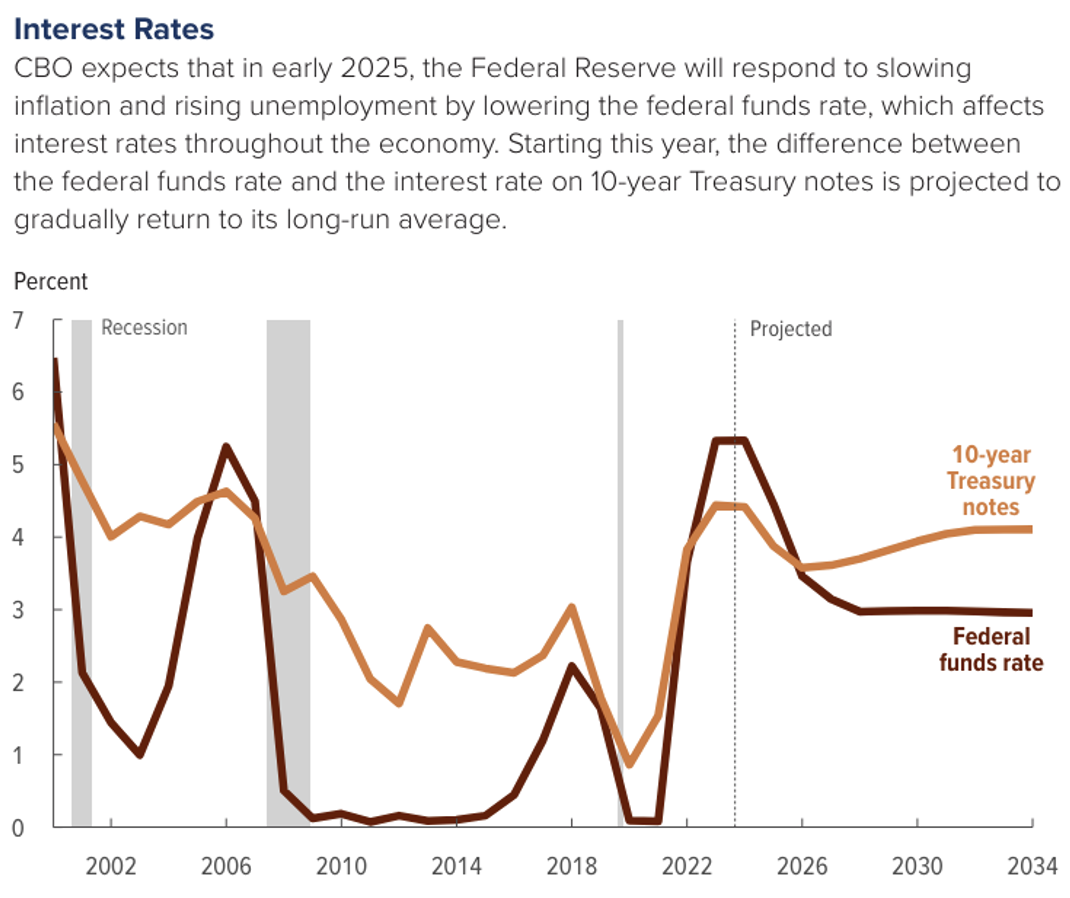
Everyone “knows” the Fed is going to decrease their funds rate in the future. The date of those cuts is still TBD. Another fact everyone “knows” is that the yield curve has been inverted for a historically long period of time (721 days, if you’re counting).
 Source: CBO as of 06.26.2024
The CBO does expect the normal relationship of positive term premium to return in the future. We continue to believe that investors banking on substantial price returns from long-term bonds are going to be disappointed, as the relationship between short-dated bonds and the 10-year note normalizes back to historical levels. A return to a positively sloped yield curve will likely minimize the (upward) price impact on longer-dated bonds.
Chapwood Index Shows “Real” Inflation Much Higher Than Government Data
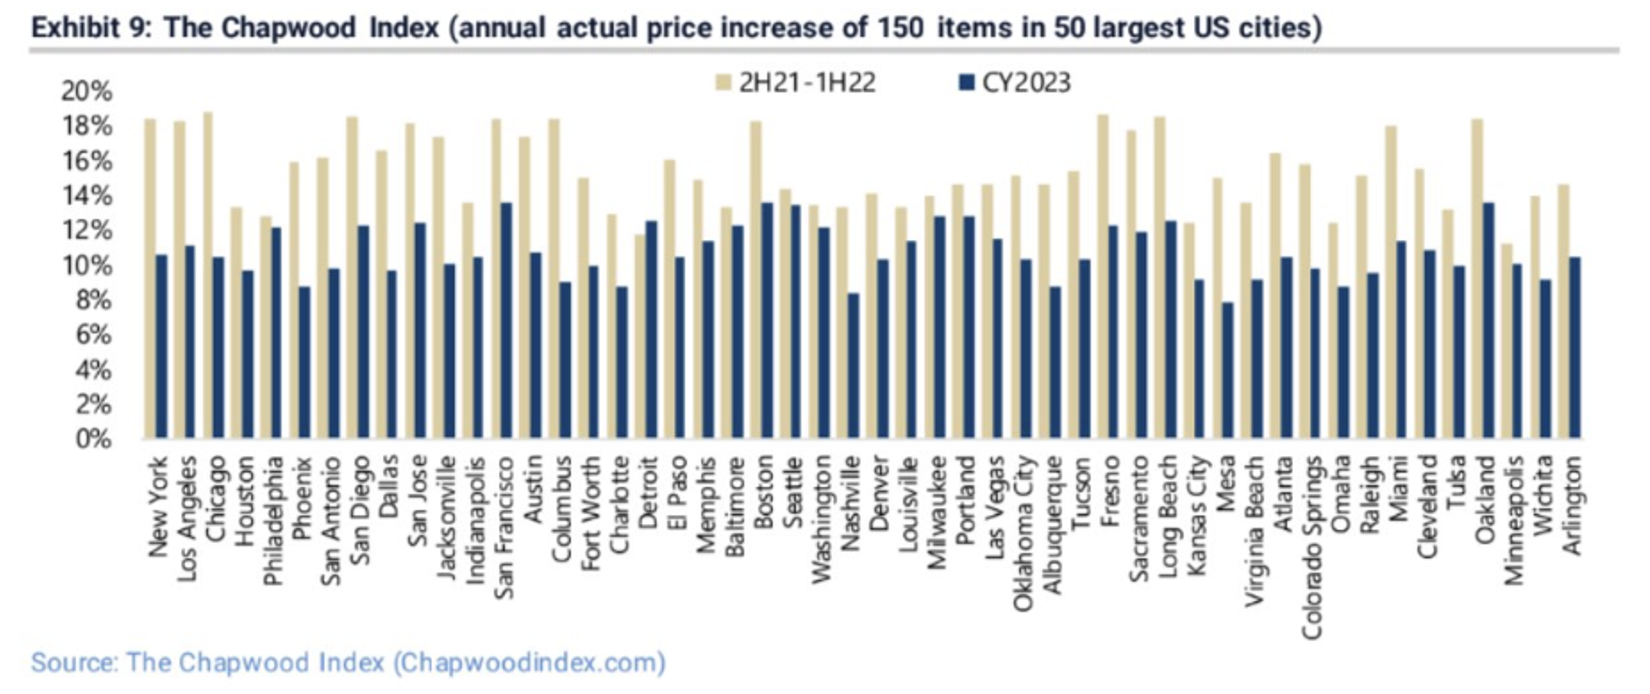
The Chapwood Index reflects the true cost-of-living increase in America. Updated and released twice a year, it reports the unadjusted actual cost and price fluctuation of the top 150 items on which Americans spend their after-tax dollars in the 50 largest cities in the nation. They argue that the CPI no longer measures the true increase required to maintain a constant standard of living.
Some of the components inside their index include Starbucks coffee, Advil, insurance, gasoline, sales and income taxes, tolls, fast food restaurants, toothpaste, oil changes, car washes, pizza, cable TV and Internet service, cellphone service, dry cleaning, movie tickets, cosmetics, gym memberships, home repairs, piano lessons, laundry detergent, light bulbs, school supplies, parking meters, pet food, underwear and People magazine.
 Source: https://chapwoodindex.com/ as of 06.22.2024
Bottom line, the Chapwood Index shows the actual costs of the top 150 items Americans buy in the 50 largest cities rose between 7.8%-13.6% last year. In 2022, the range was between 11.3%-18.8%. Unfortunately, my wallet agrees more with this data than the government’s CPI data!
Bond Market Volatility Has Declined But is Still Elevated
The MOVE index has been closely followed by bond investors as a gauge of the underlying stress of the rates market. We’ve described the MOVE index as essentially the VIX but for bonds.
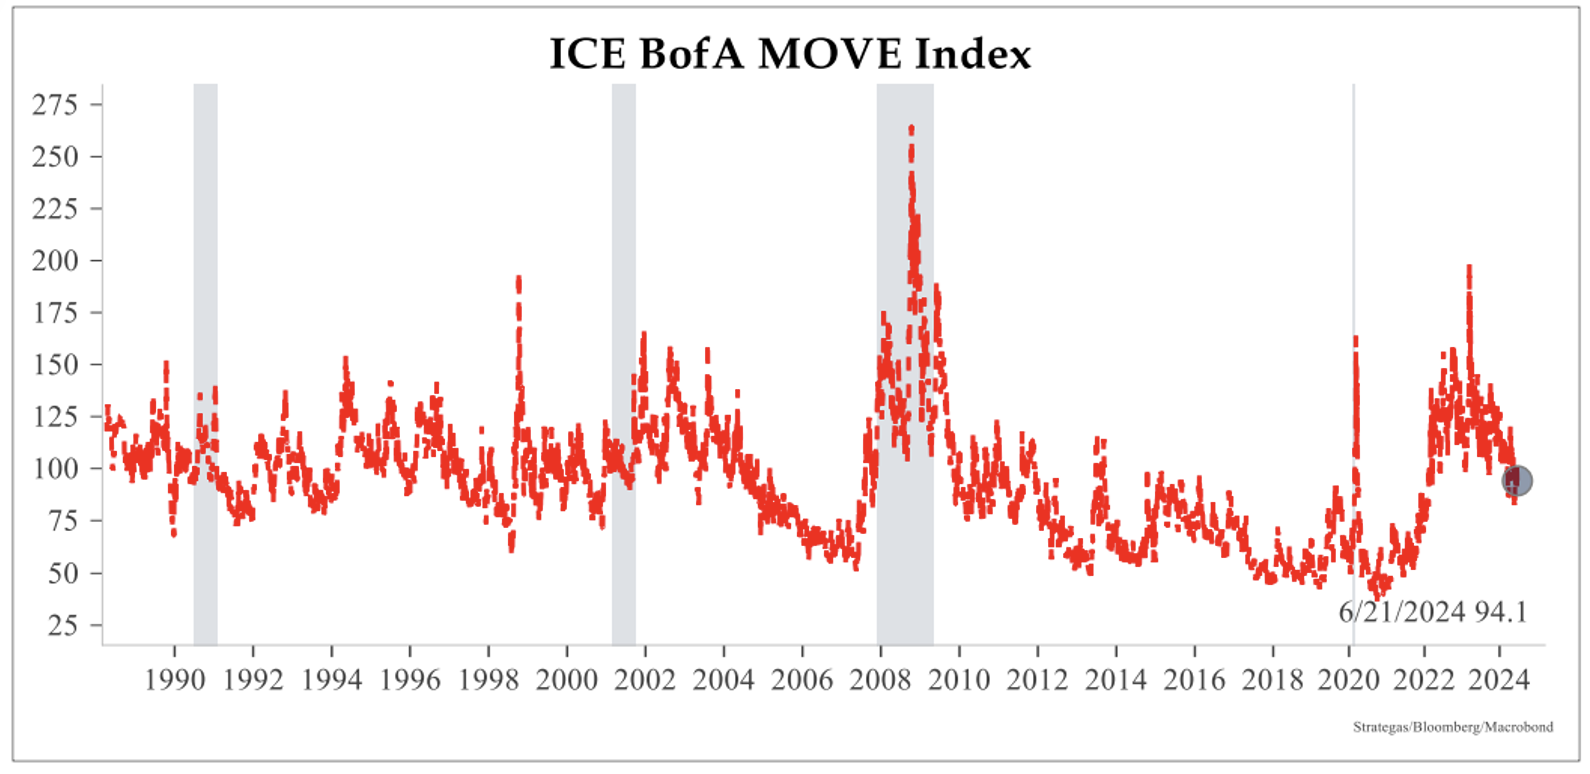 Source: Strategas as of 06.24.2024
Unsurprisingly, the index has been quite volatile throughout the Fed’s hiking cycle. Typically, we view a reading of >120 to be of concern to markets and an area that increases the volatility premium associated with Treasury bonds. While the index is below 100 (~94 currently), it still signifies elevated risk in the market. We’d narrow it down to a couple of factors such as lingering inflation issues, structurally higher deficits (and in turn issuance), and implications of USD strength on the global economy.
Real Returns Matter!
If there was a chart that displayed the Aptus mantra of “More Stocks, Less Bonds” better than the one below (thanks Brian Jacobs!) I’d love to see it.
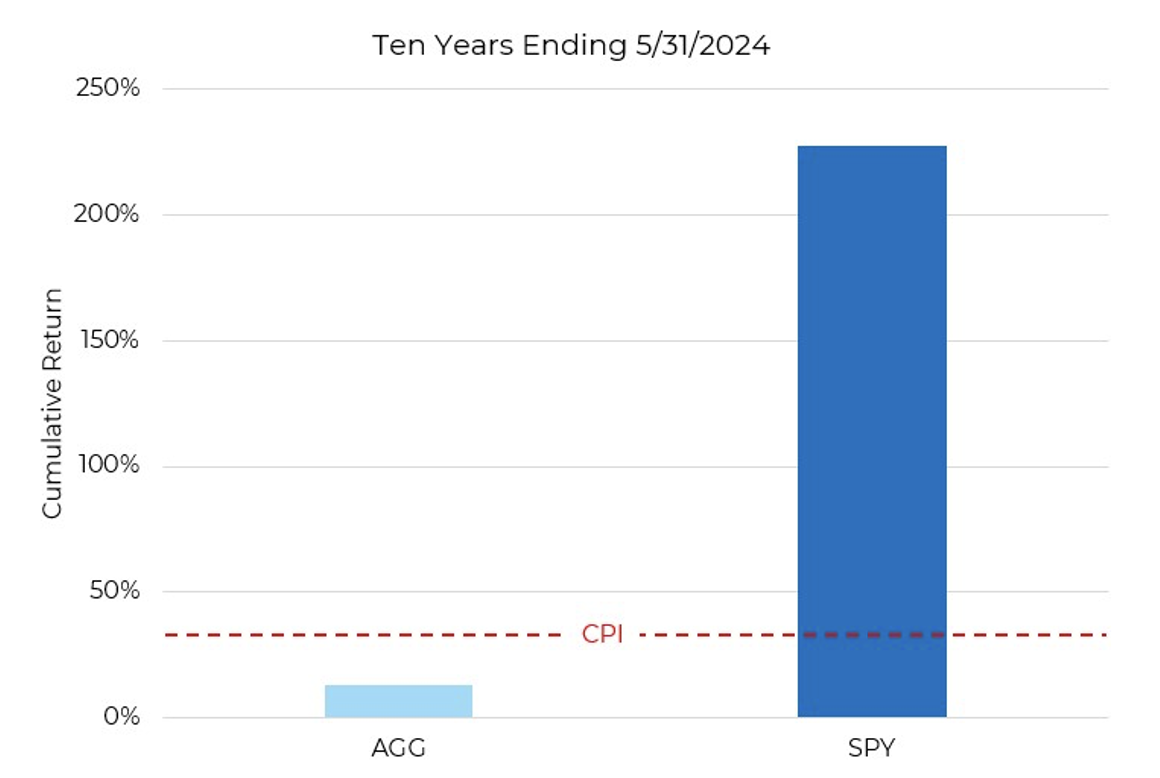 Source: Aptus as of 06.25.2024
At the end of the day, real returns are all that matters for an investor’s long-term success. For the past 10 years, bonds have truly been certificates of confiscation on purchasing power. While higher nominal yields help reduce the price volatility of bonds (specifically short-term bonds), if the yield on a bond is lower than inflation (possibly substantially below inflation levels), you are giving away your purchasing power to the lender.
We couldn’t have more conviction that portfolio construction from 2020 and beyond will need to look quite different than it did from 2000 into COVID!
Disclosures
Past performance is not indicative of future results. This material is not financial advice or an offer to sell any product. The information contained herein should not be considered a recommendation to purchase or sell any particular security. Forward looking statements cannot be guaranteed.
This commentary offers generalized research, not personalized investment advice. It is for informational purposes only and does not constitute a complete description of our investment services or performance. Nothing in this commentary should be interpreted to state or imply that past results are an indication of future investment returns. All investments involve risk and unless otherwise stated, are not guaranteed. Be sure to consult with an investment & tax professional before implementing any investment strategy. Investing involves risk. Principal loss is possible.
Advisory services are offered through Aptus Capital Advisors, LLC, a Registered Investment Adviser registered with the Securities and Exchange Commission. Registration does not imply a certain level or skill or training. More information about the advisor, its investment strategies and objectives, is included in the firm’s Form ADV Part 2, which can be obtained, at no charge, by calling (251) 517-7198. Aptus Capital Advisors, LLC is headquartered in Fairhope, Alabama. ACA-2406-24.
