QT Slowly Eating Away Liquidity
Even with the spike in the Fed’s Balance sheet following the SIVB (Silicon Valley Bank) collapse, QT is still quietly going on in the background. The Fed has stayed course in their communication of the importance of shrinking their balance sheet.
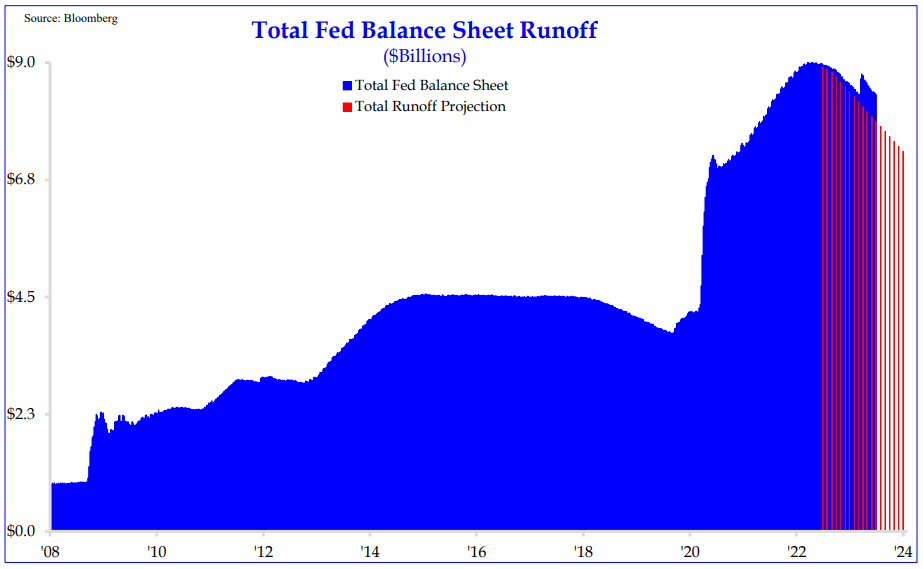 Source: Strategas as of 07.03.2023
We’d argue that the decline to this point has had little effect on the real economy.
Refilling the TGA
Approximately $400bn of the expected $1tn of T-bills have been issued over recent weeks. This level of debt issuance with a rising debt servicing cost is something we’ve not seen in 30 years. Prior to the debt ceiling, the TGA drain was offsetting a large chunk of the impact from QT.
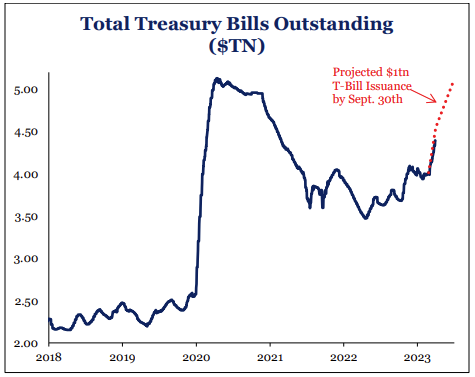 Source: Strategas as of 07.03.2023
That is no longer the case. With QT maintaining at ~$95bn a month and the Treasury only funding half of its debt out of Reverse Repos (RRR), we expect bank reserves to decline, further tightening liquidity.
To put this more bluntly: the Treasury is working incredibly hard to avoid the liquidity drain (by issuing T-bills that the market is mopping up), but this only exacerbates the long-term problem: net interest costs are increasingly crowding out the rest of the federal budget.
We’re running a deficit at close to 8% of GDP (crisis level). Interest costs as a % of tax receipts are around 13%…typically at 14% markets impose austerity. We would not be surprised to see a return of the bond vigilantes in the back half of 2023.
Inflation Bottoming?
The June inflation print is coming on 7/12. The survey is expecting headline inflation to drop a full 100bps to 3.00% YoY number. They are also expecting a modest decline YoY in the core print to 5.0%.
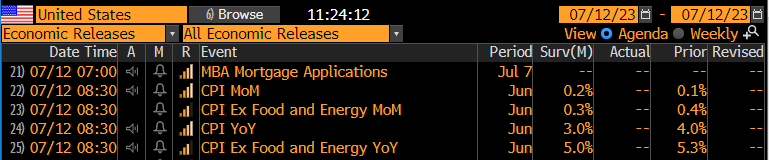 Source: Bloomberg as of 07.03.2023
It’s progress. BUT, it appears to be bottoming. As we’ve reminded readers since early this year, the largest prints from inflation came last year following the Russia/Ukraine situation where energy and food prices skyrocketed.
As the YoY comps roll off (June 2022 is the last large one), the comps become very easy and unless month over month (MoM) inflation moderates drastically, inflation is likely to start poking higher.
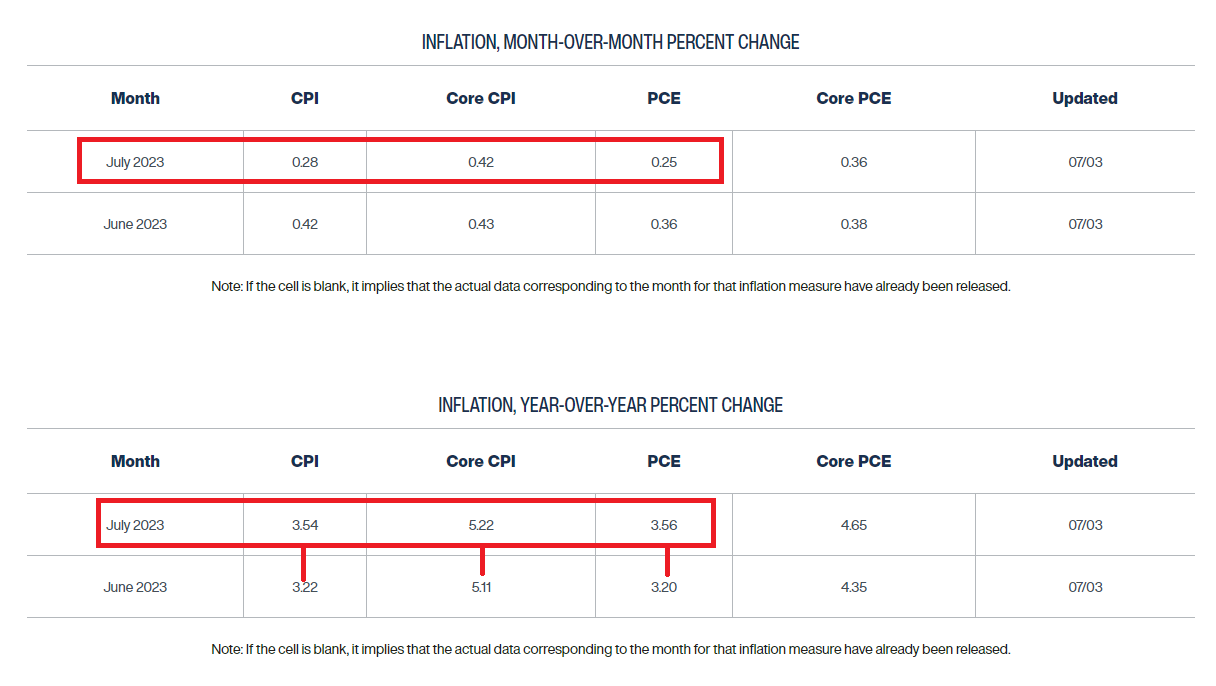 Source: Cleveland Fed as of 07.03.2023
This would be problematic for the Fed. The Cleveland Fed highlights this above in their July survey, showing inflation ticking back higher. Can the Fed continue to pause their rate hike campaign if headline inflation starts creeping back toward 4% (or higher) and core inflation is sticky at 5%?
One of our biggest unanswered questions is how long the Fed can get away with letting inflation run hot. Financial repression (negative real rates) benefits the government because it grinds away the real cost of the debt (at the expense of the lender).
Hotter inflation 3-4% is beneficial to asset owners as asset prices (equities, real estate, etc.) typically rise faster than inflation. The danger of this policy is the bulk of Americans don’t own financial assets or have 2-3% mortgage rates that benefit from inflation. They are having their real spending power eroded because they live paycheck to paycheck and have no assets to offset the general increase in cost of living.
A recent survey shows that 40% of Americans can’t afford a $1000 emergency. The risk of letting inflation run hot for too long can lead to bad outcomes where lower- and middle-class Americans revolt as the wealth gap continues to rise. As Jason Trennart from Strategas puts it, “At some point the bill for QE and ZIRP comes due”.
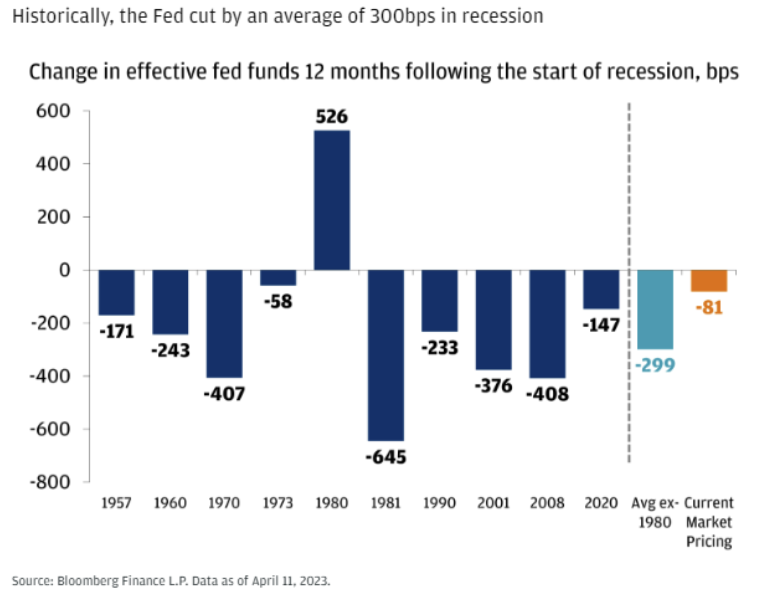
Investors are Stuck Between Higher For Longer and Massive Rate Cuts
Investors continue to expect rate cuts far quicker than what the Fed is communicating. The market is pricing in ~80bps of rate cuts over the next 12 months. However, in the average recession dating back to the 1950s, the Fed has cut rates by an average of 300bps (excluding the 80s).
Source: JPM as of 07.03.2023
Bond bulls are betting that in the event of a cutting cycle (recession), the cuts will be deeper than the market is pricing in, buoying the price return of bonds. However, if inflation remains elevated, we see little choice but for the Fed to keep rates higher for longer.
Sticky Core Inflation Thorn in Central Bankers Side
Over the last 6 months, Core PCE has averaged 4.6%, showing little improvement for the Fed. On top of that, wage Inflation continues to run at levels historically associated with >2% inflation.
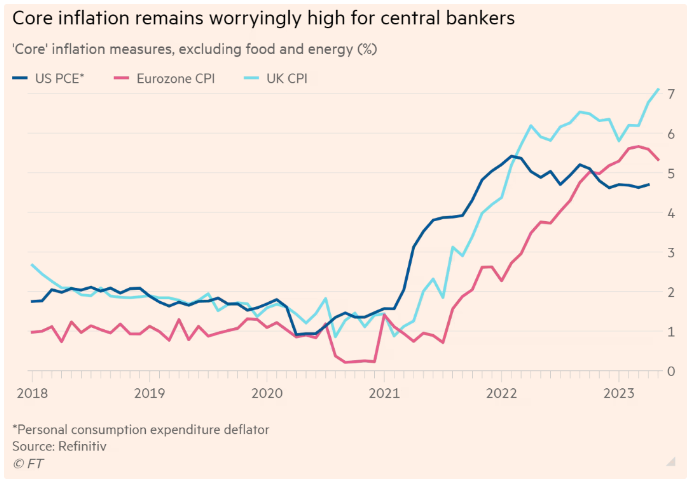 Source: Financial Times as of 06.30.2023
For instance, the Employment Cost Index (ECI) is growing at 4.8%, the Atlanta Fed Tracker Job Stayer Index is running at 5.7% & the Atlanta Fed Job Switcher Index at 6.8%. This is too high for the Fed’s 2% mandate.
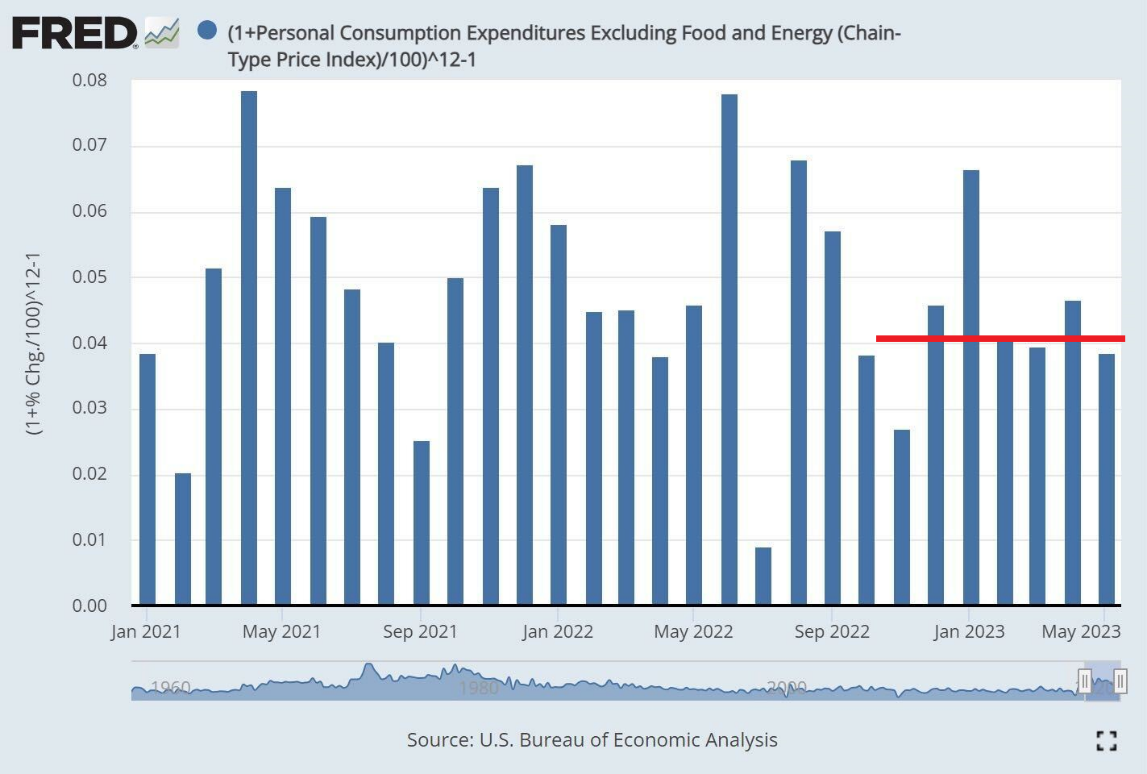 Source: Fred as of 06.30.2023
How Much Higher Can Yields Go?
The economy has remained resilient while the labor market is historically tight. Inflation continues to run well above target. Given those facts, it’s likely the Federal Reserve will have to take short-term interest rates higher and hold them higher for longer.
Average inflation is a key component of longer-term bond yields and is almost assuredly higher than the Fed’s 2% target (Powell confirmed last week). In addition, the general risk premium added to the yield of government bonds over the expected future short-term rate is also likely to move higher.
Putting the pieces together: If the Fed’s short-term interest-rate target, adjusted for inflation, averages at 1% over the next decade, inflation averages ~2.5%, and the bond risk premium is one percentage point (historically accurate), this simple math suggests a 10-year Treasury note should yield somewhere between 4 and 5%.
Disclosures
Past performance is not indicative of future results. This material is not financial advice or an offer to sell any product. The information contained herein should not be considered a recommendation to purchase or sell any particular security. Forward looking statements cannot be guaranteed.
This commentary offers generalized research, not personalized investment advice. It is for informational purposes only and does not constitute a complete description of our investment services or performance. Nothing in this commentary should be interpreted to state or imply that past results are an indication of future investment returns. All investments involve risk and unless otherwise stated, are not guaranteed. Be sure to consult with an investment & tax professional before implementing any investment strategy. Investing involves risk. Principal loss is possible.
Advisory services are offered through Aptus Capital Advisors, LLC, a Registered Investment Adviser registered with the Securities and Exchange Commission. Registration does not imply a certain level or skill or training. More information about the advisor, its investment strategies and objectives, is included in the firm’s Form ADV Part 2, which can be obtained, at no charge, by calling (251) 517-7198. Aptus Capital Advisors, LLC is headquartered in Fairhope, Alabama. ACA-2307-12.
