Another Stubborn CPI Report Likely Pressures Fed to Maintain Hikes
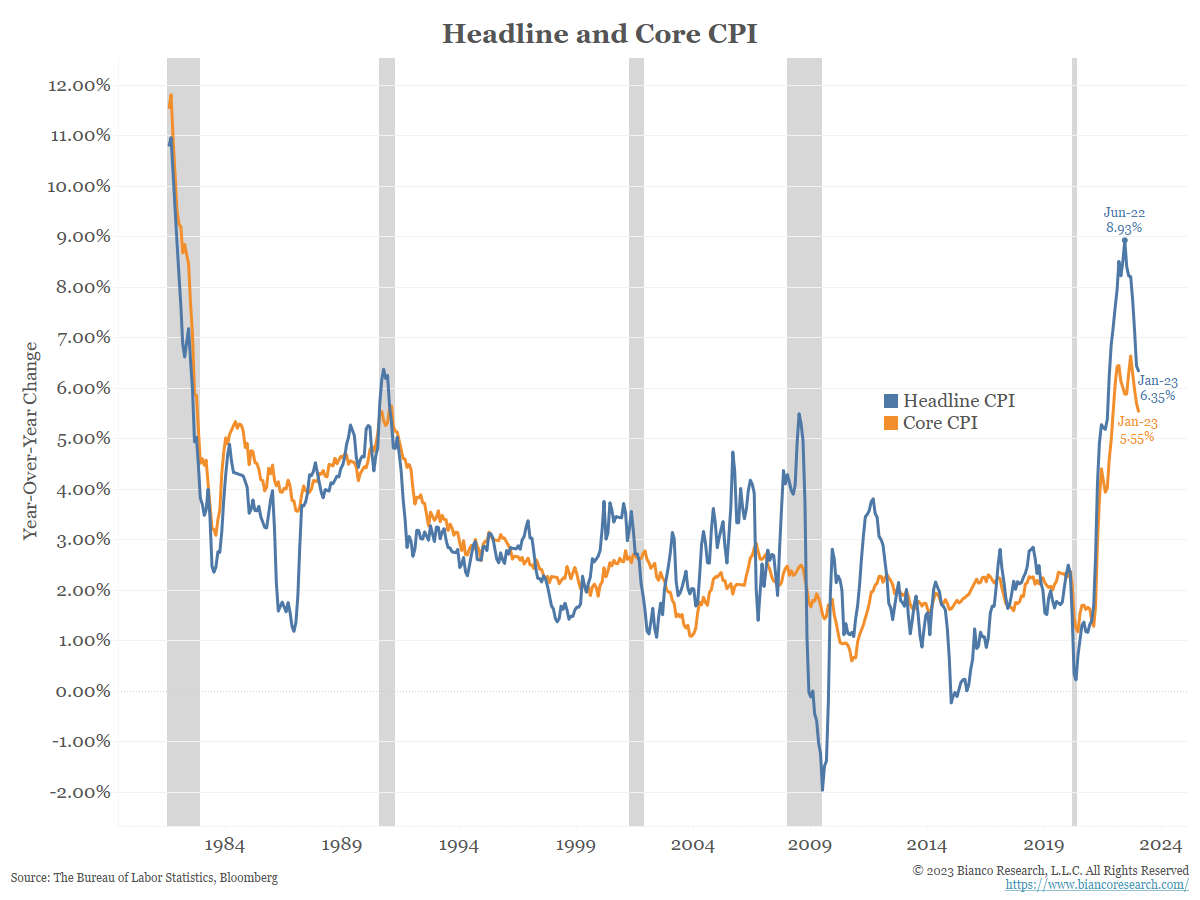
The BLS’s latest inflation figures published this morning showed consumer prices rose 6.4% Y/Y in January, slightly higher than consensus. From a high-level view it was a fairly status quo report but after digging into the weeds there was a concerning level of acceleration and stickiness.
Source: Bianco. As of 2/14/23.
Inflation is Falling… Question is How Fast?
The celebrated Y/Y CPI’s fast descent the past several months did take a bit of a pause following this morning’s release. So, while the report was concerning it does not change the fact that inflation will likely continue to fall for the next five months given the HUGE comps from last year. Our focus is now on how fast these numbers will fall, rather than the simple fact that they are falling. High comps in addition to the change to the calculation method (CPI) and we could see some noteworthy changes.
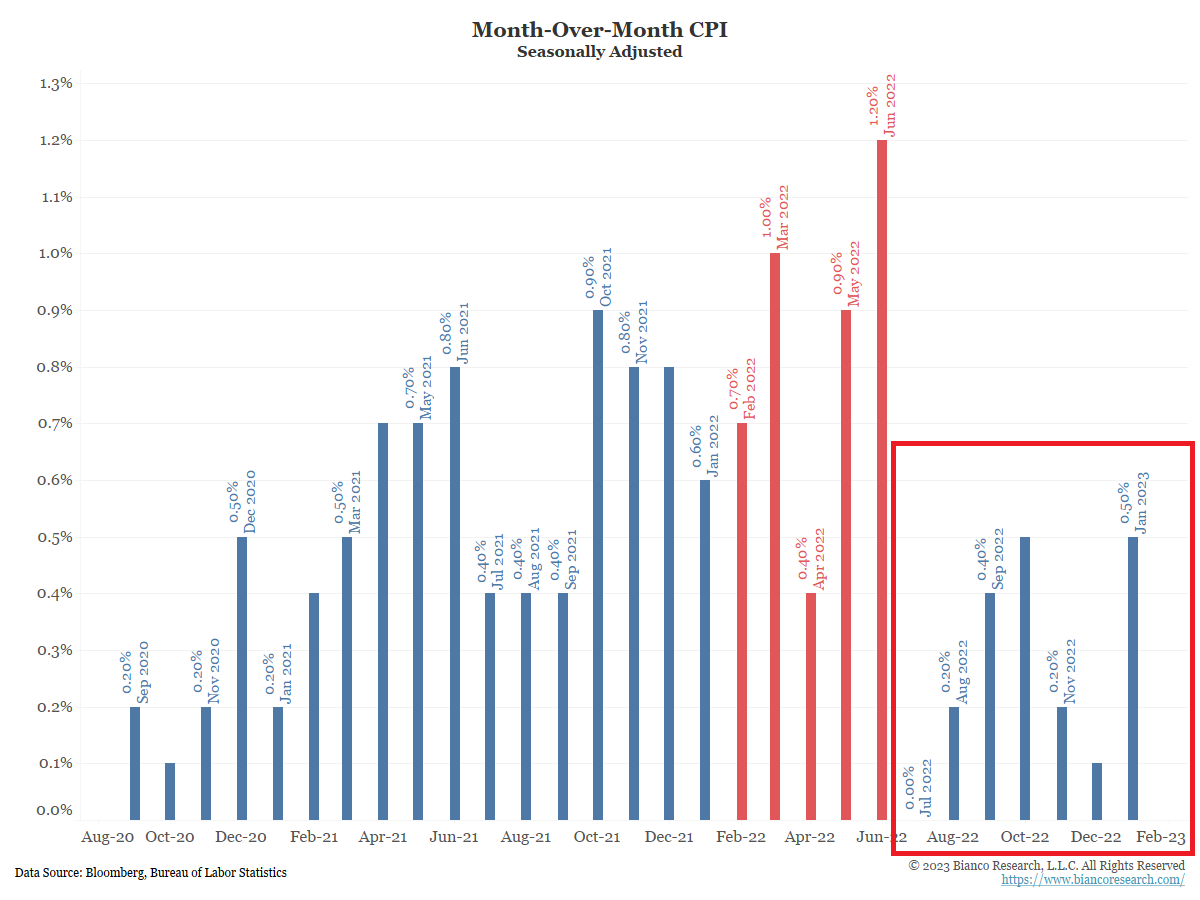
Tough Comps End in June
Between February 2022 and June 2022 (red), the M/M change in CPI was much higher than in the 2020 period. This means the current monthly numbers will have a much higher bar to surpass if inflation is going to remain elevated. This month’s 0.5% M/M change replaced a 0.6% M/M change from January 2022, which helps explain the slight drop in Y/Y headline inflation. The narrative quickly changes in July. Note the M/M (shown above in red box) changes between July and December 2022 were much lower.
Source: Bianco. As of 2/14/23.
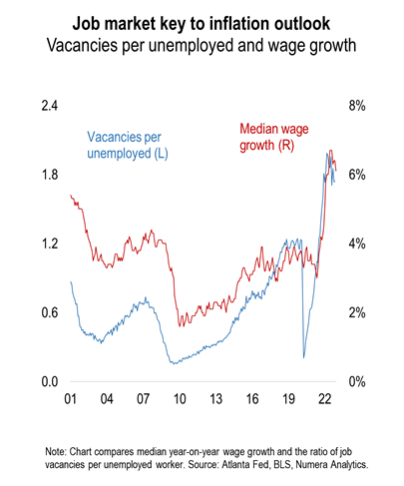
It All Comes Down to the Jobs Market
The report continued to highlight the potential stickiness of pricing pressures. This largely reflects still-elevated wage pressures and a labor market that remains remarkably tight even as cyclical conditions are slowing (3.4% Unemployment Rate/ +517K Jobs per the last NFP Report). Consumers still have jobs to maintain spending while also having incredible bargaining power with employers to seek wage increases. Wage growth near 5% makes a difficult environment for the Fed to squash inflationary pressures.
Source: Numera. As of 2/14/23.
Shelter Inflation… A Big Pain for the Fed
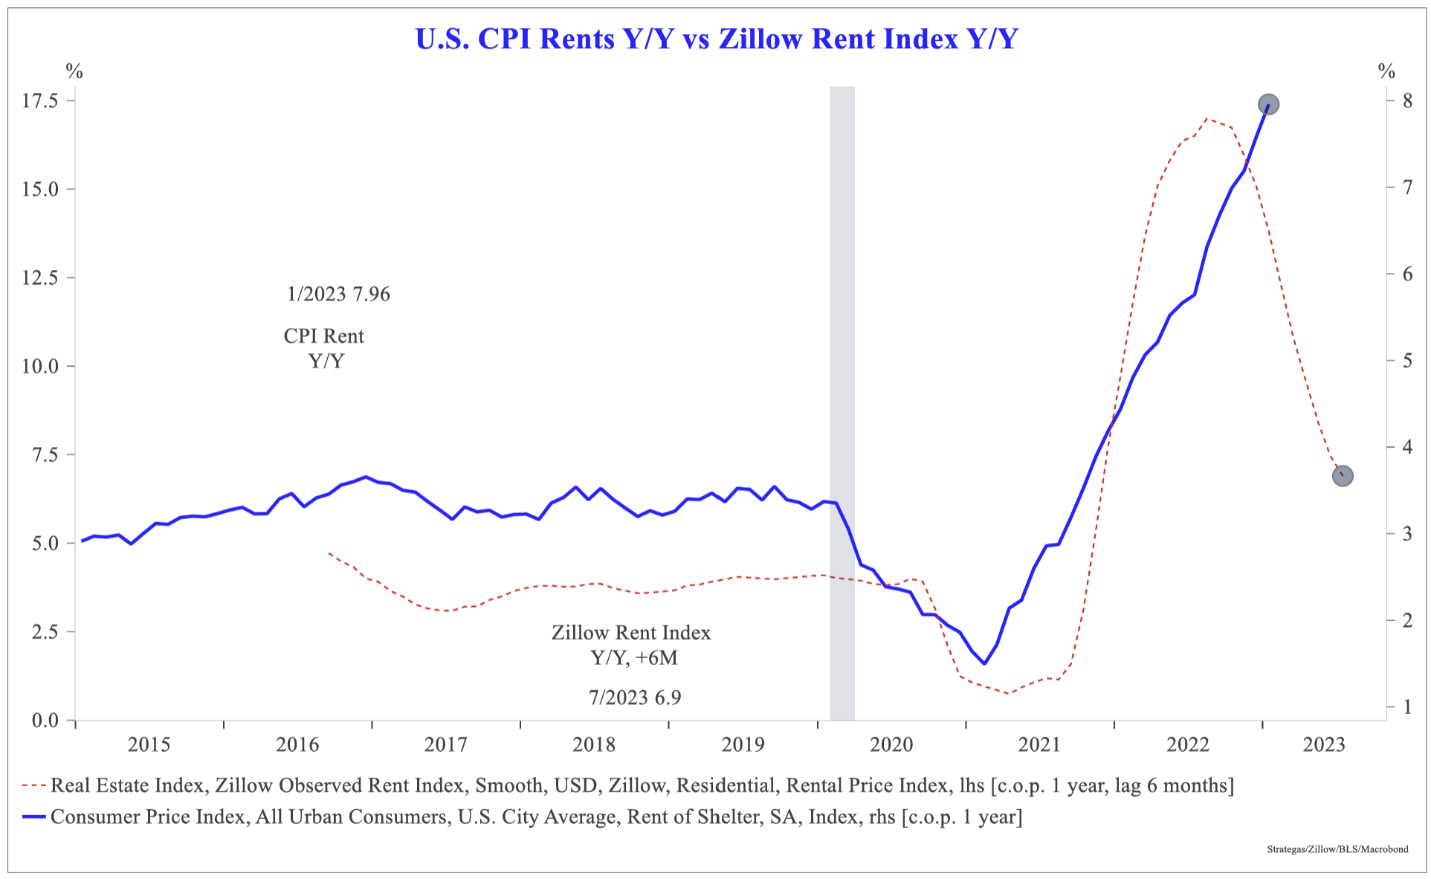
We have been talking about shelter cost inflation since late 2020. The Fed ignored the rise in home prices on the way up as the Fed subsidized mortgage rates via QE. Now they are paying the price… shelter costs make up a 34.4% weighting of CPI and thus those trends significantly impact CPI.
Shelter costs continued to trend higher, up +0.74% M/M and ACCELERATED TO +7.88% Y/Y (versus +7.51% prior).
The components of shelter are as follows:
- Rent of Primary Residence increased +0.74% M/M and ACCELERATED to +8.56% Y/Y (versus +8.35% Y/Y prior)
- Owners’ Equivalent Rent (OER) increased +0.67% M/M and ACCELERATED to +7.78% Y/Y (versus +7.55% Y/Y prior).
- Lodging Away from Home increased +1.20% M/M and ACCELERATED to +7.69% Y/Y (versus +3.18% Y/Y prior)
Source: Strategas. As of 2/14/23.
While market-based proxies have turned down, that data won’t begin to feed into the calculation until Q2. How quickly this turns down will have large implications on the terminal rate and the level of “higher for longer”.
Not Seeing True, Widespread Disinflation Yet
At the last press conference, Powell declared that the process of disinflation is well under way in core goods and is starting in housing, though it has not yet begun in services ex-housing. Today’s report showed no signs of easing in service or housing inflation, and deflationary pressures in goods appear to be abating.
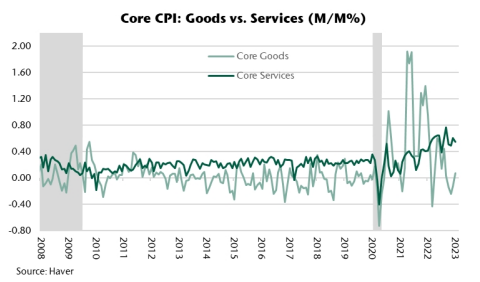
Source: Jefferies. As of 2/14/23.
Chair Powell has repeatedly warned that the longer inflation lingers above target, the more risk of an unmooring of long-term inflation expectations and consumer psychology regarding price stability (or lack thereof). To that point, the inflation volatility we continue to experience itself remains elevated. And based on today’s number, that uncertainty will not abate anytime soon.
Conclusion
Today’s report coupled with the revisions announced last Friday paint a picture of inflation that’s very sticky at the core, and no longer slowing rapidly around the edges. Higher uncertainty about price pressures will keep the Fed uneasy, which should beget more uncertainty about where policy is headed this cycle.
We still expect a 25-bp hike in both March and May, which would take the target range to between 5% and 5.25%. The toss-up about the March 21 meeting remains whether they signal another 25-bp for June, mostly likely by retaining the “ongoing increases” clause in their latest statement. To be sure, and after this report, they’ll use their communication tools to dim hopes of any rate cuts this year and to stress that policy must stay restrictive for some time.
Disclosures
Past performance is not indicative of future results. This material is not financial advice or an offer to sell any product. The information contained herein should not be considered a recommendation to purchase or sell any particular security. Forward looking statements cannot be guaranteed.
This commentary offers generalized research, not personalized investment advice. It is for informational purposes only and does not constitute a complete description of our investment services or performance. Nothing in this commentary should be interpreted to state or imply that past results are an indication of future investment returns. All investments involve risk and unless otherwise stated, are not guaranteed. Be sure to consult with an investment & tax professional before implementing any investment strategy. Investing involves risk. Principal loss is possible.
The Core Consumer Price Index (CPI) measures the changes in the price of goods and services, excluding food and energy. The CPI measures price change from the perspective of the consumer. It is a key way to measure changes in purchasing trends and inflation.
The Zillow Rent Index (ZRI) is a dollar-valued index intended to capture typical market rent for a given segment (IE, multifamily or single-family units) and/or geography (IE for a given ZIP code, city, county, state or metro) by leveraging Rent Zestimates.
The content and/or when a page is marked “Advisor Use Only” or “For Institutional Use”, the content is only intended for financial advisors, consultants, or existing and prospective institutional investors of Aptus. These materials have not been written or approved for a retail audience or use in mind and should not be distributed to retail investors. Any distribution to retail investors by a registered investment adviser may violate the new Marketing Rule under the Investment Advisers Act. If you choose to utilize or cite material we recommend the citation, be presented in context, with similar footnotes in the material and appropriate sourcing to Aptus and/or any other author or source references. This is notwithstanding any considerations or customizations with regards to your operations, based on your own compliance process, and compliance review with the marketing rule effective November 4, 2022.
Advisory services are offered through Aptus Capital Advisors, LLC, a Registered Investment Adviser registered with the Securities and Exchange Commission. Registration does not imply a certain level or skill or training. More information about the advisor, its investment strategies and objectives, is included in the firm’s Form ADV Part 2, which can be obtained, at no charge, by calling (251) 517-7198. Aptus Capital Advisors, LLC is headquartered in Fairhope, Alabama. ACA-2302-17.

