Market is Pricing in Six Rates Cuts in 2024
Currently, Fed Funds traders are pricing in six cuts (shown below in orange) by the end of 2024. Keep in mind that the Fed projected just three cuts in its latest Summary of Economic Projections (shown below in blue).
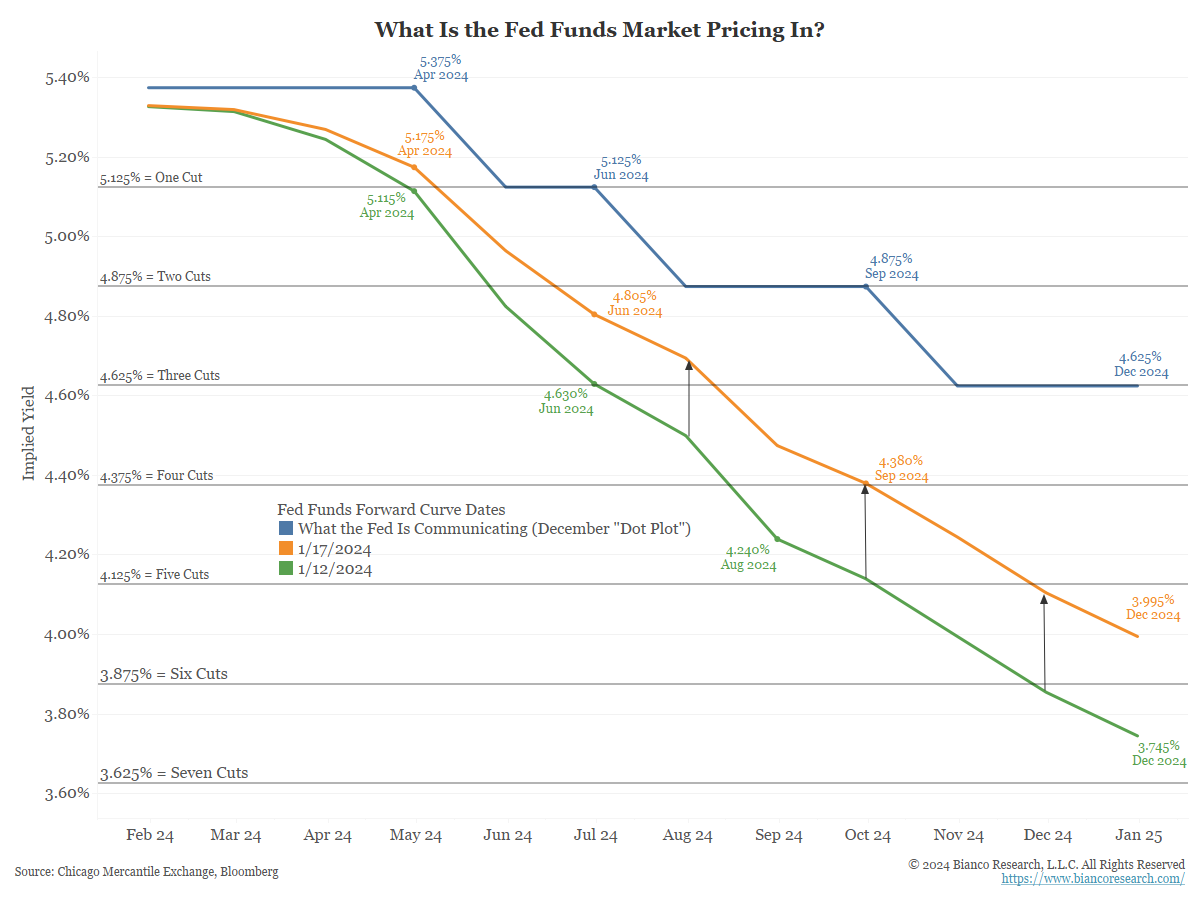 Source: Bianco as of 01.17.2024
Yesterday, Federal Reserve Governor Christopher Waller spoke at an event hosted by the Brookings Institution, where he noted that policymakers would proceed with any cuts “methodically and carefully”. His comments pushed yields higher.
As 2024 unfolds, policymakers will likely get a couple of inflation reports that make them nervous, either because inflation is reaccelerating or because of data quirks (seasonal adjustment issues, one-off spikes, etc.). Those reports as well as limited time for bad data to come across (we think it’s unlikely to get enough bad data to get a March cut as it’s only 2 months away) should force them to proceed carefully.
We continue to align more closely with the SEP projection of 75 basis points of rate cuts in 2024. That seems more likely than the six the market is currently pricing in, barring severe economic degradation.
Fiscal Deficits Continue to Surprise to the Upside
The US is running (and is expected to continue running) larger deficits than the rest of the world as a percentage of GDP. The US federal fiscal deficit ran at a (hot) $2.2 trillion annual rate in fiscal 1Q24. The deficit is growing faster than GDP and now sits at over 7.5% of GDP. We haven’t seen these deficit levels outside of GFC and COVID in recent history.
 Source: Bloomberg as of 01.13.2024
Currently, the cost of servicing the debt is now over 16% of all federal tax proceeds. With higher deficits on top of a higher cost of servicing the deficits, the ability of the economy to shoulder the cost of the federal debt is growing more difficult.
Banks are Gaming the BTFP Facility
The Fed’s Bank Term Funding Program (BTFP), established as an emergency program, was implemented following the collapse of several regional banks last March. The facility was set in place as a short-term, systemic backstop to prevent a regional bank crisis with systemic and macroeconomic consequences. Michael Barr, the Fed’s Vice-Chair for Banking Supervision, has indicated it is unlikely the facility would be re-upped come March 11th, 2024. Banks have gamed usage of the facility for arbitrage. Banks can get loans at a low rate (blue) and receive interest on that money at a higher rate (in green below).
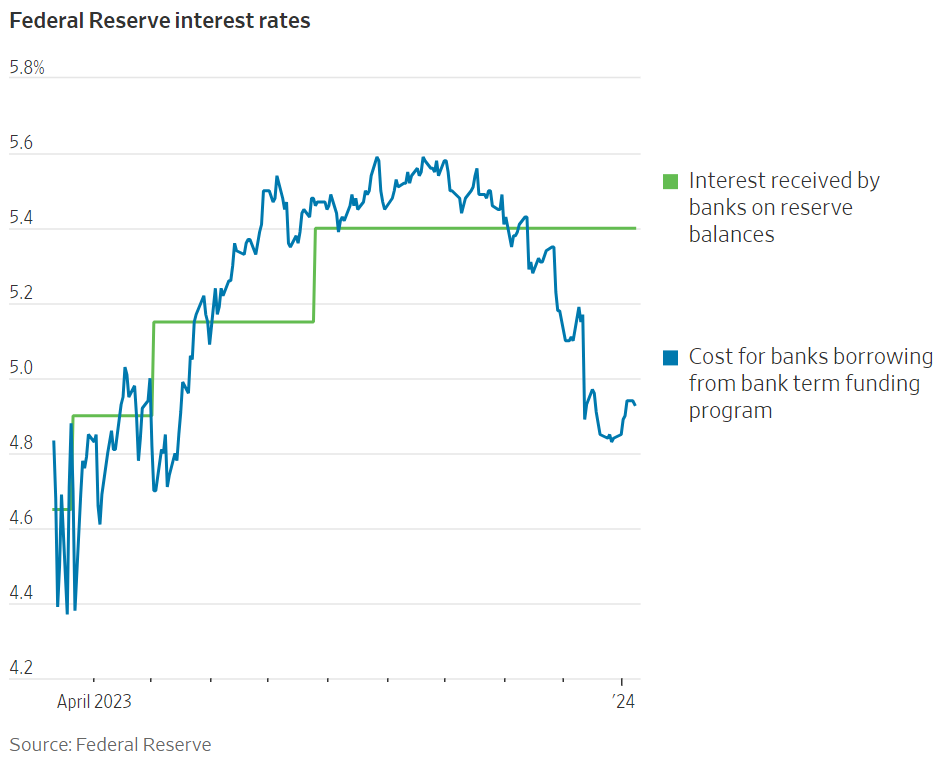 Source: WSJ as of 01.13.2024
As with much of what the Fed has done in recent years, the BTFP had profound unintended consequences for market functioning and created a near risk-free profit center for banks.
Good Inflation is Driving Inflation Lower, Unlikely to Continue
For 30 years, flat goods prices and 3% service inflation delivered a 2% Core, and the Fed focused on this mix in spinning policy. Core looks good because of deflating goods prices — service inflation (with or without rent) remains far above 2%. Goods prices can continue to deflate in the near term, but not forever. The extent of the current divergence is evident in Chart 1.
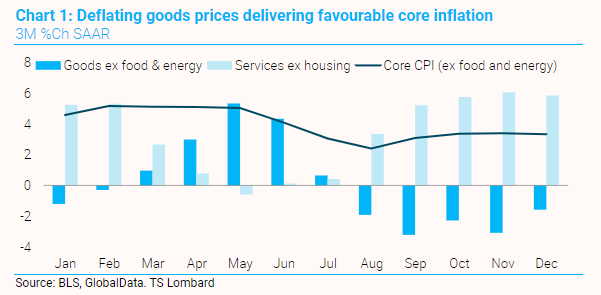 Source: TS Lombard as of 01.14.2024
We think it’s reasonable to assume goods (barring a recession) will be on the upswing later this year. In other words, if the economy fails to slow enough in the first half of 2024 to pull down service inflation, an inflation problem could lurk for the second half of 2024.
Positive Stock/ Bond Correlation
AQR published a research paper last year in the Journal of Portfolio Management titled A Changing Stock–Bond Correlation: Drivers and Implications. Importantly, they determined that the most important determinant of the stock/bond correlation is not the level of growth or inflation itself but the uncertainty regarding these macroeconomic factors. Quoting the paper:
“According to a simple model, the stock–bond correlation thus depends not on the level of inflation, but on the relative volatility of growth and inflation and the correlation between them.”
If consumers are experiencing inflation, they are more likely to expect inflation in the future. When inflation expectations increase, the possibility of declining real growth (nominal growth less inflation) begins to alter future growth expectations.
The chart below shows the 10-year yield in red and the S&P 500 in blue (top panel). The bottom panel shows these two series’ rolling 3-year (light green) and 5-year correlations (dark green).
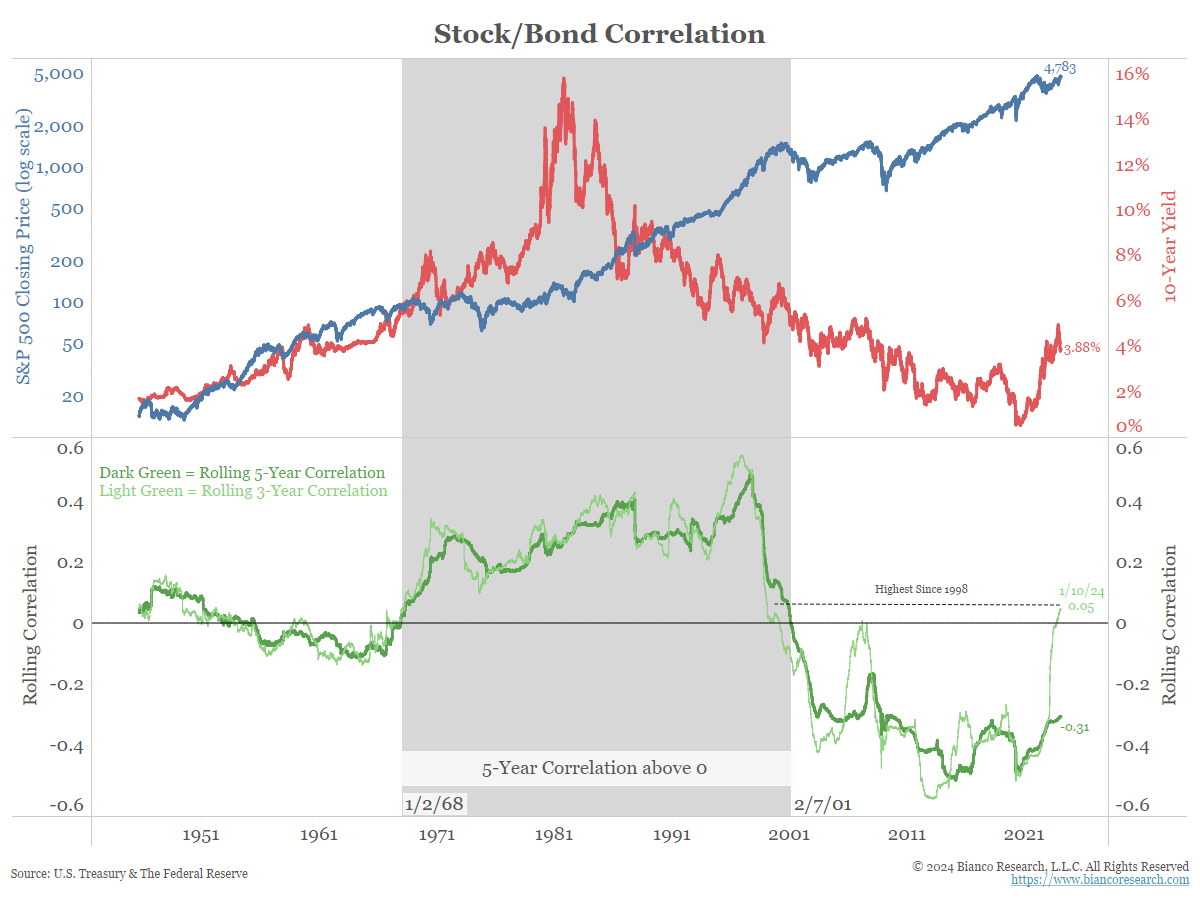 Source: Bianco as of 01.14.2024
The 3-year series has flipped positive, which could create consequences for how investors view fixed income in the context of their portfolio construction process given its correlation profile to risk assets.
As an example, on Tuesday TLT was down roughly 2%. That is a daily move the SPX has experienced only a few times in the past year. Remarkably, of the twenty-three 2% down days in the TLT since 2022, every single one of them has been on an SPX down day, where the index has experienced an average loss of 1%. It seems that for now, the bond market is acting as the risk asset where stocks then follow suit.
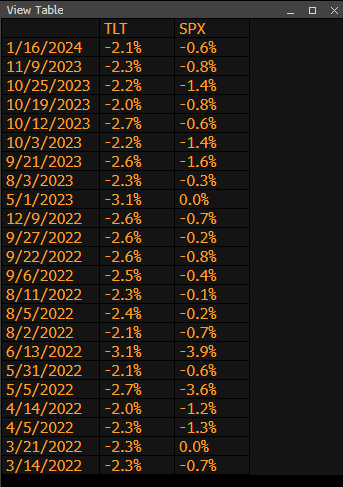 Source: Bloomberg/MRA as of 01.16.2024
Inflation Shocks Take Time to Settle
The IMF did a study where they analyzed 111 instances of inflation shocks across the globe. They found that it typically takes 3 years for inflation to return to within one percent of its pre-shock rate.
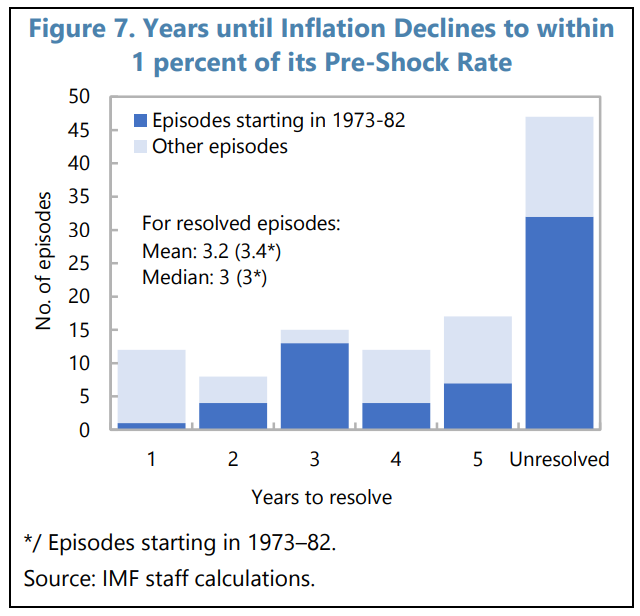 Source: IMF as of 01.17.2024
Only 11% of all episodes (12 out of 111) saw inflation return to ‘normal’ within a year. Roughly 42% of instances (47 out of 111) did not see inflation return to ‘normal’ within a five-year window. Interestingly, the IMF also notes in roughly 90% of unresolved inflation instances, inflation declined materially within the first three years after the initial shock, only to either plateau or re-accelerate.
Using the IMF’s definition, the most recent inflationary shock began in mid-2021, which would put the median return to ‘normal’ around mid-2024.
Disclosures
Past performance is not indicative of future results. This material is not financial advice or an offer to sell any product. The information contained herein should not be considered a recommendation to purchase or sell any particular security. Forward looking statements cannot be guaranteed.
This commentary offers generalized research, not personalized investment advice. It is for informational purposes only and does not constitute a complete description of our investment services or performance. Nothing in this commentary should be interpreted to state or imply that past results are an indication of future investment returns. All investments involve risk and unless otherwise stated, are not guaranteed. Be sure to consult with an investment & tax professional before implementing any investment strategy. Investing involves risk. Principal loss is possible.
Advisory services are offered through Aptus Capital Advisors, LLC, a Registered Investment Adviser registered with the Securities and Exchange Commission. Registration does not imply a certain level or skill or training. More information about the advisor, its investment strategies and objectives, is included in the firm’s Form ADV Part 2, which can be obtained, at no charge, by calling (251) 517-7198. Aptus Capital Advisors, LLC is headquartered in Fairhope, Alabama. ACA-2401-27.
