Year-over-year CPI declined in May, roughly in line with estimates:
Headline MoM: +0.1% (Expected: +0.1%)
Core MoM: +0.4% (Expected +0.4%)
Headline YoY: +4.0% (Expected: 4.0%)
Core YoY: +5.3% (Expecting 5.2%)
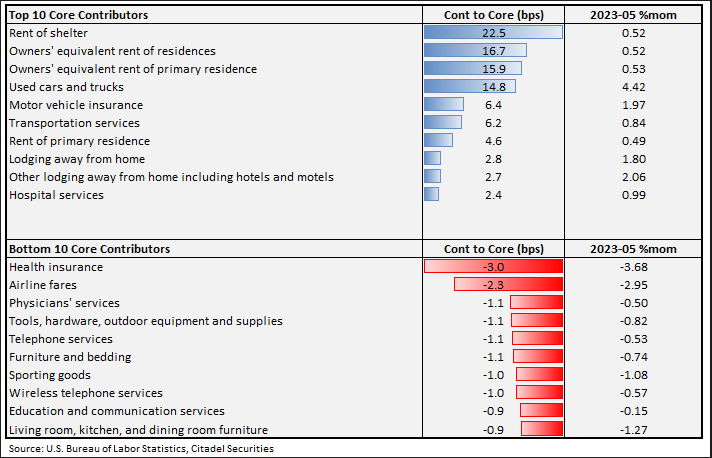
Top/Bottom Contributors:
 Source: Citadel as of 06.13.2023
Used cars topped almost all expectations at 4.42% MoM – contributing 15bps to Core. Shelter/ OER also continues to elevate core inflation although it’s slowing (albeit slowly).
Following the report, a Fed rate pause (in restrictive territory) in June looks locked in. But the Fed will likely keep optionality for a hike in July, should the data necessitate further tightening.
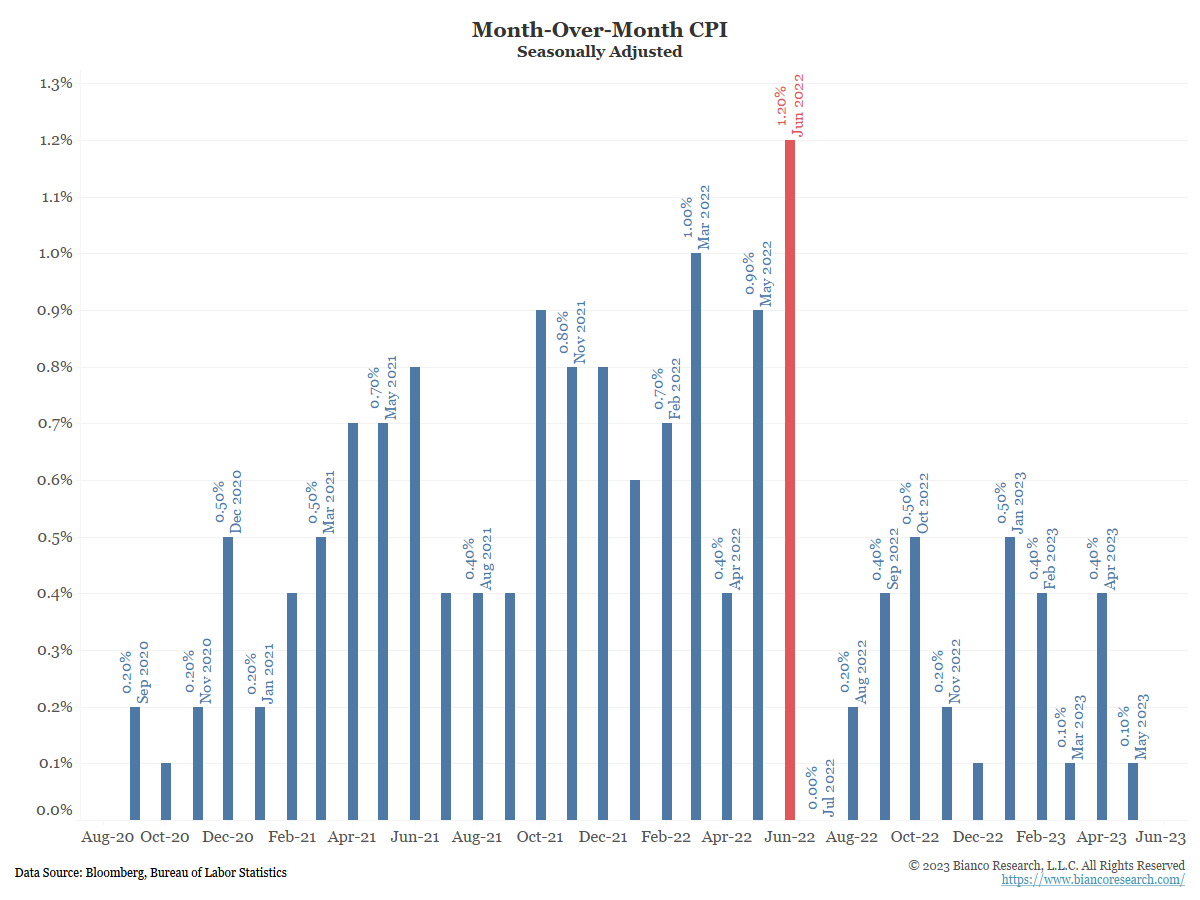
After the June print, the rubber truly meets the road on inflation. June’s CPI release (coming in July) will be the last of the string of large comps from last year to roll off, which has caused the YoY inflation numbers to fall by a large degree.
The million-dollar question is how low it can get before the year-ago numbers start to make a further decline more difficult. Inflation could creep higher again. With month-over-month CPI changes much lower between July and December 2022, the Fed may get tested again.
 Source: Bianco. As of 06.13.2023
Bianco Research ran through several scenarios and offers some perspective on inflation’s future growth rate. We thought the visuals were worth revisiting. The question is how close it will get to the Fed’s 2% goal by that time. Even the most benign scenario falls quite short, especially regarding the Core number.
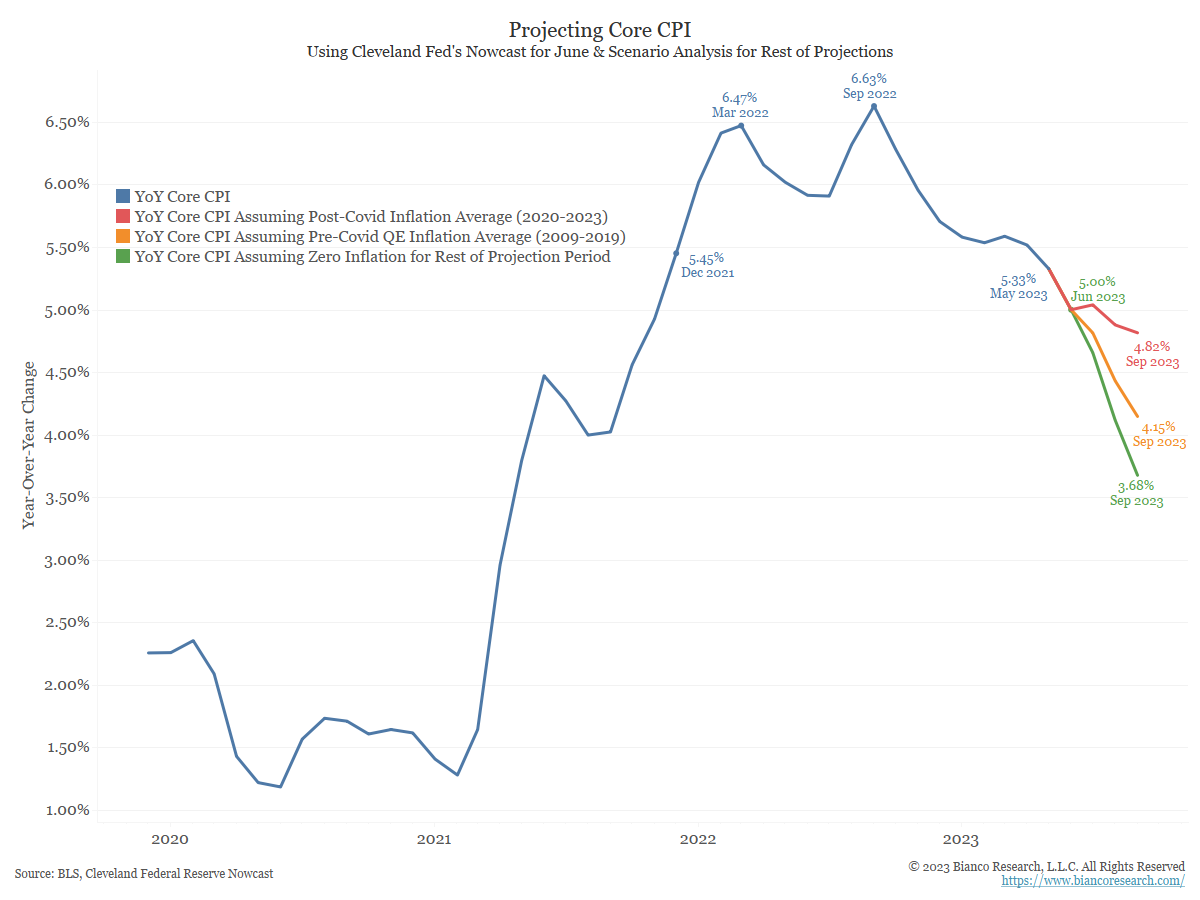
Projecting Core Inflation
 Source: Bianco. As of 06.13.2023
The blue line in the chart below shows year-over-year Core CPI, which rose by 5.33% in the twelve months through May 2023. For the scenarios below, we assume the Cleveland Fed’s CPI Nowcast of 0.43% month-over-month inflation for June will be correct.
The red line shows core CPI will hit 4.82% by September if inflation continues its post-Covid average. The orange line shows CPI would be 4.15% at the end of Q3 if the month-over-month releases equal pre-pandemic QE-era inflation. Finally, the green line shows CPI would be 3.68% by September 2023 if the month-over-month releases show 0% inflation between now and then.
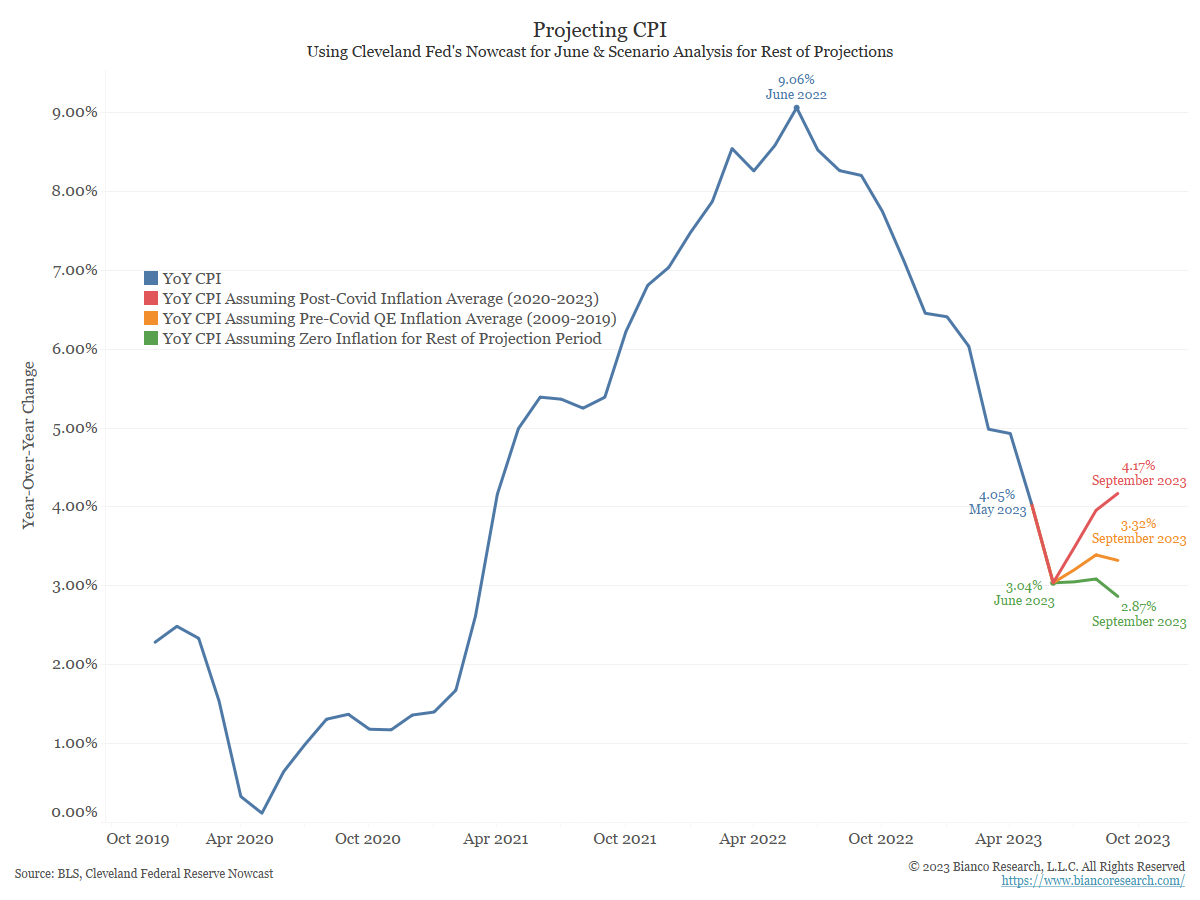
Projecting Headline Inflation
The analysis was also run on the headline numbers.
 Source: Bianco. As of 06.13.2023
The blue line in the chart above shows year-over-year CPI, which rose by 4.05% in the twelve months through May 2023. For the other scenarios, we assume the Cleveland Fed’s CPI Nowcast of 0.39% month-over-month inflation for June will be correct.
The red line shows CPI would hit 4.17% by September if inflation continues its post-Covid average. The orange line shows CPI would be 3.3% at the end of Q3 if the month-over-month releases equal pre-pandemic QE-era inflation. Finally, the green line shows CPI would be 2.87% by September 2023 if the month-over-month releases show 0% inflation between now and then.
Summary
The Fed is in a difficult spot. There were two articles that caught our eye recently that highlight the current positioning of the Fed. We highlighted the articles below (if you want the full version, let us know).
They’re between a rock and a hard place. It’s a very, very tough situation. You’re d*mned if you raise rates significantly more and put even more pressure on the banks, but you’re d*mned if you don’t” and inflation accelerates.
– Raghuram Rajan, a former governor of the Reserve Bank of India, June 2023
Federal Reserve Chair Jerome Powell finds himself in a place no central banker wants to be: working to avert a credit crunch, which calls for looser monetary policy, while fighting high inflation, which demands the opposite.
-Nick Timiraos, WSJ, 6/12/23
We continue to monitor the situation and will keep you updated as the facts change. Thank you as always for your trust!
Disclosures
Past performance is not indicative of future results. This material is not financial advice or an offer to sell any product. The information contained herein should not be considered a recommendation to purchase or sell any particular security. Forward-looking statements cannot be guaranteed.
This commentary offers generalized research, not personalized investment advice. It is for informational purposes only and does not constitute a complete description of our investment services or performance. Nothing in this commentary should be interpreted to state or imply that past results are an indication of future investment returns. All investments involve risk and unless otherwise stated, are not guaranteed. Be sure to consult with an investment & tax professional before implementing any investment strategy. Investing involves risk. Principal loss is possible.
The Core Consumer Price Index (CPI) measures the changes in the price of goods and services, excluding food and energy. The CPI measures price change from the perspective of the consumer.
Advisory services are offered through Aptus Capital Advisors, LLC, a Registered Investment Adviser registered with the Securities and Exchange Commission. Registration does not imply a certain level or skill or training. More information about the advisor, its investment strategies and objectives, is included in the firm’s Form ADV Part 2, which can be obtained, at no charge, by calling (251) 517-7198. Aptus Capital Advisors, LLC is headquartered in Fairhope, Alabama. ACA-2306-12.

