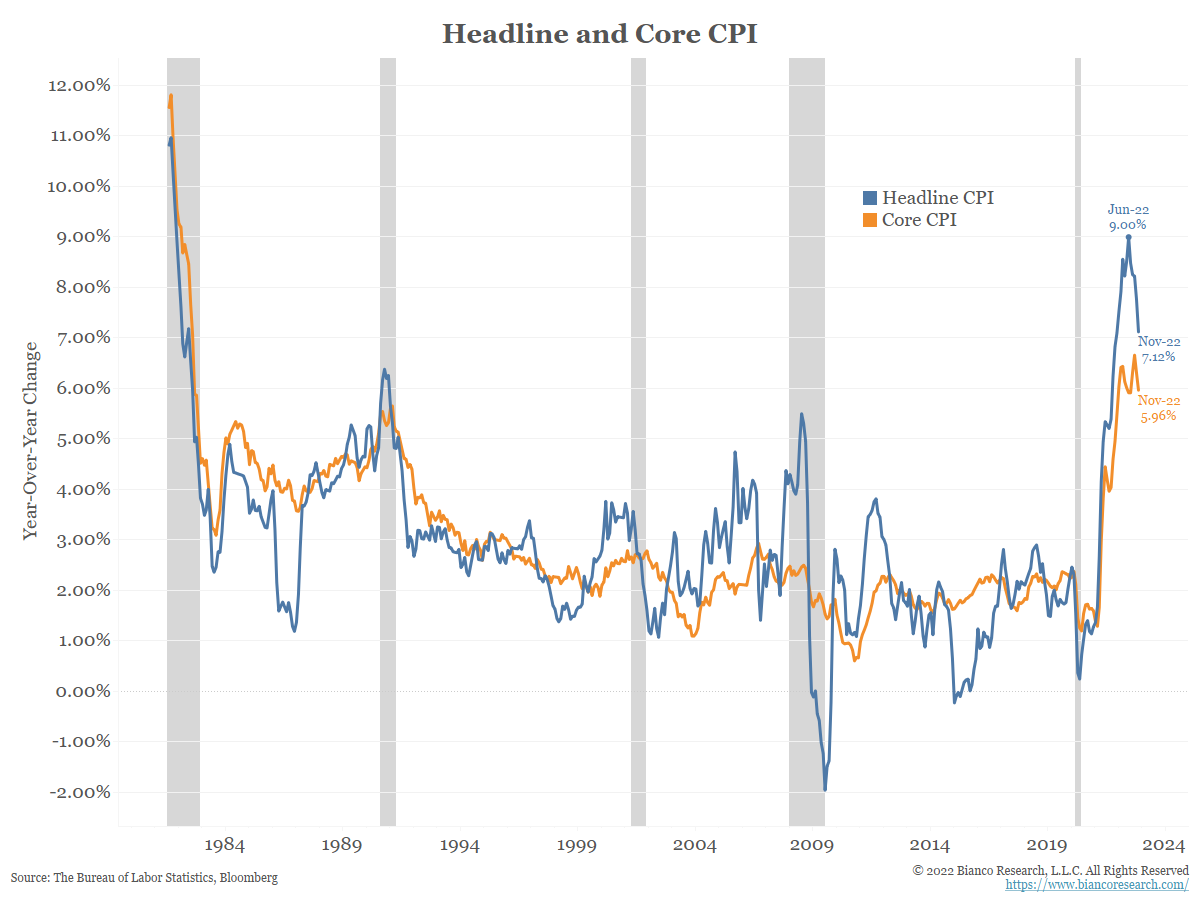
The CPI report came in softer than expected again in November. Core saw the smallest increase since Aug 2021. Core goods were down -0.5% (weakest since April 2020) and core services rose by 0.4% (smallest increase since July of this year). Headline CPI was also below expectations.
 Source: Bianco. As of 12/13/22.
Areas of weakness included used car prices (-2.9% m/m), airfares (-3.0% m/m), educational goods which include PCs and consumer electronics (-1.6% m/m), car leases -1.9% and medical services (-0.7%).
Owners’ equivalent rent (OER) re-accelerated from 0.6% to 0.7% and rents from 0.7% to 0.8%. Furniture and apparel reversed part of the prior months’ losses (+0.4 and +0.2% respectively). Labor-intensive sectors continue to see sticky inflation. For example, car maintenance was up 1.3% m/m, recreation was up 0.9%, and education was up 1% m/m.
 Source: Strategas. As of 12/13/22.
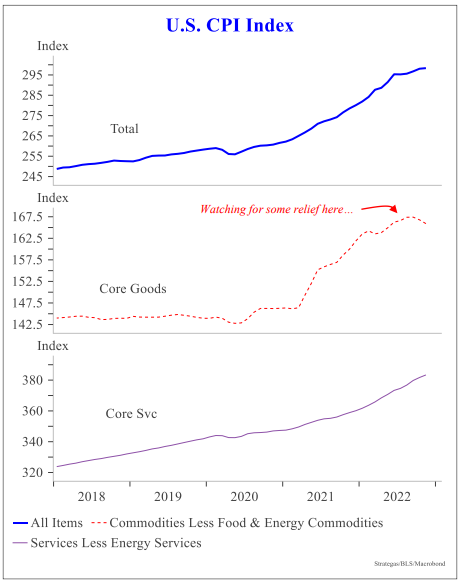
While continued pressures in the (sticky) labor-intensive components are still a concern, they were more than offset by deflation in the goods economy (remember there were some adjustments to the calculation at the beginning of the year driving up the importance of goods post – COVID). This will be the dynamic to watch moving forward.
We thought the medical care services number was worth mentioning. It fell a rounded -0.7%, the largest drop in the past 30 years. This follows a -0.6% drop in the previous month. It is unusual to see two down months in a row of any magnitude. Some of this is because of some leftover technical issues from the pandemic, but even so it goes against the idea that inflation in services is a long-term problem, our biggest worry.
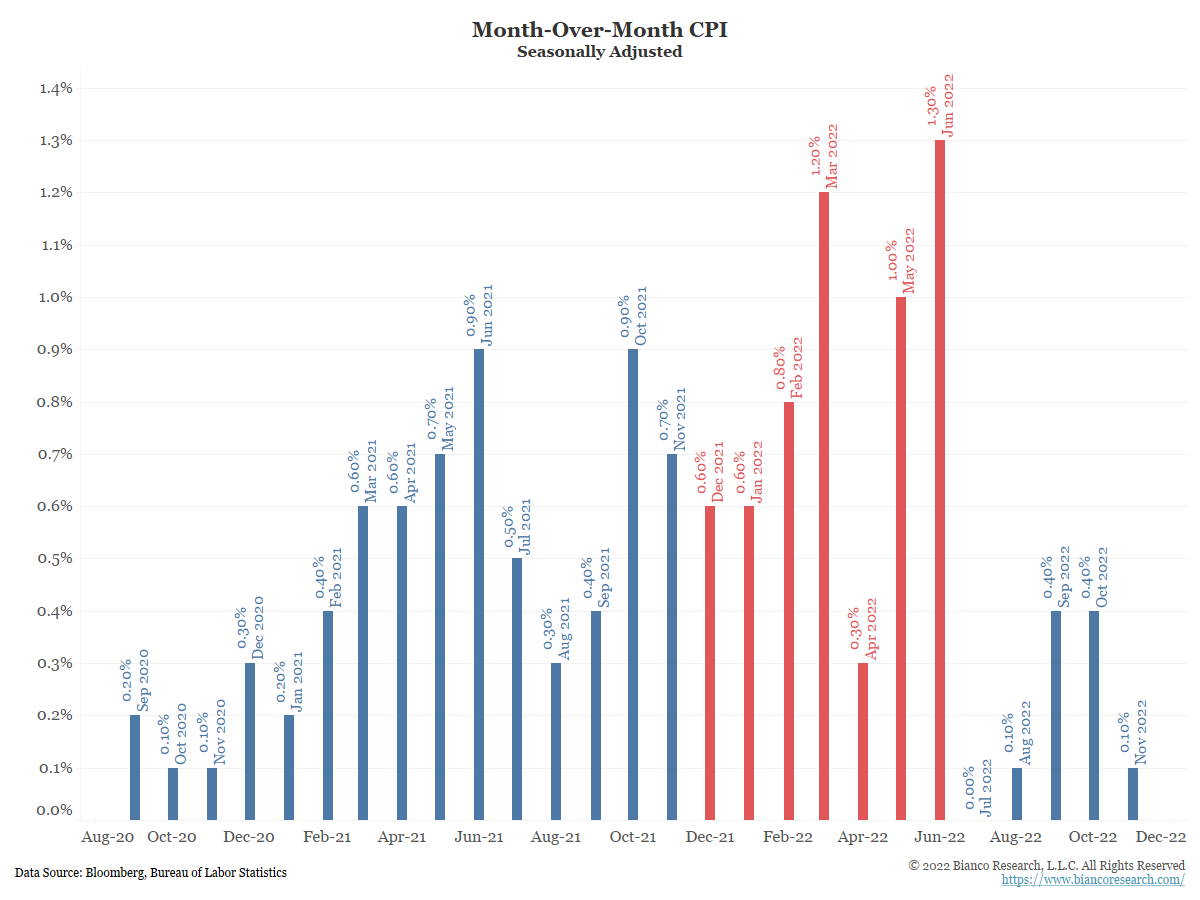
Between December 2021 and June 2022 (red), the month-over-month change in CPI was much higher than in the 2020 period. This means the current monthly numbers will have a much higher bar to surpass if inflation is going to remain elevated. This month’s 0.1% m/m change replaced a 0.7% m/m change from November 2021, which helps explain the continued drop in headline inflation.
 Source: Bianco. As of 12/12/22.
CPI would have to average 0.83% over the next seven months just to keep pace with the current inflation rate. For reference, the pre-pandemic QE era average for m/m inflation was just under 0.15%. The covid-era (March 2020-current) m/m average has been 0.43%. There is more room to fall!
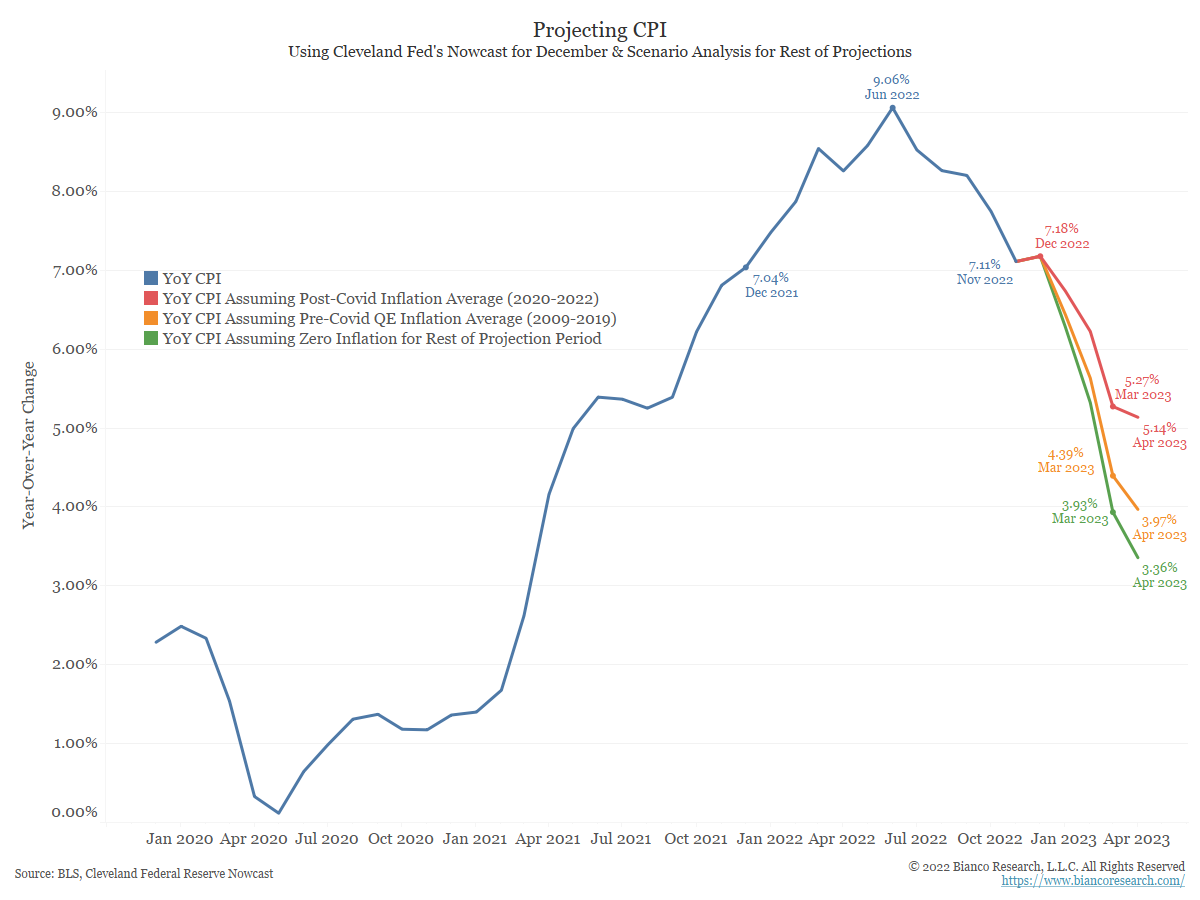
Projecting CPI is incredibly difficult. Bianco Research put together an updated analysis on some potential scenarios we might could see looking forward.
 Source: Bianco. As of 12/12/22.
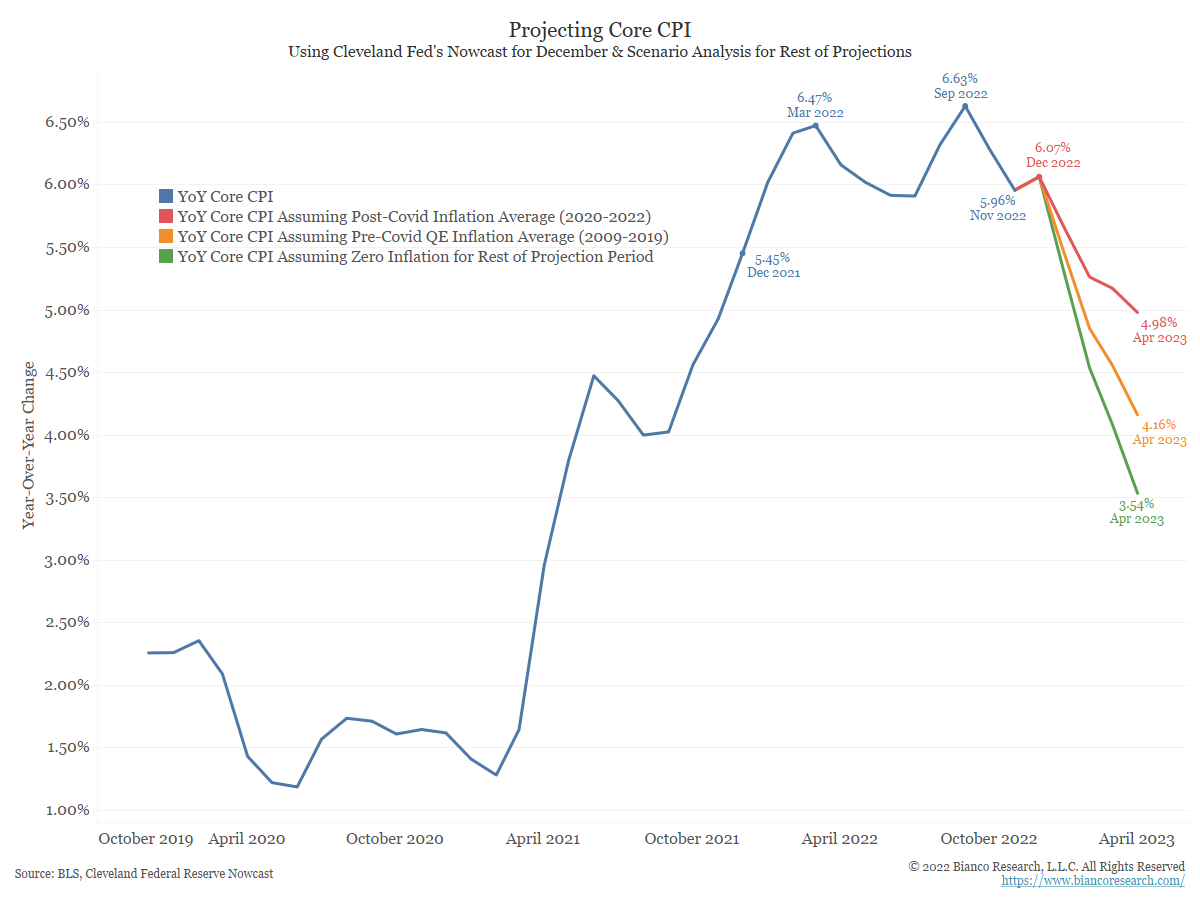
The blue line in the chart shows year-over-year CPI, which rose by 7.11% in the twelve months through November 2022. For the scenarios below, we assume the Cleveland Fed’s CPI Nowcast of 0.37% m/m inflation for December will be correct (notably Cleveland Fed has been too high the last two months).
The red line shows CPI would be 5.27% by the end of Q1 2023 if the m/m releases equal the average seen since the pandemic began in 2020. The orange line shows CPI would be 4.39% at the end of Q1 if the m/m releases equal pre-pandemic QE-era inflation. Finally, the green line shows CPI would 3.93% by March 2023 if the m/m releases show 0% inflation between now and then.
If inflation follows the red lines in the projection charts above, we could still be staring at 5+% CPI around March/April. If energy and housing prices ease, the orange lines in the projections above might prove more accurate. In that case, CPI would be closer to 4% come April.
For comparison, this chart shows the same scenarios for Core CPI. It is a bit more difficult to say this series has peaked, but the scenarios show potential for further declines.
 Source: Bianco. As of 12/12/22.
Bottom Line
The next several months showcase a period in which headline inflation numbers could provide some relief for Fed officials. Traders are aware of this and will be watching how fast the year-over-year number begins to fall.
The Fed is trying to be nuanced in stating rate hikes could slow while the terminal rate might be higher than expected. How high that terminal rate goes will be entirely dependent on how fast inflation comes down over the next several months.
Overall, this print should create visibility that the Fed will hike only 25 bps in February (after 50bps tomorrow) which further slows the hiking campaign. A peak rate in either February or March is becoming more likely.
Better visibility on the peak rate is good for risky assets (multiples) but doesn’t change the view that the yield curve should maintain its inversion (if not invert further) and earnings will continue to face downward pressure. If you think inflation is coming down fast, you are also saying earnings are headed lower. We assume it will take more proof that inflation is indeed coming down quickly, and the more likely scenario is that the Fed will stay at peak for the remainder of 2023, unless the economy weakens a lot.
Disclosures
Past performance is not indicative of future results. This material is not financial advice or an offer to sell any product. The information contained herein should not be considered a recommendation to purchase or sell any particular security. Forward looking statements cannot be guaranteed.
This commentary offers generalized research, not personalized investment advice. It is for informational purposes only and does not constitute a complete description of our investment services or performance. Nothing in this commentary should be interpreted to state or imply that past results are an indication of future investment returns. All investments involve risk and unless otherwise stated, are not guaranteed. Be sure to consult with an investment & tax professional before implementing any investment strategy. Investing involves risk. Principal loss is possible.
The content and/or when a page is marked “Advisor Use Only” or “For Institutional Use”, the content is only intended for financial advisors, consultants, or existing and prospective institutional investors of Aptus. These materials have not been written or approved for a retail audience or use in mind and should not be distributed to retail investors. Any distribution to retail investors by a registered investment adviser may violate the new Marketing Rule under the Investment Advisers Act. If you choose to utilize or cite material we recommend the citation, be presented in context, with similar footnotes in the material and appropriate sourcing to Aptus and/or any other author or source references. This is notwithstanding any considerations or customizations with regards to your operations, based on your own compliance process, and compliance review with the marketing rule effective November 4, 2022.
The Consumer Price Index (CPI) measures the change in prices paid by consumers for goods and services. The CPI reflects spending patterns for each of two population groups: all urban consumers and urban wage earners and clerical workers. The Core Consumer Price Index (CPI) measures the changes in the price of goods and services, excluding food and energy. The CPI measures price change from the perspective of the consumer. It is a key way to measure changes in purchasing trends and inflation.
Advisory services are offered through Aptus Capital Advisors, LLC, a Registered Investment Adviser registered with the Securities and Exchange Commission. Registration does not imply a certain level or skill or training. More information about the advisor, its investment strategies and objectives, is included in the firm’s Form ADV Part 2, which can be obtained, at no charge, by calling (251) 517-7198. Aptus Capital Advisors, LLC is headquartered in Fairhope, Alabama. ACA-2212-20.
