The next Fed meeting starts a week from today. As of now, the market is currently pricing in just a 23% chance the Fed hikes at the meeting. WSJ’s Nick Timiraos already provided his pre-meeting proclamation of a probable pause. At this point, anything other than a ‘skip’ would be a surprise, ending (or at least pausing) the 15-month hiking cycle.
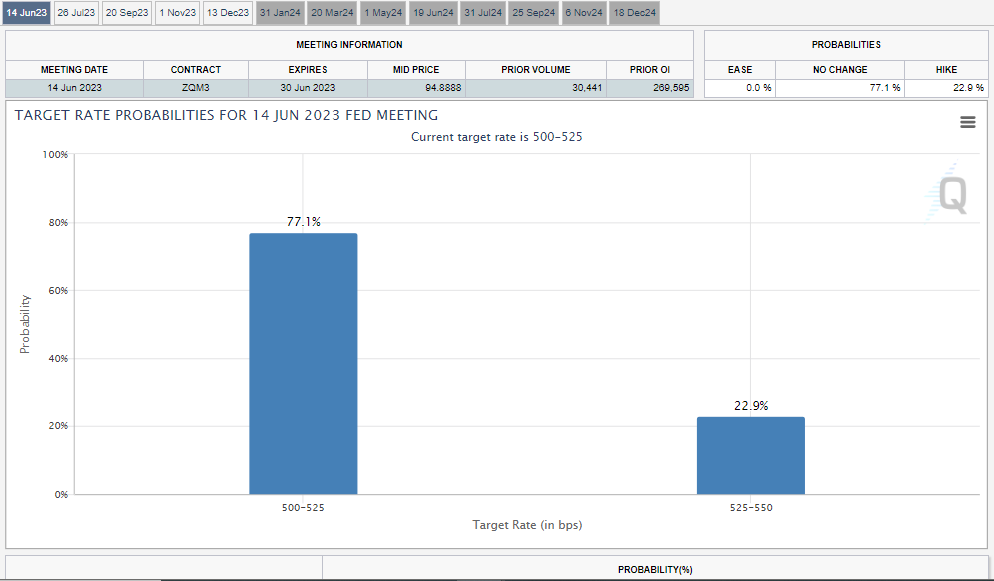 Source: CME as of 06.07.2023
On the “higher-for-longer” front, derivatives markets show investors now expect the Fed’s target rate to sit at 5% at year-end, up from just above 4% last month. The market and the Fed finally appear to be on the same page.
Wages Continue to Pressure Fed
Wage pressures remain firmer than levels historically associated with 2% inflation. The decline in productivity hasn’t helped the cause.
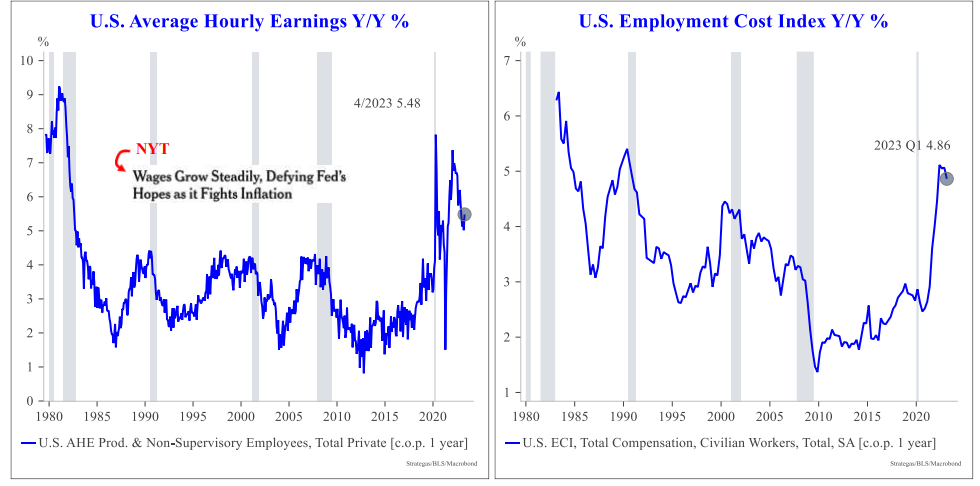 Source: Strategas as of 06.02.2023
If productivity growth falls below unit labor costs on a persistent basis, inflationary pressure builds as firms struggle to pass on wage costs (i.e., they are getting less output for a higher cost). Ultimately the Fed needs some relief on the wages front before declaring victory.
Goods vs Services
The last two years brought the first price appreciation in U.S. durable goods as measured by the PCE durable goods deflator in two decades. As we’ve talked about in the past, the entry of China into the WTO brought consistent goods deflation to durable goods prices.
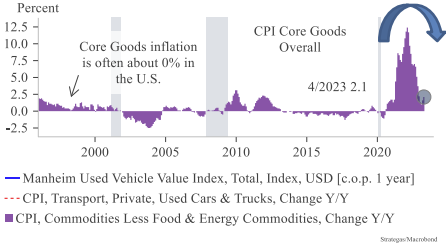 Source: Strategas as of 05.29.2023
Cheap goods from China have been a large driver of low inflation. As the graphic above shows, contrary to what many believe, goods consumption isn’t slowing.
And real services are still running slightly below their pre-Covid trend with room to “catch up”. There is also plenty of pressure from a tight labor market to keep prices elevated.
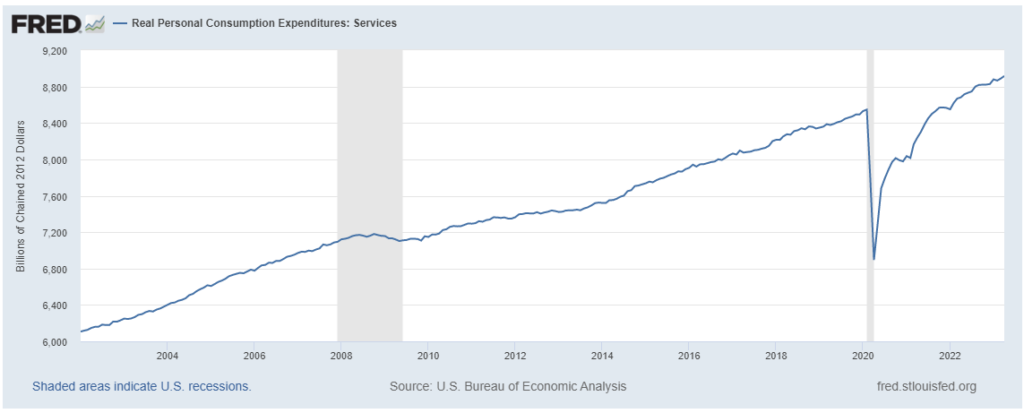
Source: FRED as of 06.03.2023
The bottom line is there are pricing pressures on both sides… de-globalization and supply chain issues are likely to keep goods prices elevated while labor costs and lower productivity are likely to keep service costs high. Either way, whether it’s the consumer continuing to buy goods or increasing spending within services, the higher prices look “sticky”. Even with that, the consumer is still spending.
Inflation < 3%?
Truflation has been a popular inflation-measuring tool the last few years. The data provider claims to give a real, current inflation rate that is more accurate than lagging government data. As can be seen from the chart, the trend continues lower.
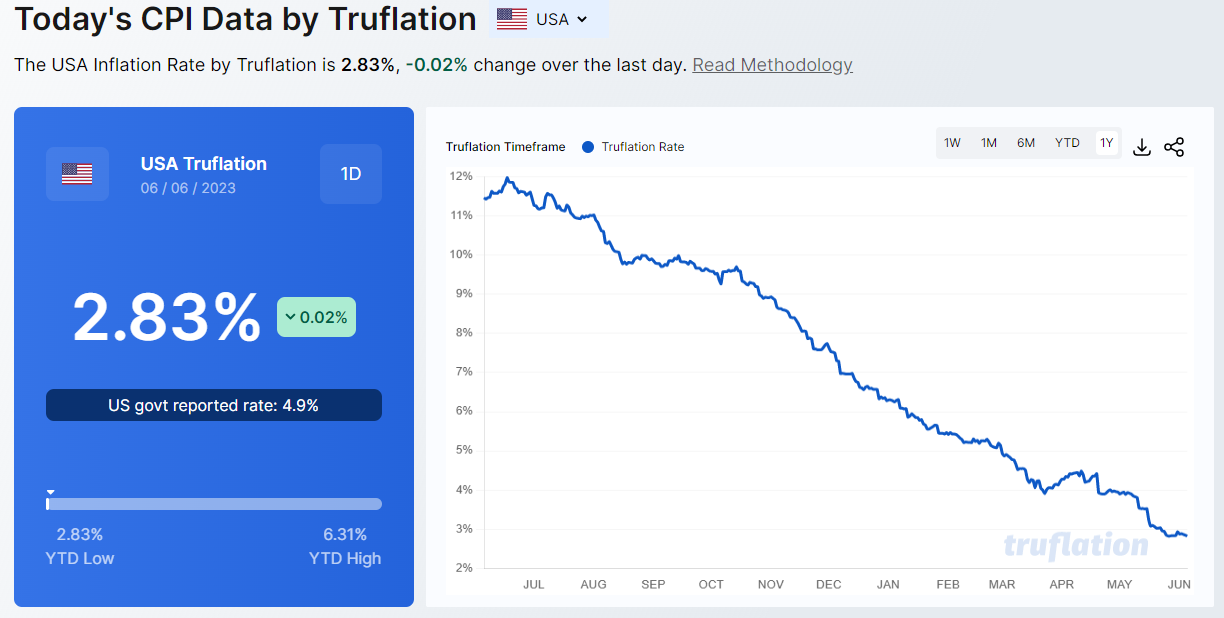 Source: Trueflation as of 06.06.2023
As this rate continues to drift lower, we expect the policy debate will soon shift away from “How high?” to “How long?”, as the case for further rate increases becomes harder to tolerate politically, especially coming into an election year.
Institute for Supply Management (ISM) Data Trending Lower
The May ISM read of prices paid by businesses came in at 44.2, suggesting that a continued sharp erosion of input pricing power is underway as the Fed tightens credit and shrinks their balance sheet.
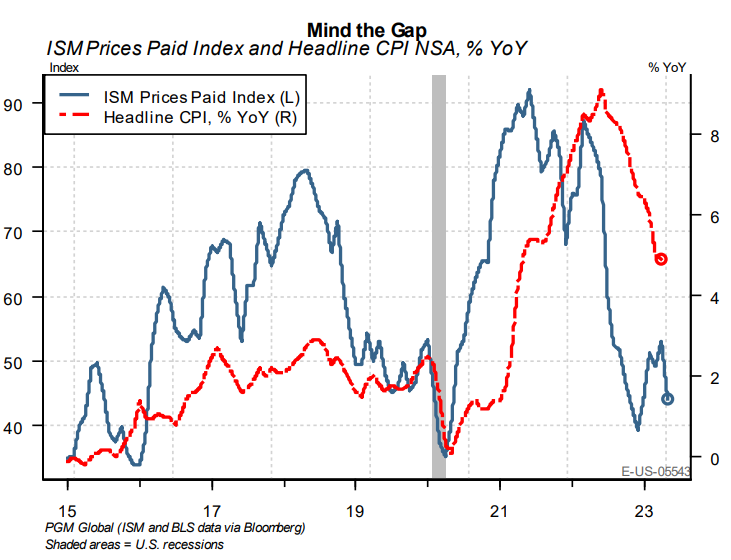 Source: Pavilion as of 06.06.2023
Looking at the correlations with CPI, we see that ISM typically leads the headline prints by two to four quarters. The market will be watching closely in hopes for more signs of immaculate disinflation (lower inflation but non-recessionary growth).
CPI Next Week: What Does Cleveland Fed Say?
Next week brings both the CPI print and the FOMC meeting. The survey has headline inflation printing at 0.2% MoM and 4.1% YoY, with core inflation at 0.4% MoM and 5.12% YoY. These numbers are relatively close to expectations from the Cleveland Fed’s Inflation NowCast:
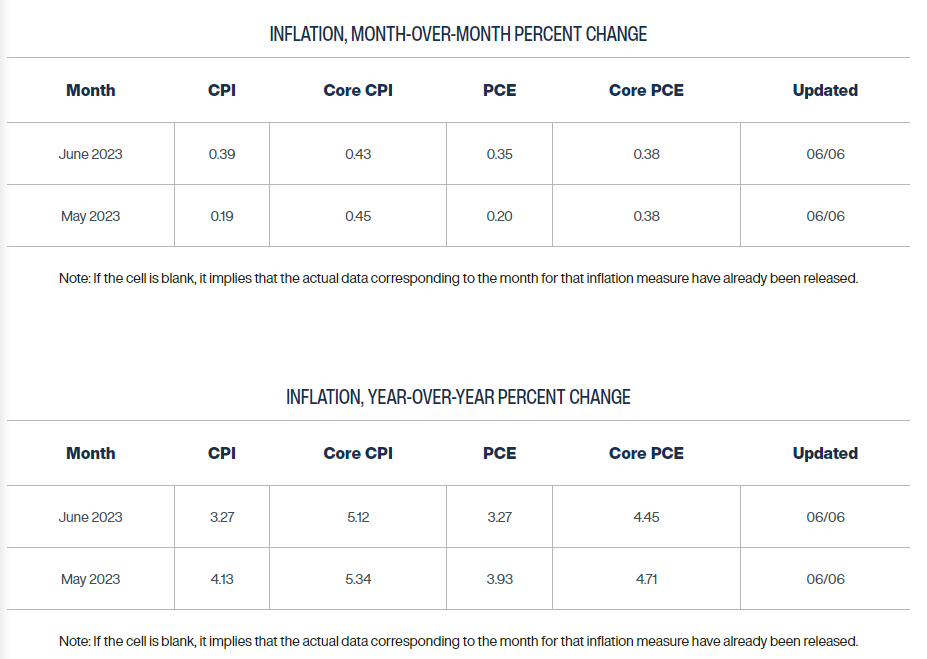
 Source: Cleveland Fed & Bloomberg LP as of 06.07.2023
One thing to note is the sharp drop in headline YoY inflation from 4.9% (April) to 4.1% (May) down to 3.27% (through June). While we are curious as to how the Fed and market will respond, we are also wary of the end of the soft comps which led to the drastic deceleration in the YoY number.
Disclosures
Past performance is not indicative of future results. This material is not financial advice or an offer to sell any product. The information contained herein should not be considered a recommendation to purchase or sell any particular security. Forward looking statements cannot be guaranteed.
This commentary offers generalized research, not personalized investment advice. It is for informational purposes only and does not constitute a complete description of our investment services or performance. Nothing in this commentary should be interpreted to state or imply that past results are an indication of future investment returns. All investments involve risk and unless otherwise stated, are not guaranteed. Be sure to consult with an investment & tax professional before implementing any investment strategy. Investing involves risk. Principal loss is possible.
Advisory services are offered through Aptus Capital Advisors, LLC, a Registered Investment Adviser registered with the Securities and Exchange Commission. Registration does not imply a certain level or skill or training. More information about the advisor, its investment strategies and objectives, is included in the firm’s Form ADV Part 2, which can be obtained, at no charge, by calling (251) 517-7198. Aptus Capital Advisors, LLC is headquartered in Fairhope, Alabama. ACA-2306-9.

