
Our team looks at a lot of research throughout the day. This week’s charts follow a market starting to charge for risk in its favorite trade, a momentum reversal unlike anything, including the tech bubble and COVID extremes, and single-stock volatility sitting at five-year highs just as the calendar turns toward the roughest stretch of a midterm year. Yet we also see earnings growth remaining near records, a labor market looking well balanced, and small/mid caps still priced at a historic discount. What this means is the setup reads more like rotation than exhaustion. Have a great weekend!
Brad: The bond market is starting to charge a higher premium for the AI buildout, with hyperscaler credit spreads near a record 82 bps above the investment grade index.
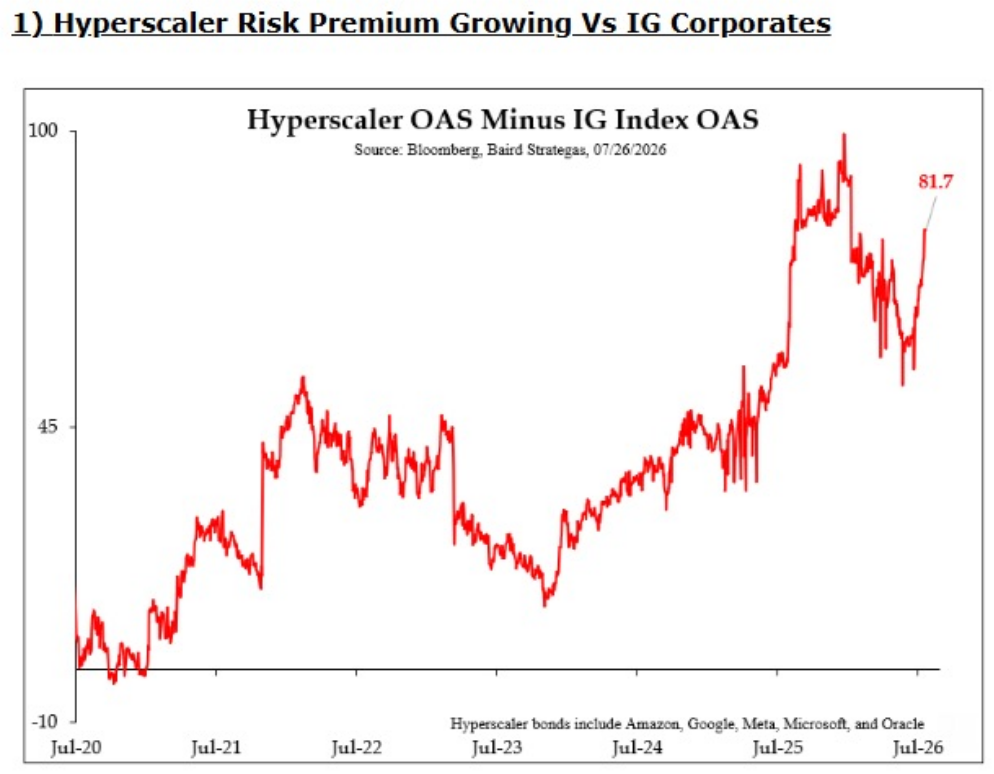
Dave: Part of the reason is hyperscaler returns on incremental invested capital have fallen since the CAPEX ramp began, though at roughly 20% they are simply back to their 10-year average rather than signaling broken economics.
Data as of 6.30.26
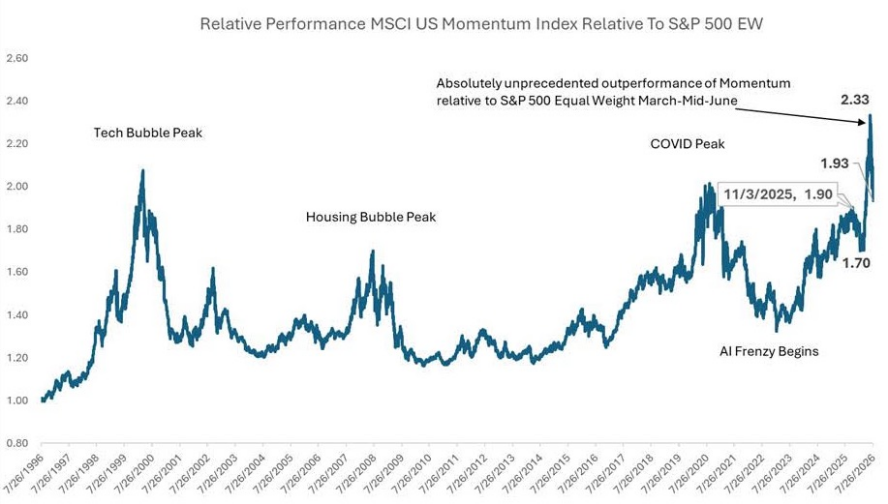
Mark: Within equity markets, performance has sharply reversed from what had previously been working. Momentum’s outperformance relative to the equal-weight S&P 500 from March through early summer was beyond anything seen even during the tech bubble or COVID peaks, but has snapped back sharply.
 Source: Raymond James as of 7.26.26
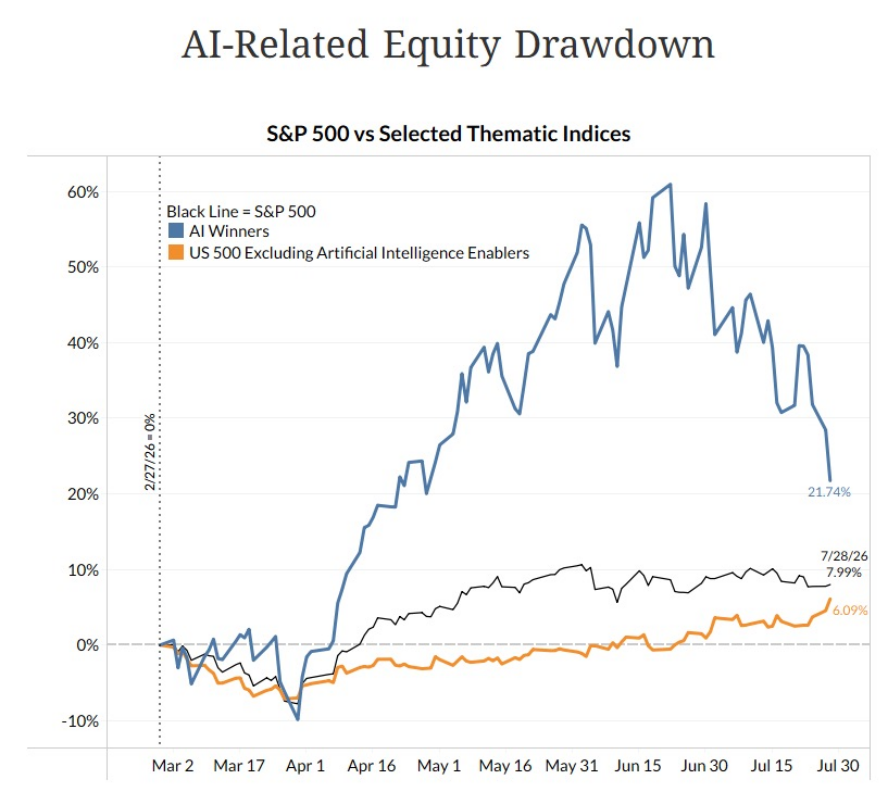
Brian: Much of the boom / not quite bust has been driven by the outsized outperformance and subsequent sell-off of perceived AI winners.
 Source: Bianco Research, Bloomberg as of 7.28.26
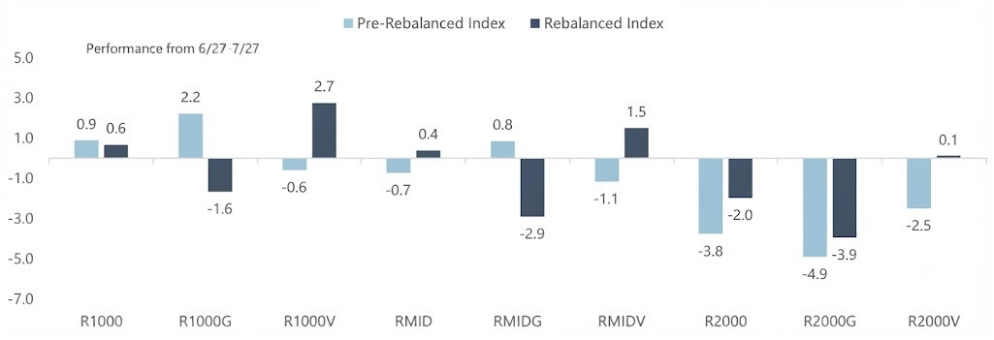
Mike: The June Russell rebalance shows other changes under the hood. The newly reconstituted value indexes are outperforming their pre-rebalance versions across the board, a sign the rotation runs deeper than a few mega-cap wobbles.
 Source: Jeffries as of 7.27.26
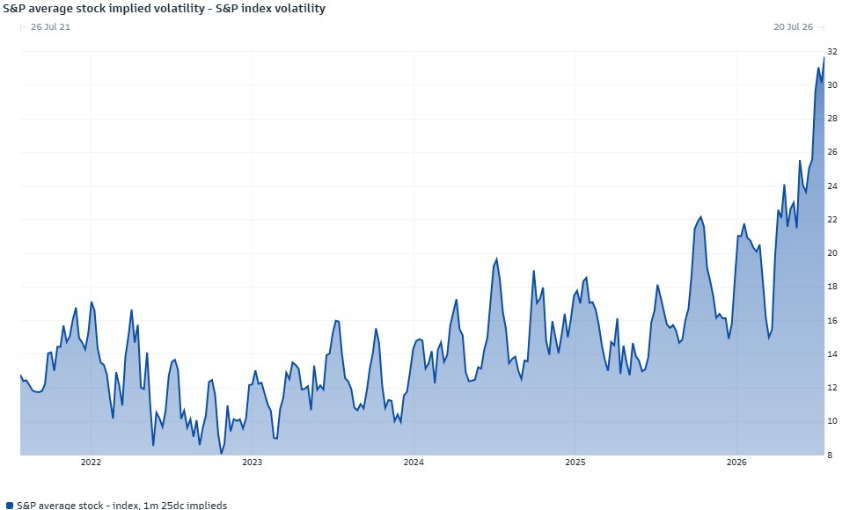
Ten: The options market has noticed, with the implied volatility premium of the average S&P 500 stock surging to five-year highs. This has been a market bracing for big moves in single names even while the index has stayed relatively orderly.
 Source: Goldman Sachs as of 7.20.26
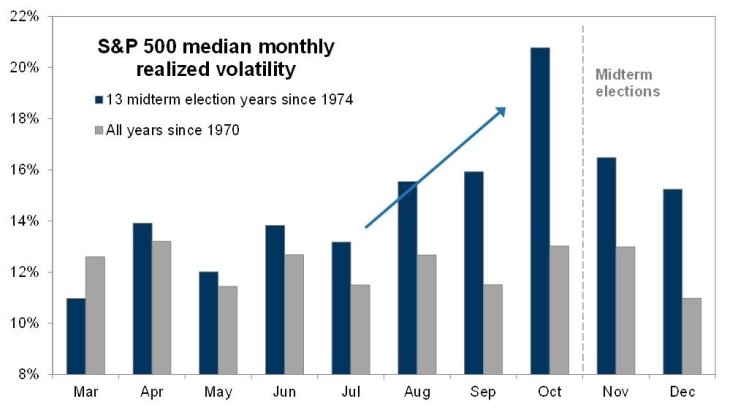
Joseph: History says not to expect volatility to necessarily fade soon, as August through October returns during midterm years have reliably been the most volatile stretch of the entire four-year cycle.
 Source: Goldman Sachs as of 7.21.26
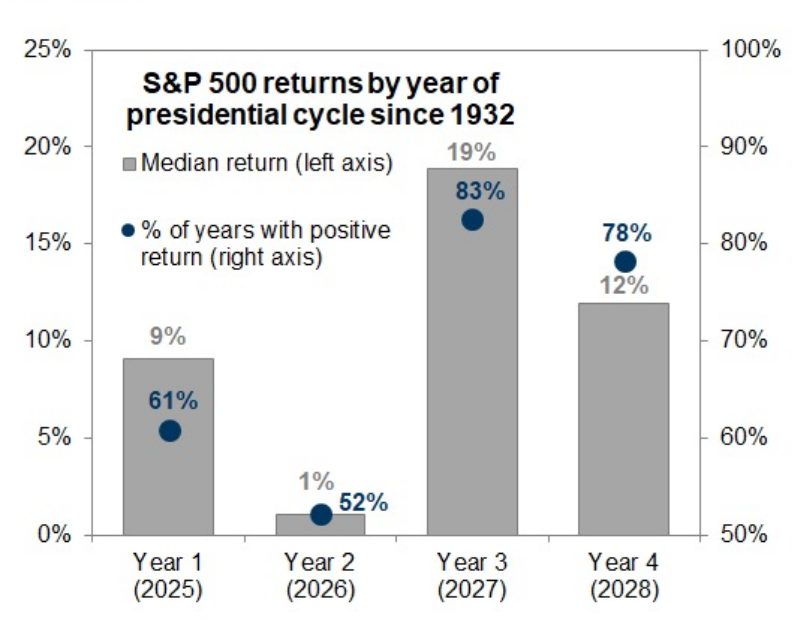
John Fox: That coincides with equity market weakness during midterm years as well, with a 1% median return since 1932. The consolation prize is what comes next, as Year 3 has been the strongest at 19%.
 Source: Goldman Sachs Global Investment Research as of 12.31.26
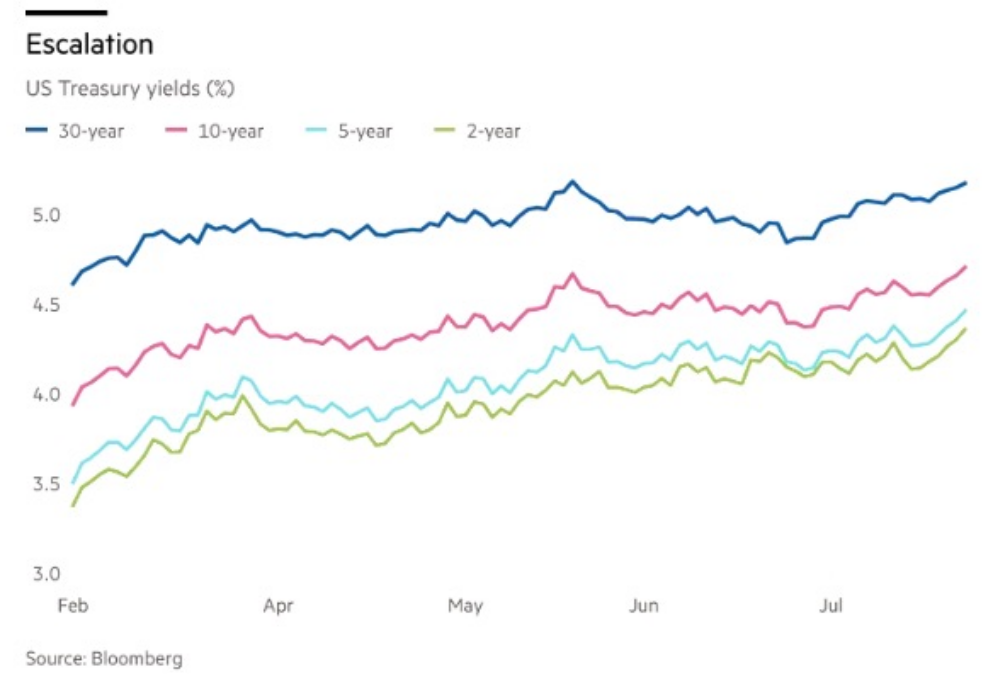
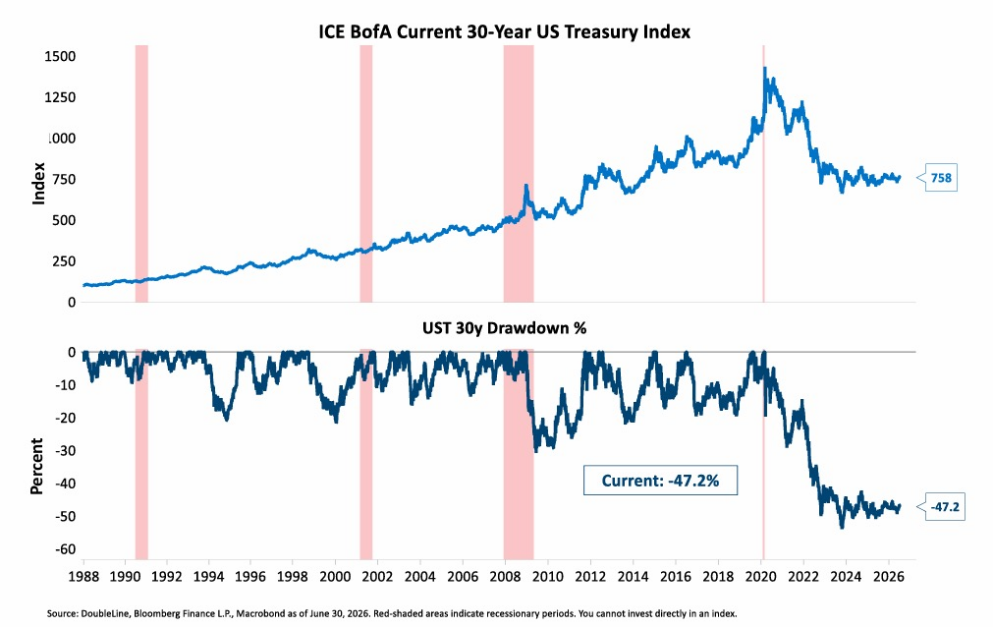
John Luke: Rates are doing their part to keep things interesting as well, with the whole Treasury curve grinding higher since spring and the 30-year holding above 5%.
 Source: Bloomberg as of 7.24.26
Jake: That leaves the current 30-year Treasury in a 47% drawdown from its 2020 peak, six years on and still not even halfway back.
Derek: For stocks, the level of yields matters less than the speed of change. Equities have historically absorbed gradual moves just fine but buckle when the 1-month change in rates exceeds 2 standard deviations, which today would be roughly a 50 bp jump.
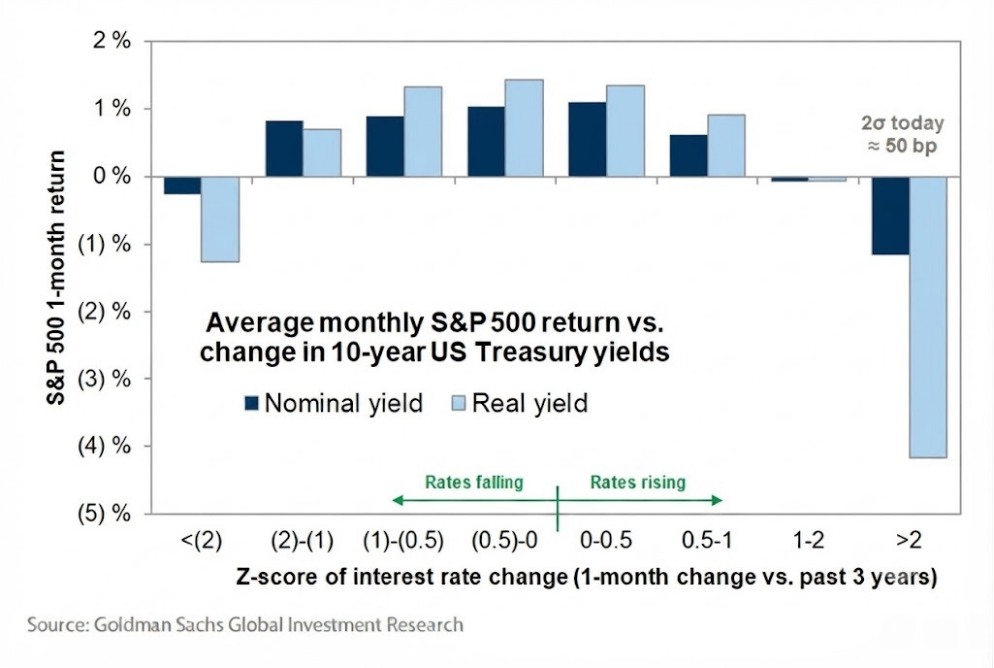 Graphic as of 7.21.2026
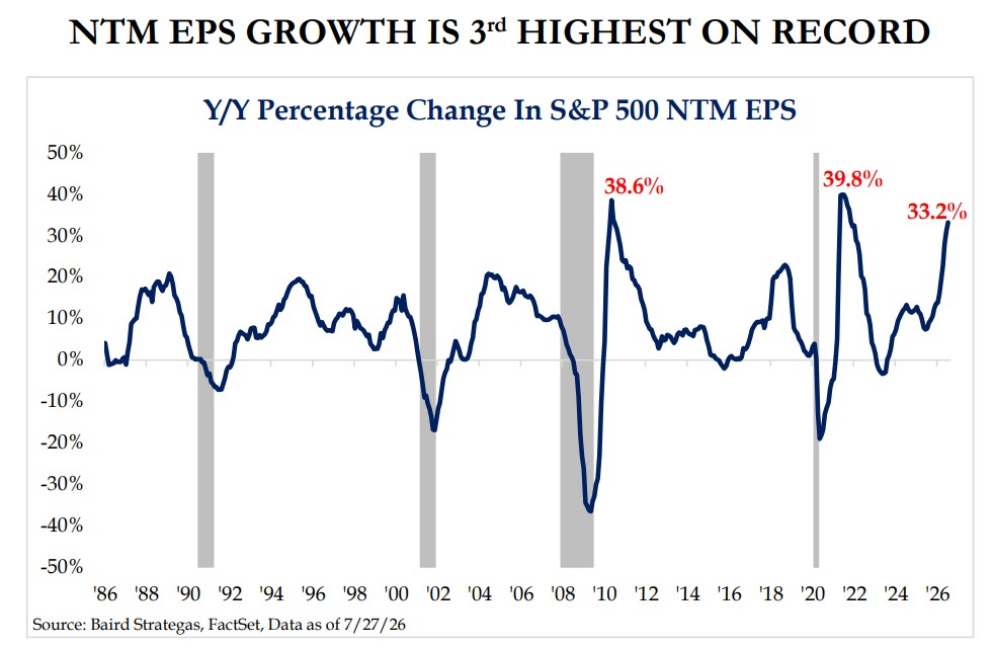
Beckham: The reason equities can absorb all of this uncertainty is earnings. Next-twelve-month EPS growth expectations of 33% would be the third highest on record, trailing only the post-GFC and post-COVID rebounds.
Dave: Labor markets look balanced rather than broken as well, with job openings and unemployed workers essentially matched after the extremes of 2020 and 2022.
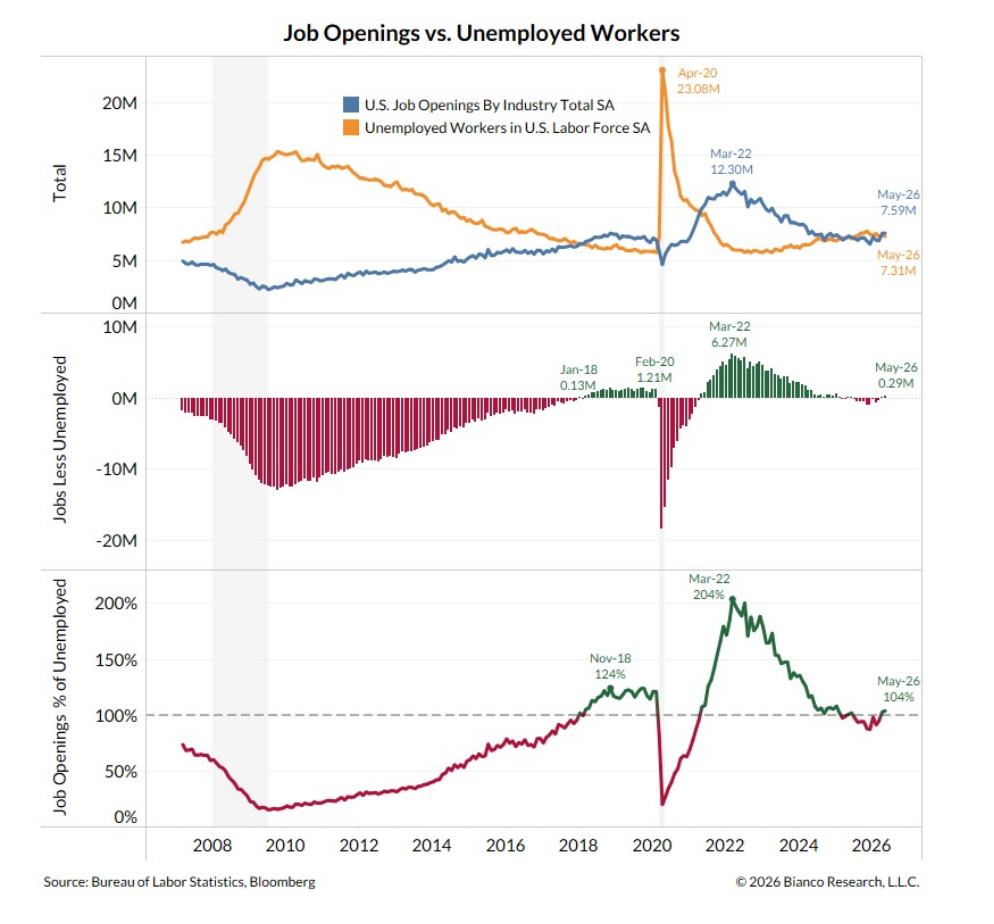 Source: Bianco Research, Bloomberg as of May 2026
Brett: Meanwhile, small and mid-caps still look cheap, trading at 17 to 18 times forward earnings against 22+ for the S&P 500, a discount that has persisted since the pandemic.
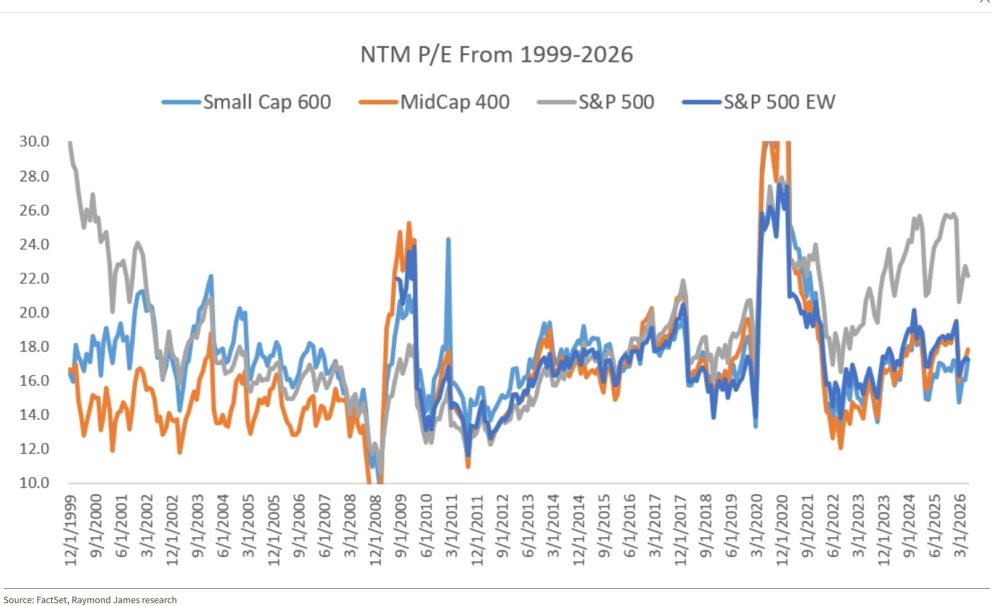 Source: FactSet, Raymond James as of 7.19.2026
Joseph: The AI rally has presented a challenge for small-cap managers focused on quality as the AI rally trickled downstream within small-cap tech hardware and semiconductors. These areas now trade at 50x forward earnings, more than double the 23x multiple of their large-cap counterparts.
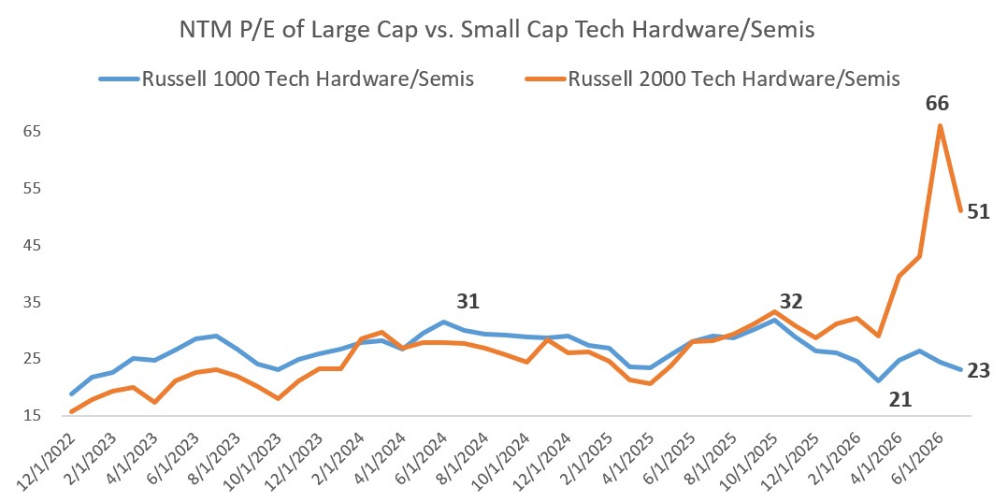 Source: FactSet, Raymond James as of July 2026
JD: Whatever the next few months bring, the math of staying put has not changed. Since 1930, the S&P 500 has returned 30,000%+, but only 133% if you missed the 10 best days of each decade.
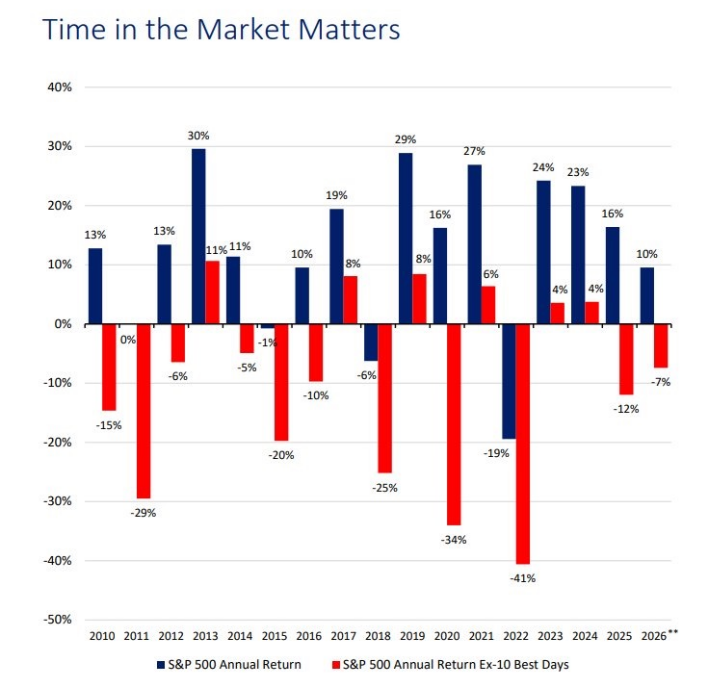 Source: Merrill, Bloomberg as of 6.30.26
Disclosures
Past performance is not indicative of future results. This material is not financial advice or an offer to sell any product. The information contained herein should not be considered a recommendation to purchase or sell any particular security. Forward-looking statements cannot be guaranteed.
Projections or other forward-looking statements regarding future financial performance of markets are only predictions and actual events or results may differ materially.
This commentary offers generalized research, not personalized investment advice. It is for informational purposes only and does not constitute a complete description of our investment services or performance. Nothing in this commentary should be interpreted to state or imply that past results are an indication of future investment returns. All investments involve risk and unless otherwise stated, are not guaranteed. Be sure to consult with an investment & tax professional before implementing any investment strategy. Investing involves risk. Principal loss is possible.
Advisory services are offered through Aptus Capital Advisors, LLC, a Registered Investment Adviser registered with the Securities and Exchange Commission. Registration does not imply a certain level of skill or training. More information about the advisor, its investment strategies and objectives, is included in the firm’s Form ADV Part 2, which can be obtained, at no charge, by calling (251) 517-7198. Aptus Capital Advisors, LLC is headquartered in Fairhope, Alabama. ACA-2607-34.