
Last Friday morning at Jackson Hole, Chairman Warsh made the case that it’s hard to argue financial conditions are restrictive. As of Wednesday morning, the bond market has done some of the work for him.
Below shows the move in yields since last Thursday’s close – the session before Warsh spoke versus today. It isn’t a violent selloff—Bloomberg made the same point this morning—but with 10-year yields north of 4.75% and the long bond over 5.25%, financial conditions are tighter than they were a week ago.
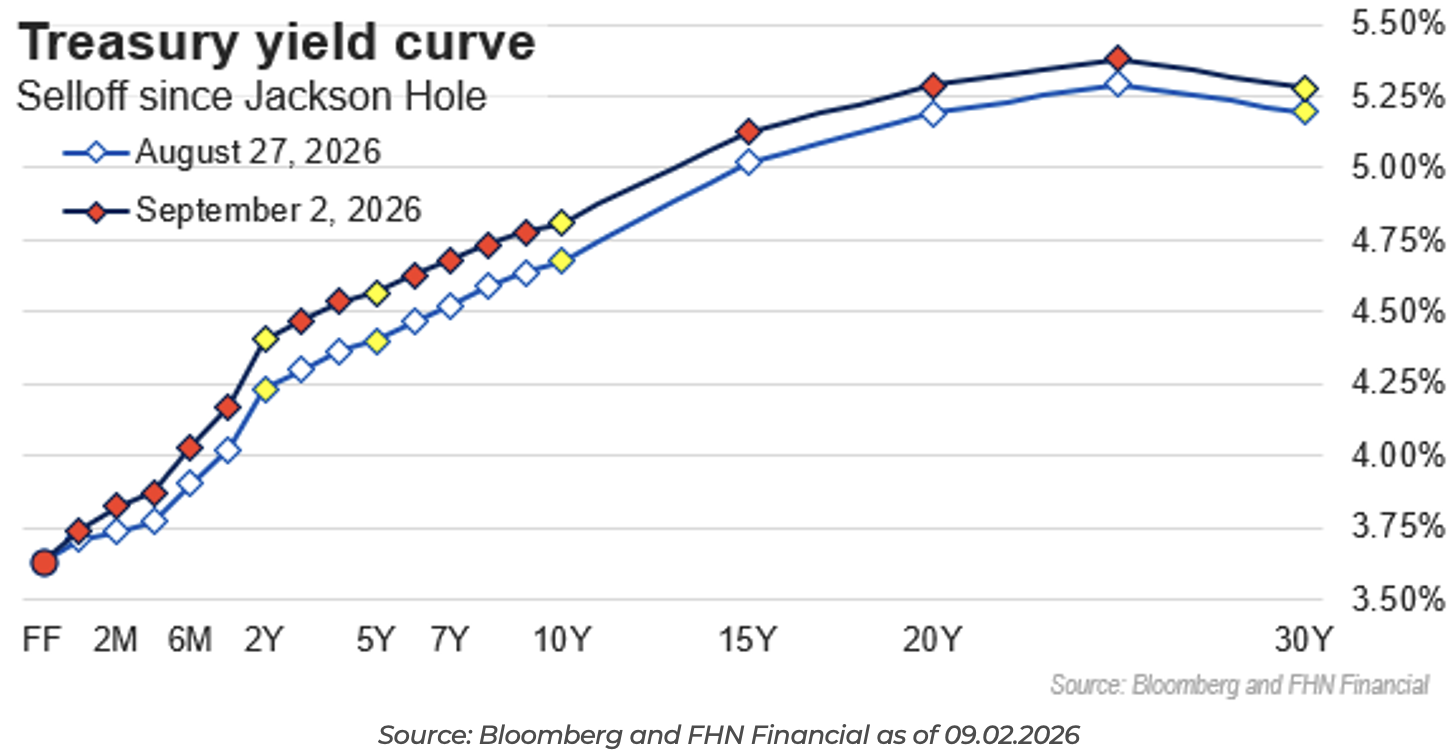
While everyone is focused on the long end, the pressure has actually shown up more on the front end. Two-year yields are sitting at 4.40%, up from 4.23% last Thursday; a 17bp move that has little to do with term premium and everything to do with the market pricing in a higher probability of near-term tightening. Fed funds futures tell the same story: the odds of a September hike were 40% a week ago Friday. They’re over 60% now, with a bit more than two hikes priced in through next April.
So did Warsh “Forward Guidance” the market into doing his job for him? Since his speech, the market has repriced the front end higher and tightened financial conditions, and this is without the committee lifting a finger.
Real Time Inflation Tells a Different Story
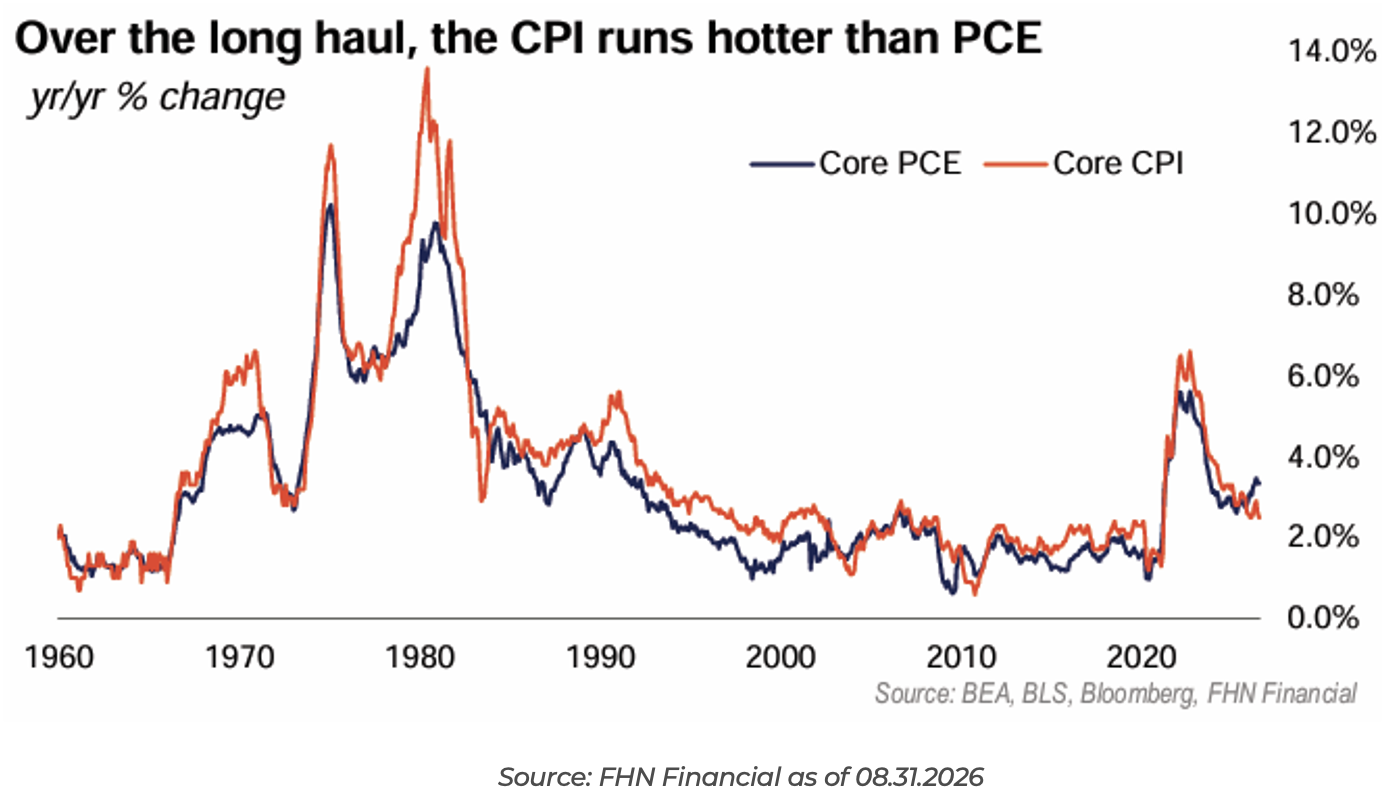
The reason the front end is under pressure isn’t complicated: core PCE inflation has not cooperated. Through July, it sat at 3.3% year-over-year, unchanged from June, and roughly 0.8% above the core CPI’s 2.5%. Same economy, same month, two very different readings depending on which index you look at.
I think Warsh’s focus on more timely data as well as his past comments on trimmed mean and median data sets up potential future changes to the inflation measuring goal post. More on this below.
“We must interrogate reality to make sure we are not setting forward-looking policy based on stale or inaccurate data… the data upon which we draw must be as relevant, contemporaneous, accurate, and actionable as possible.” – Chairman Warsh at Jackson Hole on 8/28/2026
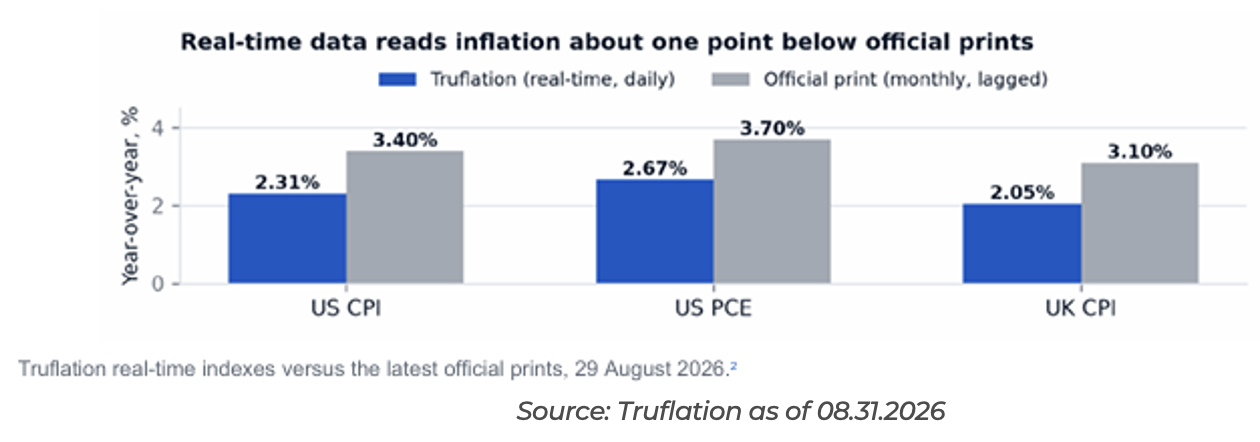
Real-time data reads calmer than the official prints across the board. Truflation’s live daily read has headline PCE at 2.67% against an official 3.70% CPI print — a full point difference between the two, and the same gap shows up in headline CPI (2.31% vs. 3.40%). They even show UK CPI, which leads to the same conclusion: more real-time inflation data is lower than the headline prints.
If Warsh is right that lagged, stale data is itself a policy risk, the case for hiking looks less urgent by his own preferred lens (real-time data) than it does by the measure the Fed is actually on the hook to target (core PCE).
Inflation Breadth
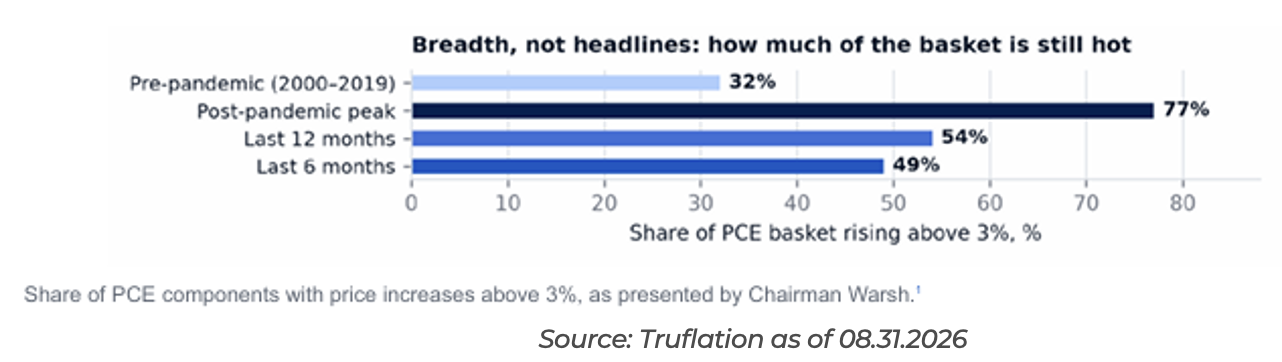
Warsh clearly stated he focuses on inflation breadth. He told the Jackson Hole audience he disaggregates all 199 components of the PCE basket and tracks how many are running above 3% year-over-year. That share is 54% over the past year and 49% over the past six months — durably below the post-pandemic peak of 77%, but still well above the roughly 32% share that prevailed for two decades before the pandemic.
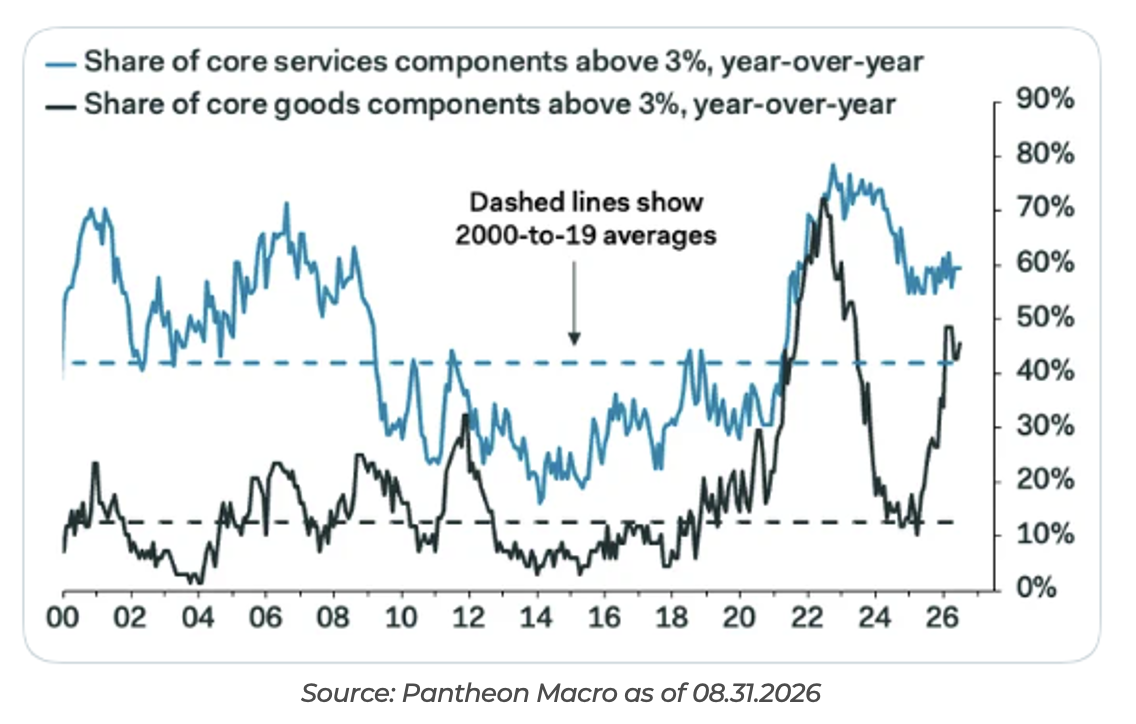
Composition matters as much as the level here. The broadening is mostly a goods story—tariff pass-through, not a services reacceleration—and shorter-term breadth measures should face less pressure now that most of that pass-through is behind us. So, breadth is a reason for caution, but we wouldn’t call it an alarm.
PCE vs CPI
After numerous questions on the difference between PCE and CPI, we thought we’d put together a quick rundown on how the two indices differ:
CPI has fixed weights, reset once a year
PCE weights float every month based on actual spending
If something spikes in price and people cut back, PCE picks that up immediately — CPI doesn’t adjust until the next annual reset. This is a big reason PCE tends to run a bit cooler.
Shelter (rent/OER) is 44.3% of core CPI but only 17.6% of core PCE. PCE treats homeownership as investment (it shows up in the residential investment deflator, not consumer spending), so it’s mostly excluded. CPI counts it in full via owners’ equivalent rent.
PCE is broader. It captures spending on behalf of consumers too; think employer-paid health insurance, Medicare/Medicaid, and other government assistance (large fiscal deficits don’t help!). CPI only counts out-of-pocket household spending. As a result, the stickier government-services inflation shows up in PCE, not CPI.
CPI is urban-only. PCE includes rural households too (~20% of the population), who spend more on things like motor fuel since they drive more and have no mass transit. Small effect, but real.
To sum it up, the 80bp gap between core PCE and core CPI can be mostly explained by the shelter-weight difference and the wider scope effect of PCE. The current spread is unusually wide and persistent by historical standards. This is unusual given core CPI has historically averaged about 50bps higher than core PCE, a massive delta to what we’re seeing today.
Core PCE: Today’s Benchmark… But It Could Change!
An unknown fact to most is that the Fed’s mandate doesn’t actually name an inflation index. Congress tells the Fed to pursue stable prices; it was the Fed itself that, in 2012, translated that into a 2% target, and later chose the PCE deflator as the yardstick. Nothing in the statute requires that particular choice, which makes commentary around a change in the goal post notable.
July Inflation Tracker
-
- Core PCE at 3.3%, core CPI at 2.5%
- Dallas Fed trimmed-mean PCE at 2.28%
- Cleveland Fed median PCE at 2.7%
- Truflation’s daily core PCE rate at 2.52% (as of 9/2/26)
Before he was Chairman, Warsh told the Senate Banking Committee he prefers median and trimmed-mean measures because they strip out short-term noise and some of the BEA’s interpolated prices. At his Jackson Hole press conference, Warsh confirmed the FOMC’s commitment to a 2% PCE target, at least through the end of this year.
“At least through this year” is a subtle qualifier and opens the door to a future change. We would not doubt the FOMC will revisit the target measure based on recommendations from Warsh’s data and inflation task forces; task forces built, by his own description, around live data and breadth-of-inflation tools that look a lot more like Truflation than like the monthly PCE deflator. All eyes will be on core PCE through year-end, because that’s the number the committee has committed to; however, as the task forces publish their findings, we wouldn’t be surprised to see a change in the measuring stick as next year’s big story.
Disclosures
Past performance is not indicative of future results. This material is not financial advice or an offer to sell any product. The information contained herein should not be considered a recommendation to purchase or sell any particular security. Forward looking statements cannot be guaranteed.
This commentary offers generalized research, not personalized investment advice. It is for informational purposes only and does not constitute a complete description of our investment services or performance. Nothing in this commentary should be interpreted to state or imply that past results are an indication of future investment returns. All investments involve risk and unless otherwise stated, are not guaranteed. Be sure to consult with an investment & tax professional before implementing any investment strategy. Investing involves risk. Principal loss is possible.
Advisory services are offered through Aptus Capital Advisors, LLC, a Registered Investment Adviser registered with the Securities and Exchange Commission. Registration does not imply a certain level of skill or training. More information about the advisor, its investment strategies and objectives, is included in the firm’s Form ADV Part 2, which can be obtained, at no charge, by calling (251) 517-7198. Aptus Capital Advisors, LLC is headquartered in Fairhope, Alabama. ACA-2609-8.