Curves are Inverted, Term Premiums LOW
The market continues to price in a return to the 2010 norms of subdued inflation pressure, with term premia below zero across the curve.
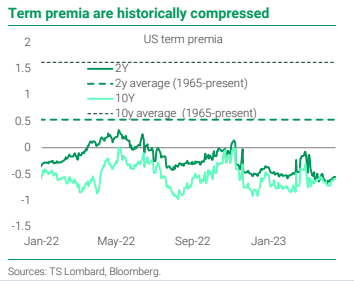 Source: TS Lombard. As of 04.12.2023
While slower nominal growth could put a ceiling on longer-term yields, we don’t see long-term bonds serving as the portfolio hedge they have for the last 40 years. As seen last year, given persistent inflation, the correlation between stocks and bonds flipped positive. This shift creates a dangerous situation for balanced portfolios where both core asset classes can go down at the same time. We see this as a risk that could continue.
With the stickiness of inflation, we do not see Central Banks coming to rescue the economy with large scale rate cuts in the event of a recession. If they prematurely cut rates, they risk “un-anchoring” inflation (central bankers will be well aware of the 70’s cycle). In saying all of this, we see the higher for longer rate environment as a real possibility.
Given this risk, and the fiscal degradation/lack of central bank buyers because of QT, investors are likely to require a higher term premium for longer duration securities. Higher term premiums will also limit the effectiveness of long duration bonds in asset allocation portfolios. As the charts above display, current premiums are well below their historic averages.
Bottom line, with the Fed’s long-term neutral rate (R*) somewhere around 2.50% – 2.75%, and the average term premium the last 58 years at 162 bps, this puts the 10 year UST above 4%. So it appears unlikely to see longer term rates retreat back below 3%, unless the Fed does cut rates to 0% again.
Is the M2 (Money Supply) Change Really that Scary… Depends on Who you Listen To!
My Twitter feed is loaded with (bad) takes on the recent drop in M2 Money supply that want to lead you to the belief the world is about to burn. Taking a step back, the Money Supply remains about $3.7 trillion dollars above the 2010-2019 trend (Graphic 1), far from the catastrophic drop presented by graphics showing only the YoY change (Graphic 2).
Graphic 1
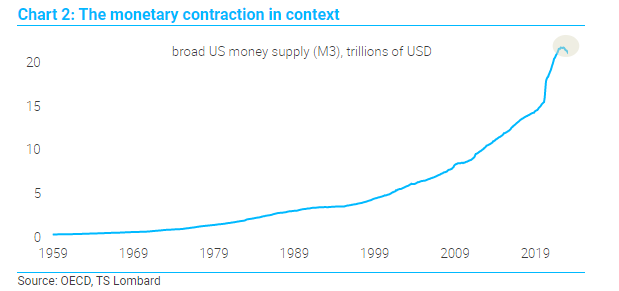 Source: TS Lombard. As of 04.19.2023
Graphic 2 (YoY)
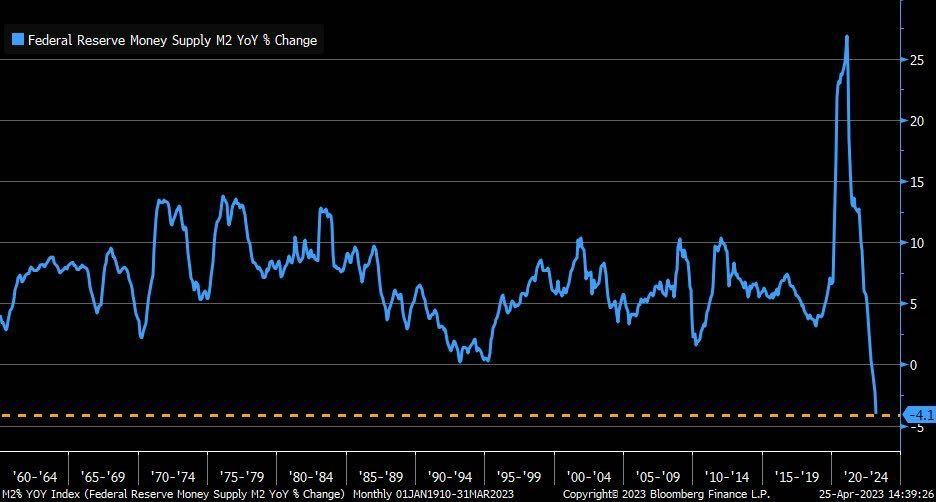 Source: Liz Sonders (Schwab). As of 04.25.2023
We all know that money is leaving banks for other higher-yielding alternatives. As we pointed out in a recent update, there are four major categories not part of M2 that are expanding rapidly (below). In addition, Nominal M2 underwent a formula change beginning May 2020 where “savings deposits including money market deposit accounts” were removed from the calculation.
- Reverse repo (RRP) with the Federal Reserve
- Large time deposits, or CDs of $100k (aka jumbo CDs)
- Institutional money market mutual funds
- Ultra-short fixed-income ETFs
Money is shifting around, but it’s simply investors moving their money into higher yielding vehicles given the shift in the Federal Funds rate.
Real GDP Still Solid
The GDPNow model estimate for real GDP growth (seasonally adjusted annual rate) in the first quarter of 2023 is 1.1 percent on April 26. This marked down from 2.5 percent on the 18th of April. The actual numbers come out tomorrow (4/27/23) and the survey says 2 percent quarter-over-quarter.
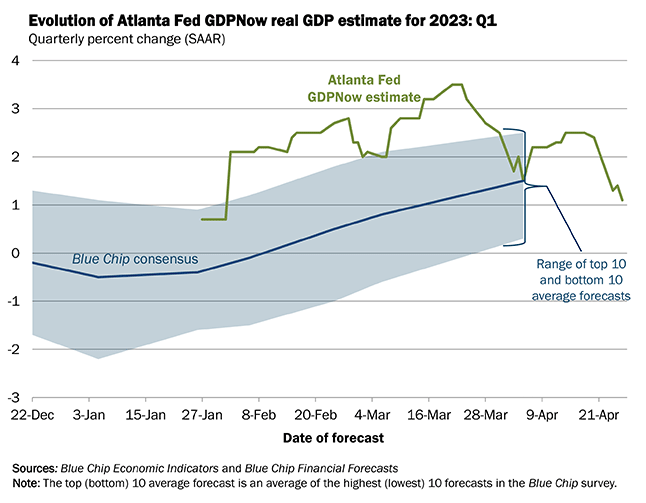 Source: ATL Fed. As of 04.26.2023
While everyone is expecting the economy to roll over imminently due to Fed rate hikes, a lot of data is not in alignment with that logic. While tougher times could be in the cards for the US economy, the data is not there yet. Household wealth following the COVID pandemic is still extrememly distorted, increasing the propensity to spend and reducing the need to save.
This macro cycle will take time to work through the system. It’s not a “snap your fingers” we enter into a recession and then the Fed immediately cuts rates and begins a new cycle. Inflation complicates things.
For proof, just look at earnings this cycle. Expectations for earnings recessions aren’t being supported by the reports. We’re still seeing sales growth, and flat to slightly downish earnings. Growing revenues isn’t deflationary.
To keep in line with previous comments, look no further than Pepsi’s earnings.
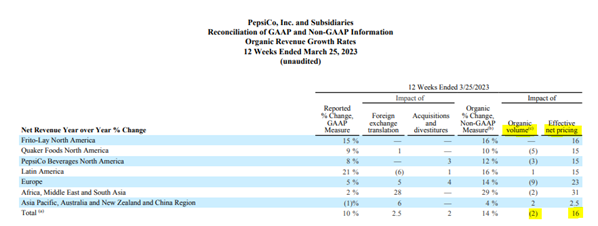 Source: Pepsi 10Q. As of 04.25.2023
Pricing up 16% and Volume only down 2%. That is what you call inelastic demand!
Municipal Credit Quality → Expensive but Paying up for Quality
S&P ran a study on the default rate or municipal bonds versus corporate bonds. The default rate study represents a 15-year cumulative default rate form January 1, 1986 – December 31, 2021 (municipal bonds), and January 1, 1981-December 31, 2021 (corporate bonds).
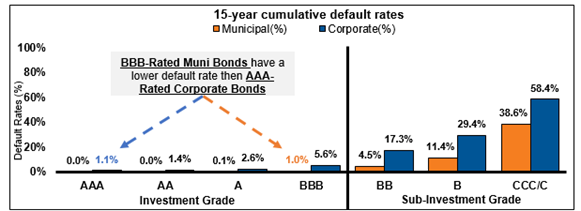 Source: S&P. As of 3.31.2023
Remember, relative to taxable bonds, the federally tax-exempt nature of municipal bonds allows municipalities to issue bonds at lower nominal yields than taxable issuers. According to S&P’s study, over the last 10 years this was 0.2% lower on average relative to corporate bonds.
Municipal bonds tend to finance services that are required to operate a municipality (roads, bridges, schools, transportation, water & sewer, etc.). These services are obviously important during normal times, but in times of crisis they become even more critical for the survival and recovery of a community. During the pandemic, the federal government provided support through financial aid to ensure their stability. This aid heightened tax receipts (from the increase in asset prices and real estate) which has slowed municipal issuance drastically, tightening their spread to Treasury bonds.
Bottom Line
Investors can’t overlook the structural resilience of the municipal market. This resilience has helped the municipal bond market offer attractive stability and credit strength to investor portfolios. Attractive after-tax income potential, and current yields are in a position to offer potential advantages during a time when future rate changes are uncertain. Over the last 15 years, BBB-rated municipal bonds—the lowest rung of investment grade—have experienced only a 1% default rate which is in-line with AAA-rated corporate bonds.
We generally love municipal bonds at Aptus, although due to the lack of issuance the last couple of years, the spreads vs alternatives aren’t attractive unless you are in the absolute highest tax bracket. We continue to monitor the space and will be excited to come back when we see a value opportunity.
Disclosures
Past performance is not indicative of future results. This material is not financial advice or an offer to sell any product. The information contained herein should not be considered a recommendation to purchase or sell any particular security. Forward looking statements cannot be guaranteed.
This commentary offers generalized research, not personalized investment advice. It is for informational purposes only and does not constitute a complete description of our investment services or performance. Nothing in this commentary should be interpreted to state or imply that past results are an indication of future investment returns. All investments involve risk and unless otherwise stated, are not guaranteed. Be sure to consult with an investment & tax professional before implementing any investment strategy. Investing involves risk. Principal loss is possible.
Advisory services are offered through Aptus Capital Advisors, LLC, a Registered Investment Adviser registered with the Securities and Exchange Commission. Registration does not imply a certain level or skill or training. More information about the advisor, its investment strategies and objectives, is included in the firm’s Form ADV Part 2, which can be obtained, at no charge, by calling (251) 517-7198. Aptus Capital Advisors, LLC is headquartered in Fairhope, Alabama. ACA-2304-29.
