
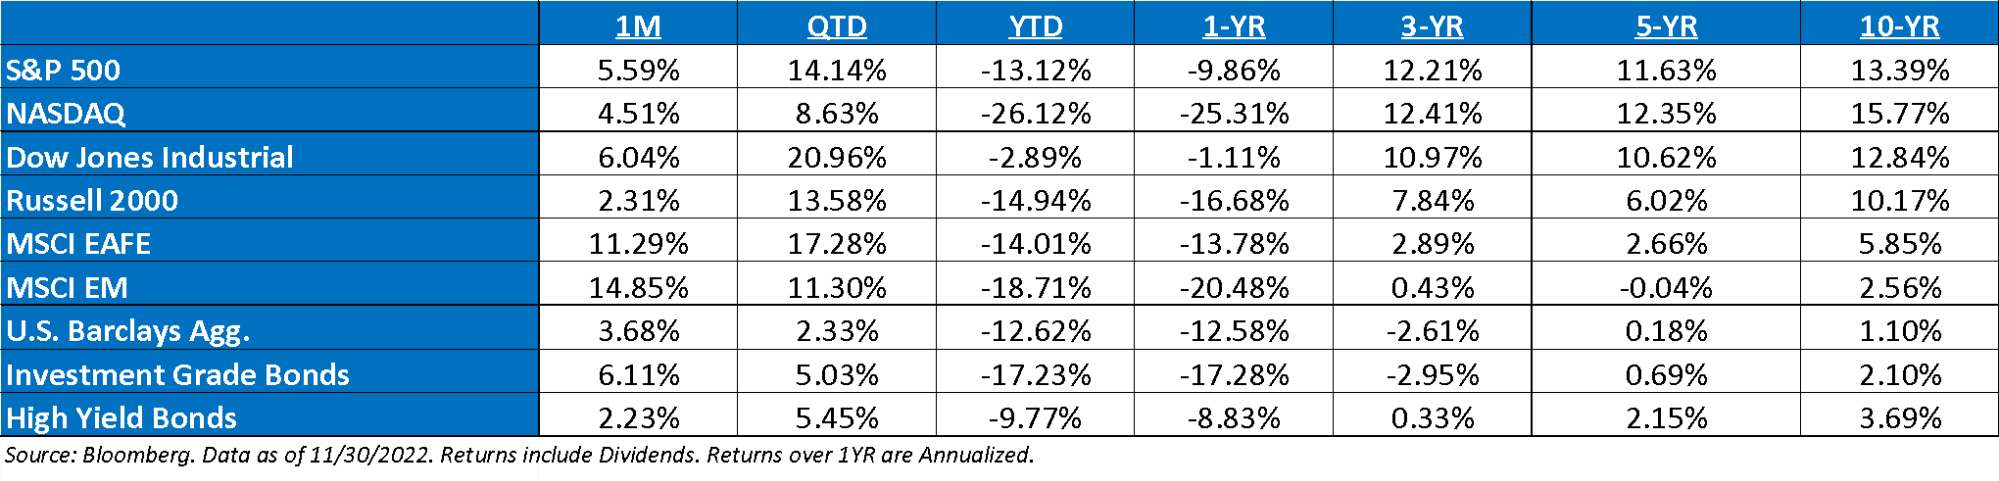
November 2022 Market Recap: The S&P 500 bounce in November (+5.4%) occurred as the US yield curve inverted further as the 10 year treasury yields rallied. This is the second straight month of strong gains, as October returned +8.1%. It feels as if the market is focusing on stronger-than-expected earnings growth and the potential for a Fed pivot. Markets this year continue to be driven by yields, as we saw both stocks and bonds up during the month, as the 10YR Treasury saw some reprieve. Given the year-to-date returns, we were somewhat surprised by the amount of equity inflows to the market during the month of +$20B.
Jerome Powell’s Press Conference Notes: The most important thing to keep in mind is that Powell did not say anything new at the Brookings Conference, yet markets rallied due to the three following sentences:
“The time for moderating the pace of rate increases may come as soon as the December meeting.”
Great, but everybody knew this ever since vice chair Brainard hinted at it almost two months ago. It was also nearly perfectly priced by futures markets.
“It seems to me likely that the ultimate level of rates will need to be somewhat higher than thought at the time of the September meeting.”
This is not dovish, obviously, but it was also completely known as Powell said the same thing at the last press conference.
“It is likely that restoring price stability will require holding policy at a restrictive level for some time.”
This was also well known before as Powell, Brainard, and others expressed the same concept before. In Fed-speak “some time” indicates a period of time of intentionally vague but not short length and it’s fair to infer that the Fed does not envision rate cuts next year.
Recent GDP Readings: After two consecutive quarters of decline, US GDP rebounded sharply at an annualized 2.9% in the third quarter, but the snapback resulted from a dramatic swing in trade, inventories, and government spending. Indeed, trade boosted GDP growth by 2.8%, reflecting strong exports – which was a weakness in the previous reports. GDP excluding inventories, trade, and government spending has steadily lost steam since the start of this year, coming in at just 0.08% in Q3. This shows that the nominal economy remains strong
No Help from Bond Markets: The year-to-date pain in the bond markets was not apparent in November, with the U.S. Aggregate Index still down almost 12.6% year-to-date. Since the late 1970s, no other year has come close to experiencing similar pain in the bond market. U.S. bonds are now 17.8% off their peak in July ‘20. Except for the drawdown that ended in February 1980 (when the index was only calculated monthly), this is almost twice as large as the next biggest drawdown on record.
Where is The Fed Put? We continue to believe that the Fed Put is much lower right now, as FOMC Chairman Jerome Powell, has stated that the Fed is going to keep raising until we have a recession unless inflation meaningfully improves. The cause of the decline is equally important. The Fed has a long history of easing policy in response to earnings drops, but there isn’t much evidence that it responds to multiple compression. The fact that inflation is higher than at any time since the genesis of the Fed Put and that stocks have appreciated a lot over the past two years suggest the strike is well below current prices. Similarly, the recent decline in stock prices owes exclusively to lower multiples; it would take another leg down induced by a drop in earnings to impress the Fed.
“Phantom Earnings” Moving Forward: Earnings likely to play an increasingly bigger role from a directional standpoint as the market transitioned from inflation to growth frustration. We believe that consensus estimates still need to come down to reflect a softening macro backdrop and inflation/margin pressures. We remain skeptics that the current 2023 earnings expectations for the S&P 500 remain too high. On average, earnings, as a whole, tend to fall between 15% – 20%, of which, earnings are 8.7% off their highs.
S&P Valuation: The S&P 500 valuation increased over the month, as the market had a strong month, coupled with earnings expectations falling 1.7% since 10/31. The market trades at 18.2x (17.2x last month).
Earnings – 2022 S&P 500 operating earnings = $221 (+8.3%). 2023 = $231 (+4.5%). 2021 = $204. 2020 = $136. 2019 = $161. *
Valuations: S&P 500 Fwd. P/E: 18.2x, EAFE: 12.1x, EM: 11.0x, R1V: 14.4x, R1G: 24.0x, and R2K: 12.4x. *
*Source: Bloomberg and FactSet, Data as of 11/30/22
Disclosures
Aptus Capital Advisors, LLC is a Registered Investment Advisor (RIA) registered with the Securities and Exchange Commission and is headquartered in Fairhope, Alabama. Registration does not imply a certain level of skill or training. For more information about our firm, or to receive a copy of our disclosure Form ADV and Privacy Policy call (251) 517-7198 or contact us here. Information presented on this site is for educational purposes only and does not intend to make an offer or solicitation for the sale or purchase of any securities.
This commentary offers generalized research, not personalized investment advice. It is for informational purposes only and does not constitute a complete description of our investment services or performance. Nothing in this commentary should be interpreted to state or imply that past results are an indication of future investment returns. All investments involve risk and unless otherwise stated, are not guaranteed. Be sure to consult with an investment & tax professional before implementing any investment strategy.
Past performance is not indicative of future results. This material is not financial advice or an offer to sell any product. The information contained herein should not be considered a recommendation to purchase or sell any particular security. Forward looking statements cannot be guaranteed.
The S&P 500® is widely regarded as the best single gauge of large-cap U.S. equities. There is over USD 11.2 trillion indexed or benchmarked to the index, with indexed assets comprising approximately USD 4.6 trillion of this total. The index includes 500 leading companies and covers approximately 80% of available market capitalization.
The Nasdaq Composite Index measures all Nasdaq domestic and international based common type stocks listed on The Nasdaq Stock Market. To be eligible for inclusion in the Index, the security’s U.S. listing must be exclusively on The Nasdaq Stock Market (unless the security was dually listed on another U.S. market prior to January 1, 2004 and has continuously maintained such listing). The security types eligible for the Index include common stocks, ordinary shares, ADRs, shares of beneficial interest or limited partnership interests and tracking stocks. Security types not included in the Index are closed-end funds, convertible debentures, exchange traded funds, preferred stocks, rights, warrants, units and other derivative securities.
The Dow Jones Industrial Average® (The Dow®), is a price-weighted measure of 30 U.S. blue-chip companies. The index covers all industries except transportation and utilities.
The Russell 2000® Index measures the performance of the small-cap segment of the US equity universe. The Russell 2000® Index is a subset of the Russell 3000® Index representing approximately 10% of the total market capitalization of that index. It includes approximately 2,000 of the smallest securities based on a combination of their market cap and current index membership. The Russell 2000® is constructed to provide a comprehensive and unbiased small-cap barometer and is completely reconstituted annually to ensure larger stocks do not distort the performance and characteristics of the true small-cap opportunity set.
The MSCI EAFE Index is an equity index which captures large and mid-cap representation across 21 Developed Markets countries*around the world, excluding the US and Canada. With 902 constituents, the index covers approximately 85% of the free float-adjusted market capitalization in each country.
The MSCI Emerging Markets Index captures large and mid-cap representation across 26 Emerging Markets (EM) countries*. With 1,387 constituents, the index covers approximately 85% of the free float-adjusted market capitalization in each country.
Investment-grade Bond (or High-grade Bond) are believed to have a lower risk of default and receive higher ratings by the credit rating agencies. These bonds tend to be issued at lower yields than less creditworthy bonds.
Non-investment-grade debt securities (high-yield/junk bonds) may be subject to greater market fluctuations, risk of default or loss of income and principal than higher-rated securities.
Nasdaq-100® includes 100 of the largest domestic and international non-financial companies listed on the Nasdaq Stock Market based on market capitalization.
The Bloomberg Barclays U.S. Aggregate Bond Index is a broad-based benchmark that measures the investment grade, U.S. dollar-denominated, fixed-rate taxable bond market. This includes Treasuries, government-related and corporate securities, mortgage-backed securities, asset-backed securities, and collateralized mortgage-backed securities.
The content and/or when a page is marked “Advisor Use Only” or “For Institutional Use”, the content is only intended for financial advisors, consultants, or existing and prospective institutional investors of Aptus. These materials have not been written or approved for a retail audience or use in mind and should not be distributed to retail investors. Any distribution to retail investors by a registered investment adviser may violate the new Marketing Rule under the Investment Advisers Act. If you choose to utilize or cite material we recommend the citation, be presented in context, with similar footnotes in the material and appropriate sourcing to Aptus and/or any other author or source references. This is notwithstanding any considerations or customizations with regards to your operations, based on your own compliance process, and compliance review with the marketing rule effective November 4, 2022. ACA-2212-1.