
This year, Fall is arriving alongside a debt conversation that never really goes away, and rates that have climbed to levels unseen in over a decade+.
Which brings us to the debt conversation. Many have called the U.S. debt situation a house of cards for decades now, predicting collapse any minute. And for decades, that collapse hasn’t come. The permabears keep losing that bet, yet somehow keep making it. As longtime readers know, I fall in the rational optimist camp, not the perpetual pessimist one. And, if I ever contract rabies, those perpetual permabears would be at the top of my bitin’ list.
So let’s get into it. This musing covers three things:
1. Understanding the current debt load,
2. Whether that debt is what’s really driving rates higher, and
3. How we should be talking about debt when it comes to building portfolios
Onward.
Never Let a Crisis Go to Waste
Understanding the Current Debt Load
We’ve fielded a lot of client questions about the U.S. debt situation lately, and it’s easy to see why: the 10-year Treasury yield just climbed above 5%, closing at its highest level since 2007, as a global bond selloff intensifies due to surging energy prices, sticky inflation, and mounting fiscal concerns. With borrowing costs now at levels not seen since the financial crisis, worries about the sustainability of America’s debt load have understandably moved back to the front burner for many investors. Simply put, will the can continue to be kicked down the road, or will the bill come due soon?
The deficit remains near 6% of GDP (with the labor market at full employment). Only a handful of times in American history has it been this large relative to GDP: the Civil War, World War I, World War II, the Great Financial Crisis, and COVID. In each of those cases, the country was in crisis and spending to get out of it. We are not in crisis right now. We are spending at levels as if we were.
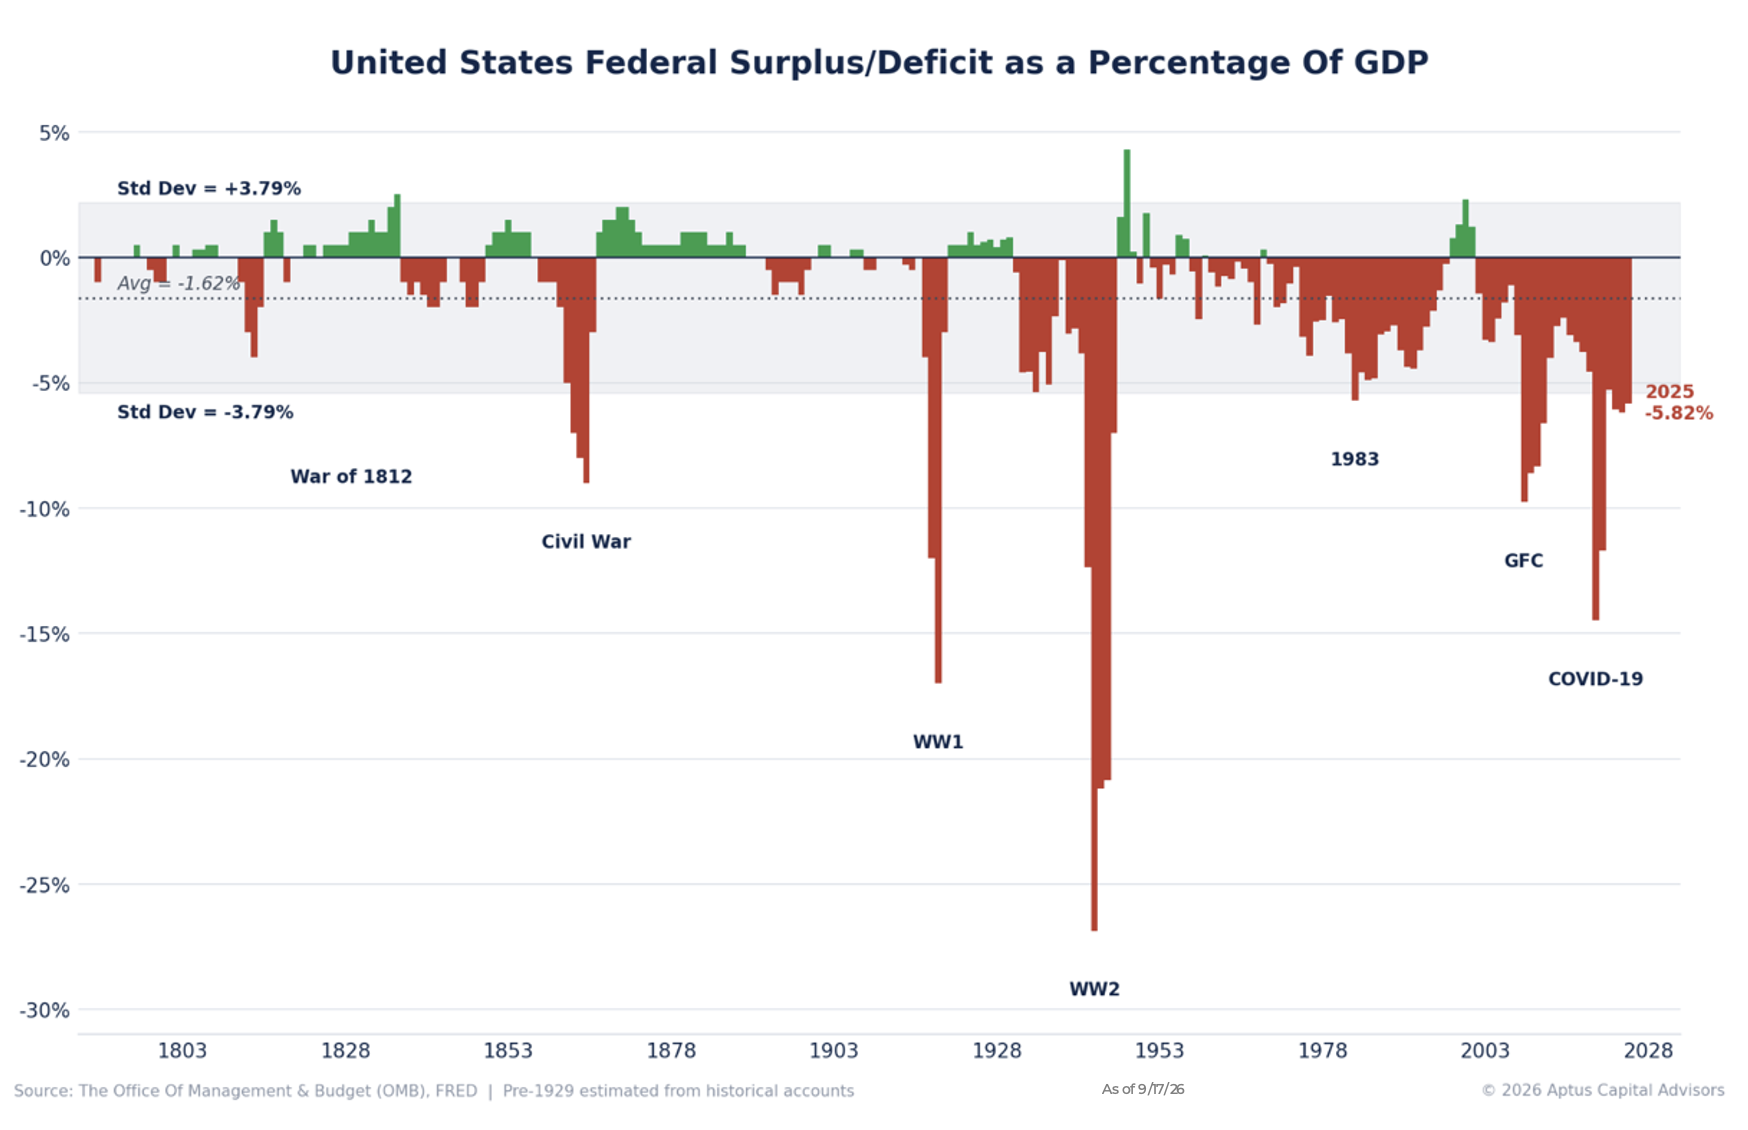
So, maybe the question is: Do we have a debt problem or a spending problem? I understand that the answer is technically both, but look at the chart below; it shows the debt-as-a-percentage-of-GDP, and it has come down from its COVID highs.
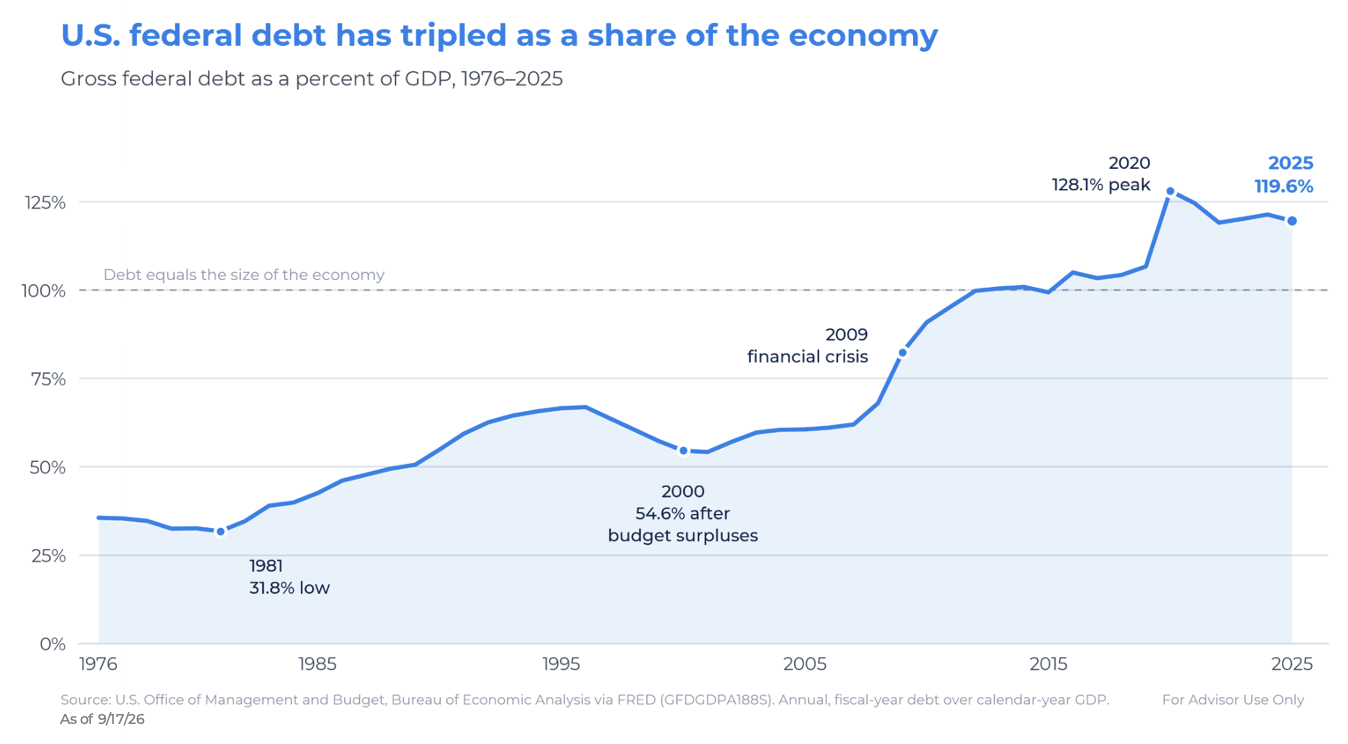
It’s better to look at debt as a share of GDP rather than in raw dollars – the total U.S. debt has actually eased back from its COVID-era peak of ~128% to roughly 119% today – and that’s the more meaningful lens, since it scales debt to the economy’s capacity to carry it rather than just its dollar size, which will almost always look scarier because it never stops growing in nominal terms. That said, this improvement is doing a lot of the flattening here. Why is it flattening? Interest expense keeps climbing as old low-rate debt rolls into today’s higher rates. This widens the deficit on its own and is arguably a bigger structural concern than the debt ratio itself because interest expense accounts for ~18% of the tax receipts. We’ve always stated that Fiscal policy tends to require some austerity above 15% – but that’s definitely not happening right now, and the bond market is taking notice.
And that’s one reason the market has witnessed rate increases across the entire yield curve (to be frank, this is not a standalone U.S. issue).
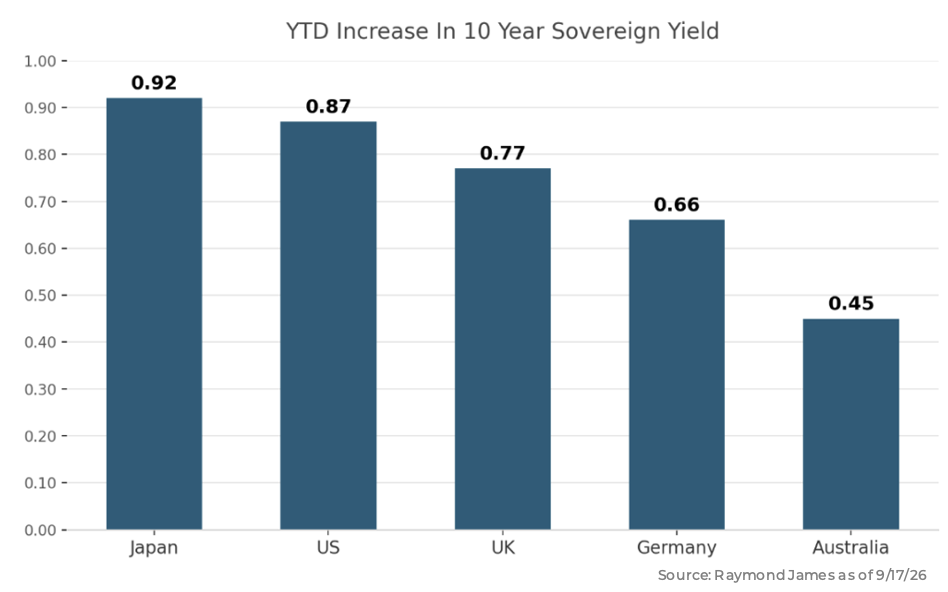
Yet, we just had a rate hike this week. In fact, since the last cut, the 10YR Treasury is +1.30% – the market is telling the Fed something. But corrections almost never happen on the first rate hike. It took three hikes to trigger 1987’s crash, five in 2000, before markets finally accepted inflation wasn’t going away. The real warning sign is stocks rallying hard while long yields climb sharply and everyone ignores it. In 1987, the 10-year jumped from roughly 6% to 9% while the S&P ran up about 30% year-to-date, right before the October crash. In 1999-2000, the 10-year rose from about 4.25% to 6.66% as the S&P gained 21% and the Nasdaq soared 86%, right before the top.
Even with the above Fed commentary, I’m a firm believer that the bond market has shifted its focus from Monetary policy to Fiscal policy.
Why are Rates Going Higher?
Nominal 10-year yields move due to three reasons: (1) inflation expectations, (2) real growth expectations, and (3) the term premium (the extra compensation investors demand for holding duration beyond just rolling short-term bills). Let’s walk through each:
1. Inflation Breakevens: The 10YR breakeven inflation is anchored around 2.35-2.40%, right at the Fed’s target – despite the oil headlines, inflation isn’t the real story.
2. Growth: Real GDP is running mid-3s to 4%, a snapback pace more typical of an early recovery than late-cycle trend growth.
3. Term Premium: Swung from deeply negative in the QE years to solidly positive, as heavy Treasury issuance against a ~6.5% of GDP deficit meets a shrinking pool of price-insensitive buyers.
Growth and the Term Premium are doing the heavy lifting while inflation breakevens stay remarkably quiet. That’s the part that would surprise many people still reflexively blaming “inflation fears” for higher yields.
Tavis McCourt, Raymond James’ Economist (great guy), released a great regression analysis on growth and the 10YR Treasury, i.e., given certain levels of growth, where should the 10-year trade? Currently, markets are pricing in an economy to run at 6.5% – 7% nominal GDP growth in the second half of 2026. Under the full historical dataset since 1956, that maps to a 10YR yield of roughly 6.2–6.5%; using only data from 1990 onward, it maps to a lower 5.2–5.4%. We lean toward the 1990-forward estimate as the better guide, since globalization and the Fed’s 2% inflation target have fundamentally reshaped bond market dynamics relative to the 1960s–1980s era.
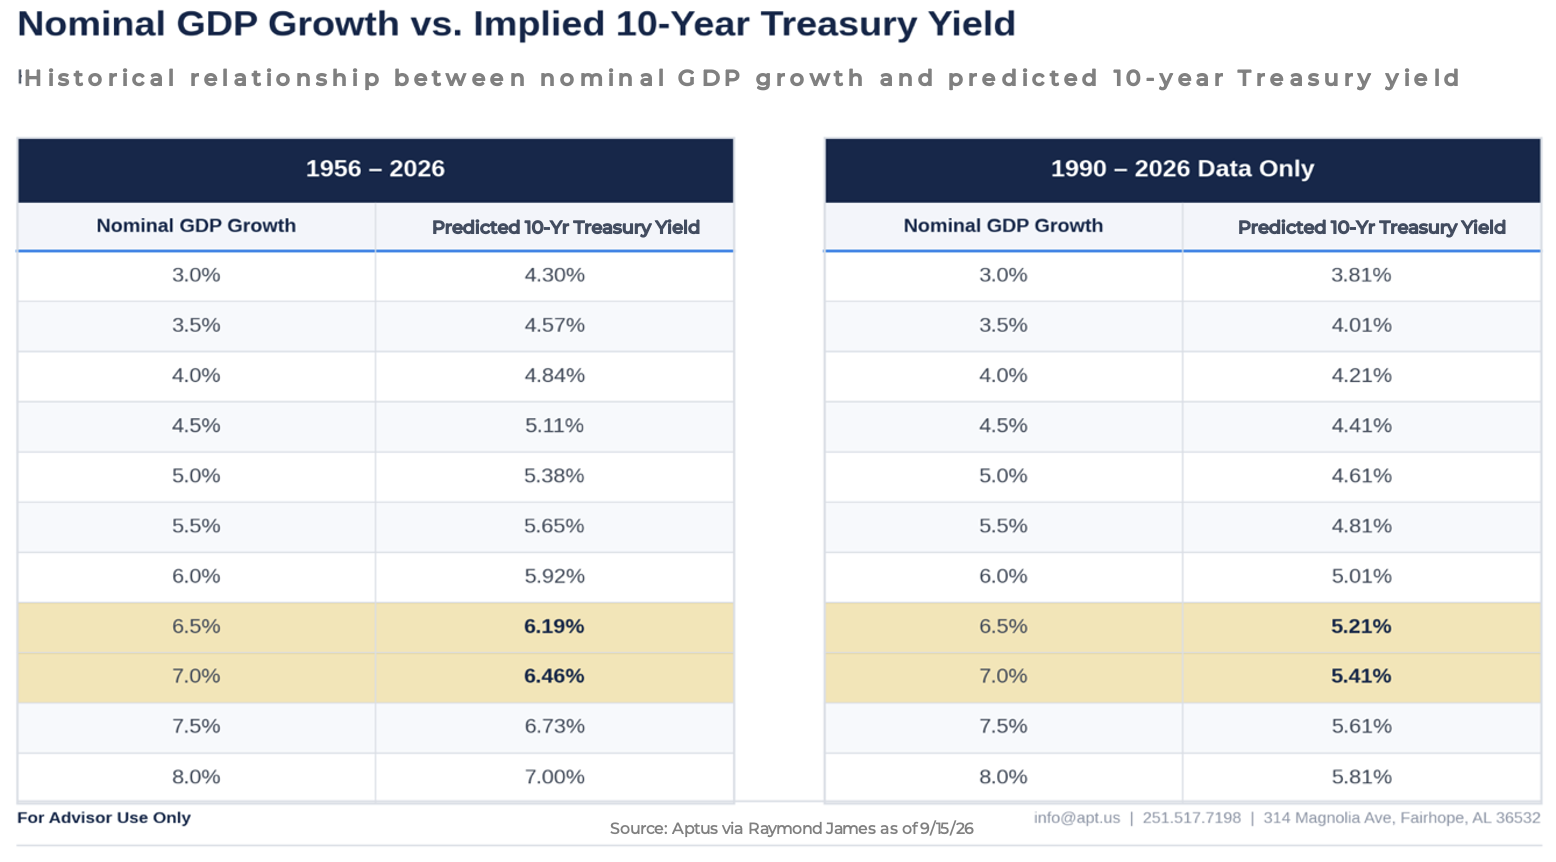
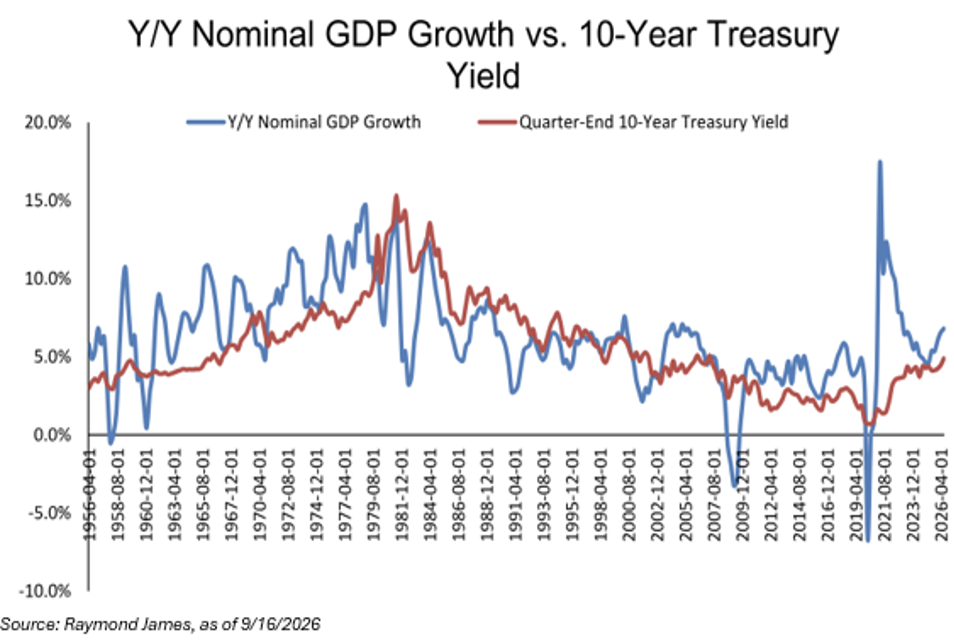
This just shows how difficult it is to time the direction of rates.
How Aptus Speaks About Debt in the Context of Asset Allocation
Aptus attacks the debt problem where we can actually do something about it: the asset allocation. More stocks, fewer bonds, risk-neutral. It sounds backwards with debt at these levels, but the biggest risk in a client’s portfolio right now isn’t being too aggressive. It’s being too conservative.
We believe there are only three ways out of a debt problem: austerity, growth, or inflation. Austerity doesn’t work because no government sticks with it long enough to matter, which leaves the other two, and the U.S. is leaning on both. Treasury Secretary Scott Bessent has said it plainly: rising debt is fine as long as the economy grows faster than the debt does. That growth engine is why America has an exit ramp a lot of other debt-heavy countries don’t, and it’s why we keep coming back to the chart above (Debt-to-GDP ratio). Either way out is a problem for bonds. Grow out of it and equity captures the upside. Inflate out of it and bonds pay the bill. So, we own more of the first and less of the second.
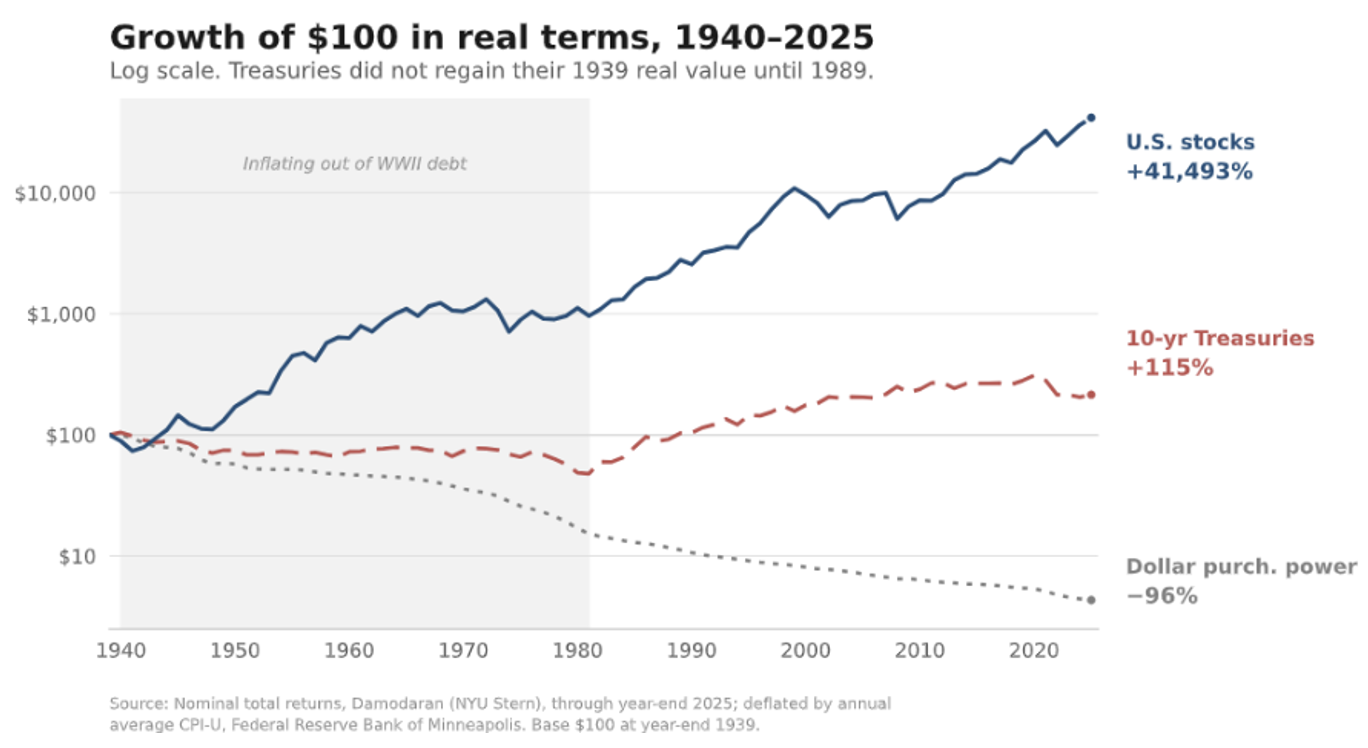
Which raises the obvious question: if you’re leaning less on bonds, what’s protecting the portfolio?
Bonds still have a job. They give clients income and near-term clarity, and we still own them. What they can’t do is carry the defense by themselves. A bond isn’t a hedge; it’s a diversifier, and its cushion depends on a negative correlation that isn’t dependable. Stock/bond correlation has spent more of history positive than negative, and 2022 is the recent proof: rates spiked, and both sides of the 60/40 fell at once.
So, we stop asking bonds to be the hedge and buy the protection directly instead, with convex payoffs that show up on schedule rather than on hope. That swap is what pays for the equity. Fund the brakes with hedges and spend the freed-up risk budget on stocks. Bigger engine, better brakes, and a client can hold meaningfully more of what compounds at a drawdown profile comparable to what they own today.
That’s the answer to the debt problem in one move rather than three. We own hedges so we can afford to own the assets that win.
As JD says: “You either own the risk assets that appreciate, or you own the currency (bonds) that gets debased.”
Disclosures
Past performance is not indicative of future results. This material is not financial advice or an offer to sell any product. The information contained herein should not be considered a recommendation to purchase or sell any particular security. Forward looking statements cannot be guaranteed.
This commentary offers generalized research, not personalized investment advice. It is for informational purposes only and does not constitute a complete description of our investment services or performance. Nothing in this commentary should be interpreted to state or imply that past results are an indication of future investment returns. All investments involve risk and unless otherwise stated, are not guaranteed. Be sure to consult with an investment & tax professional before implementing any investment strategy. Investing involves risk. Principal loss is possible.
Advisory services are offered through Aptus Capital Advisors, LLC, a Registered Investment Adviser registered with the Securities and Exchange Commission. Registration does not imply a certain level of skill or training. More information about the advisor, its investment strategies and objectives, is included in the firm’s Form ADV Part 2, which can be obtained, at no charge, by calling (251) 517-7198. Aptus Capital Advisors, LLC is headquartered in Fairhope, Alabama. ACA-2609-20.