
Our team looks at a lot of research throughout the day. Here are a handful of charts we think are good summations of investor activity: from a Fed pushed back into hiking mode, to a market that looks calmer on the surface than it does underneath, earnings and margins doing their job to keep prices up, and inflation keeping the cost of debt elevated across the curve.
Have a great weekend!
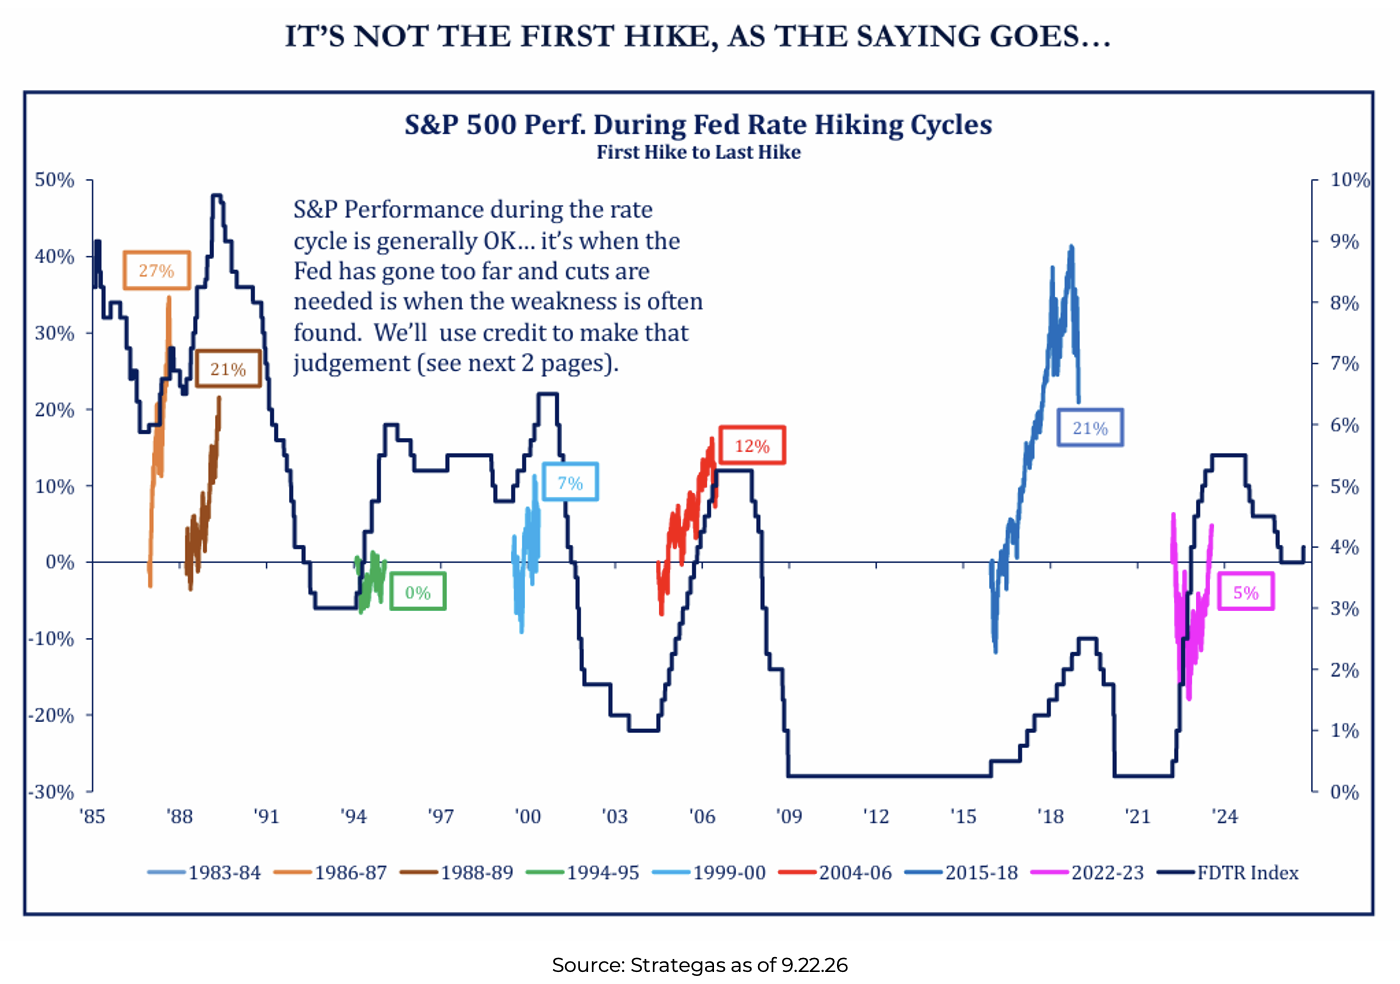
John Fox: This cycle’s first-hike-to-last-hike stretch has produced a 5% gain so far, right in line with the calmer cycles of 1994 and 1999. History says the real test comes after the Fed cuts, not during the hikes themselves.
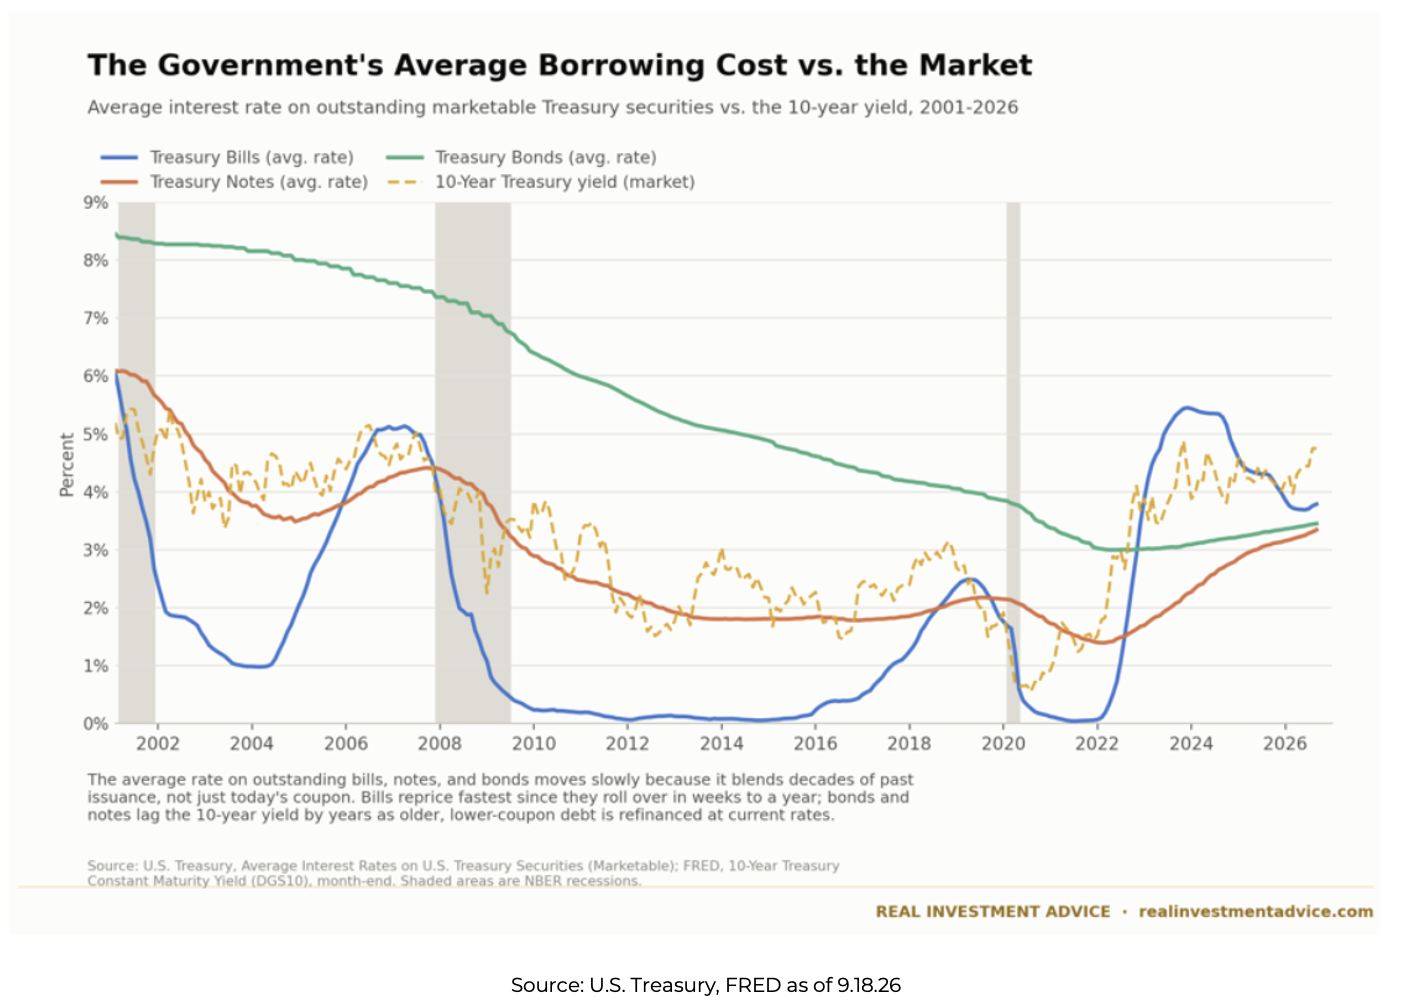
Jake: The blended rate on outstanding Treasury debt is still catching up to the market, running near 3.5% against a 10-year yield now above 5%. Bills reprice fastest since they roll over within a year, while bonds issued a decade ago keep the average low for years to come.
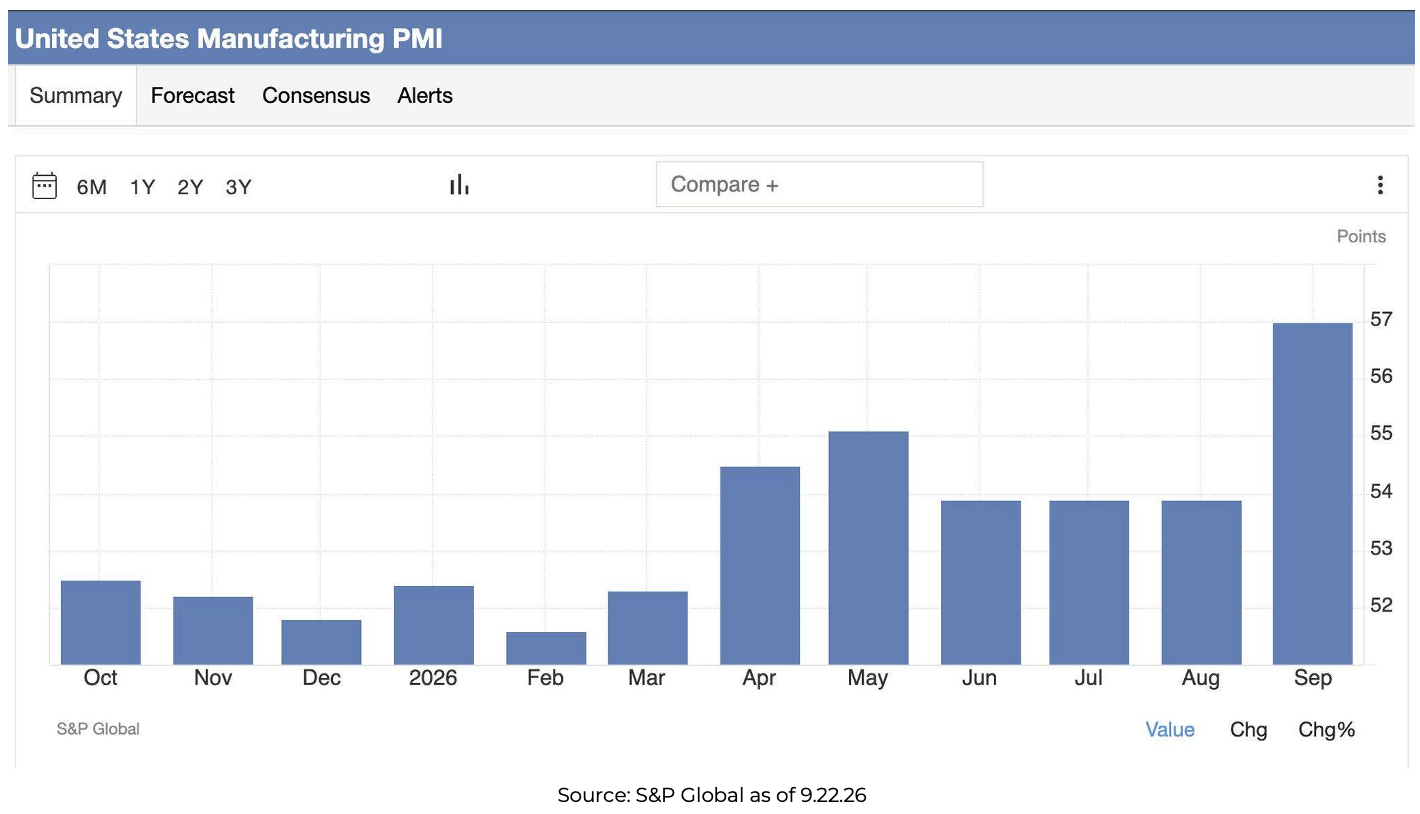
Brian: Manufacturing PMI jumped to 57 in September, its best print of the year. The manufacturing recession narrative is getting impossible to defend.
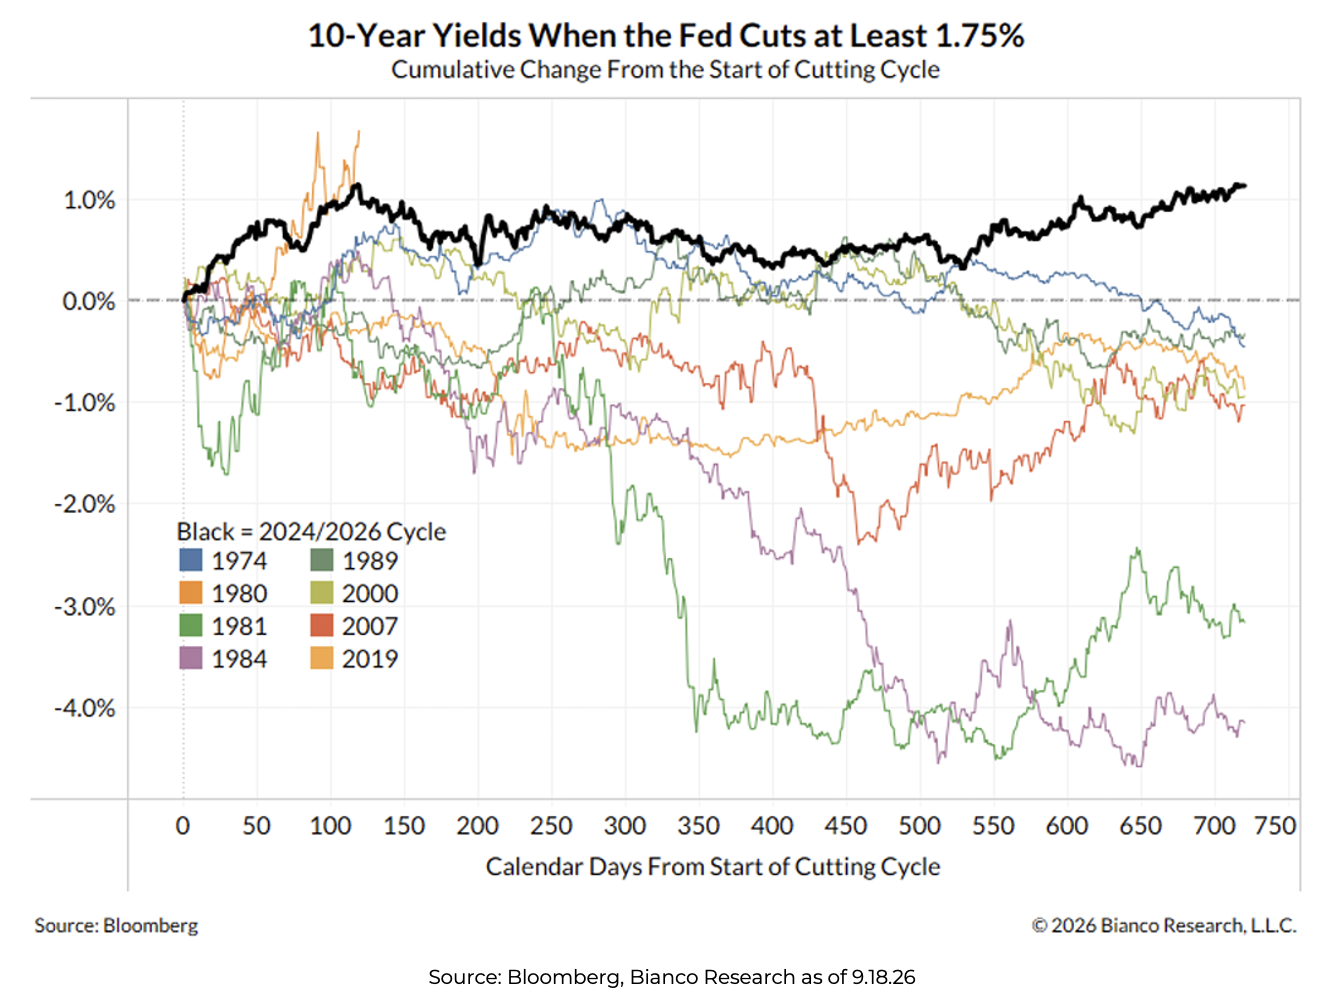
Ten: This cutting cycle has pushed 10-year yields 1% higher since it began, the opposite of nearly every past cycle, which outlined the cuts may have been premature. Six of the eight prior 1.75%+ cutting cycles saw yields fall over the same stretch.
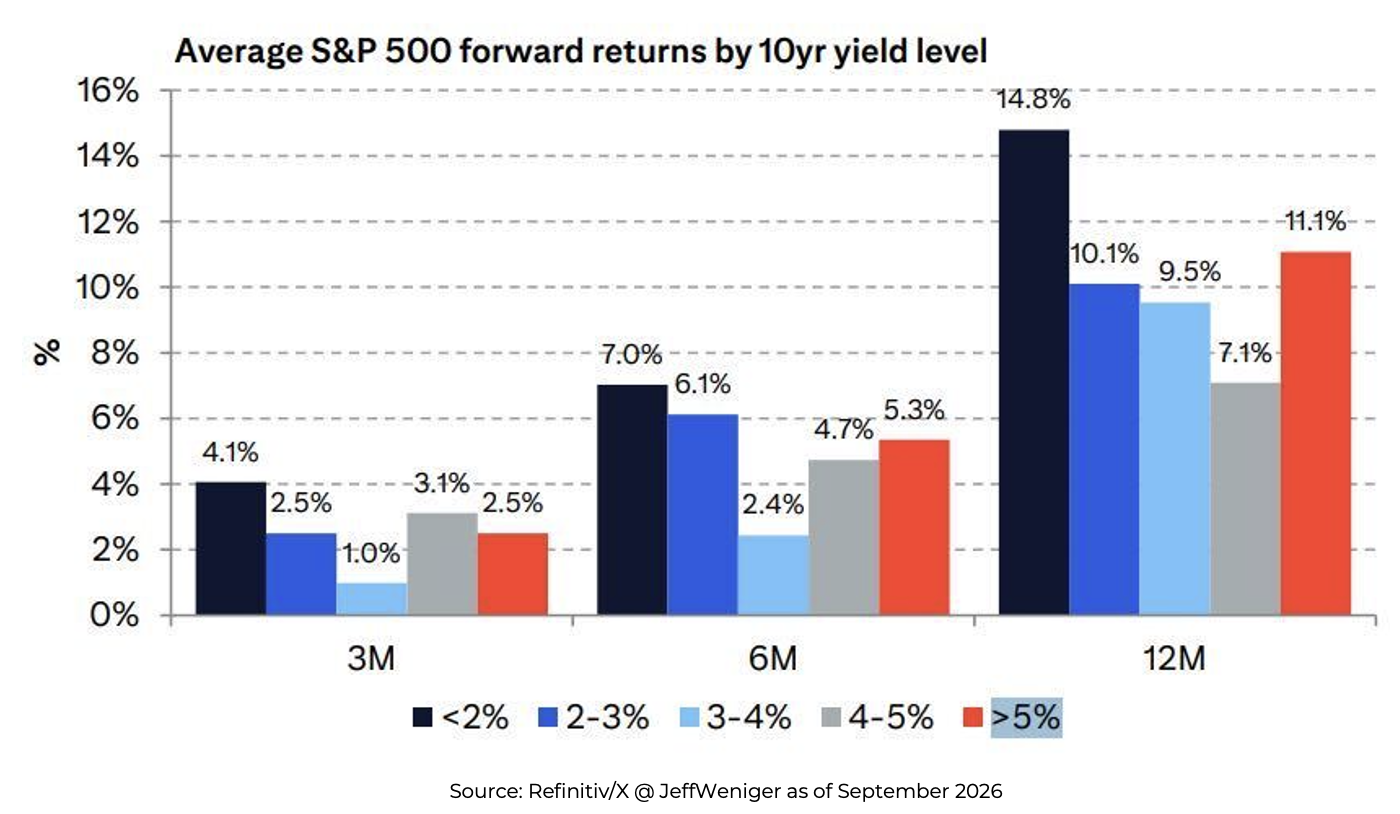
John Luke: A higher 10-year yield hasn’t been the return-killer investors assume. When rates have been above 5%, stocks have still averaged an 11% 12-month forward return, ahead of both the 3-4% and 4-5% buckets.
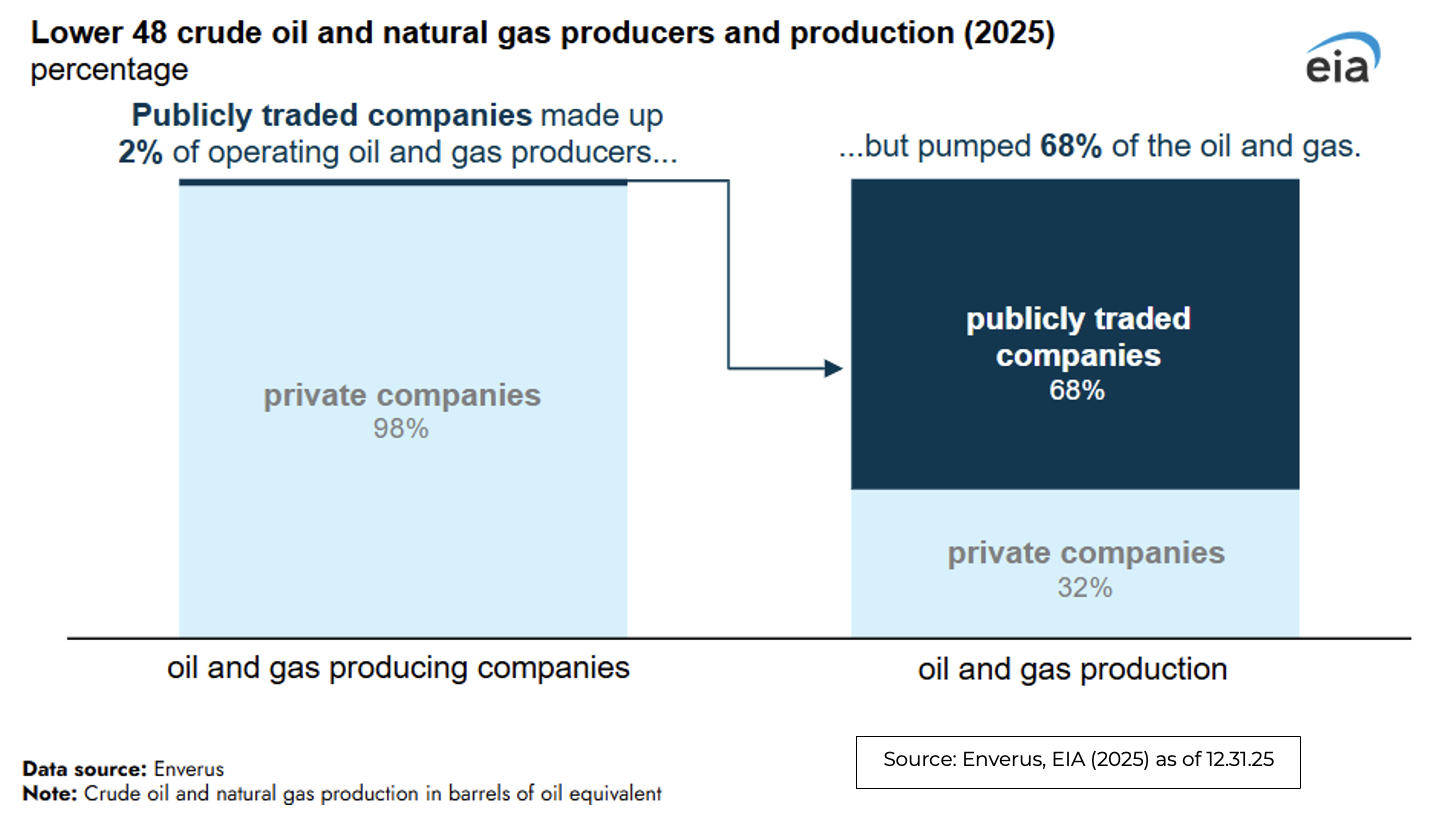
Joseph: Just 2% of the lower 48 oil and gas producers are publicly traded, yet they account for 68% of production, showing high levels of concentration.
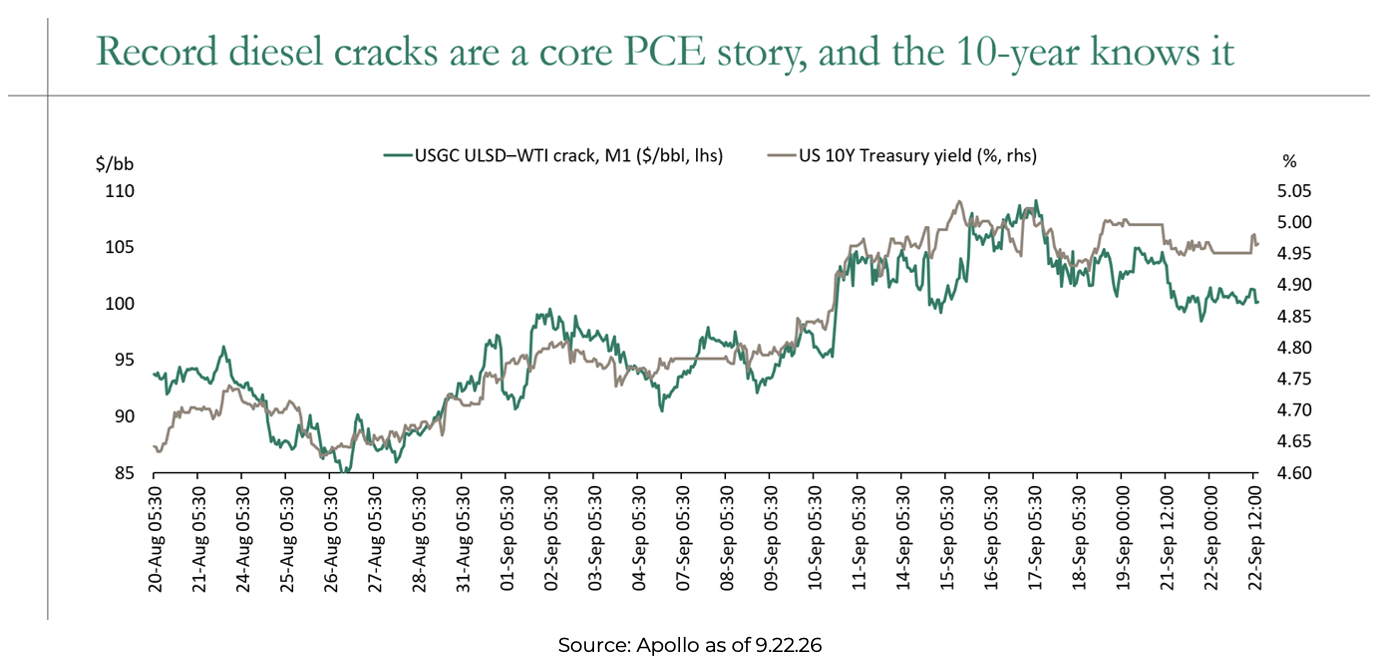
Brad: Perhaps a function of that limited competition is that diesel “cracks the profit margin a refiner earns turning crude oil into a finished fuel product” are running near their highest levels of the year, a cost that flows straight into core PCE. The 10-year Treasury yield has tracked that move almost tick for tick since Labor Day.
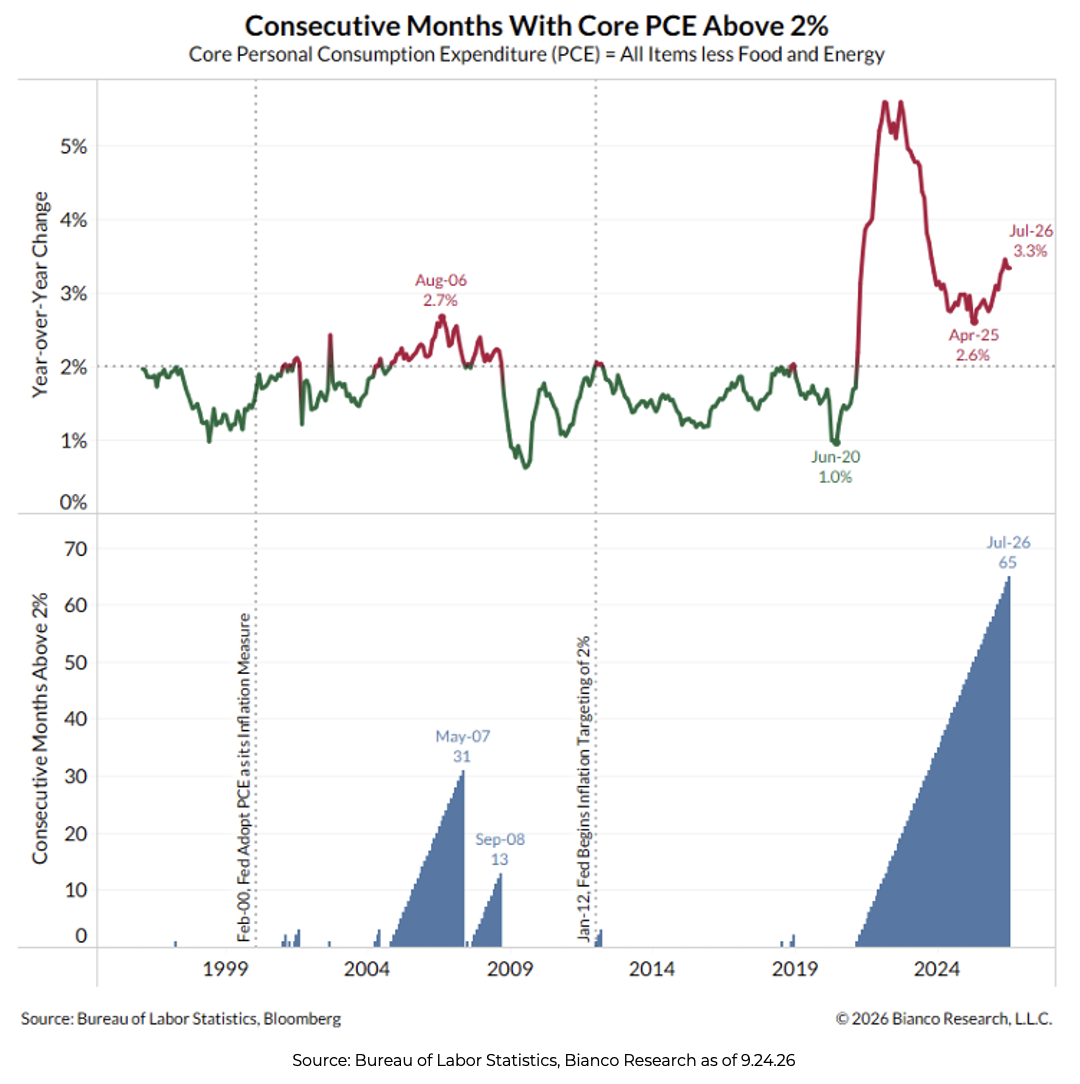
Mike: Core PCE has now run above 2% for 65 straight months, more than double the prior record of 31 months set heading into the financial crisis. The Fed’s target has been more aspiration than reality for over five years.
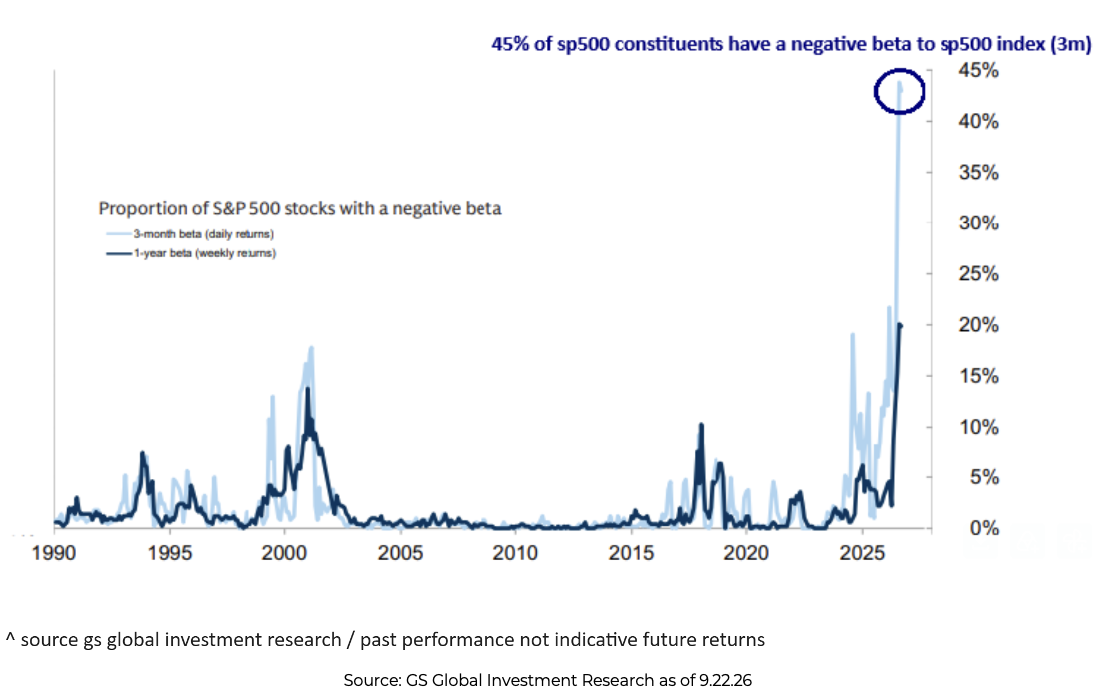
Derek: 45% of S&P 500 constituents now carry a negative 3-month beta to the index, a level not seen since at least 1990. The 1-year measure has jumped to 20%, more than double its prior high, a sign the index’s gains are being carried by a shrinking group of stocks rather than the market as a whole.
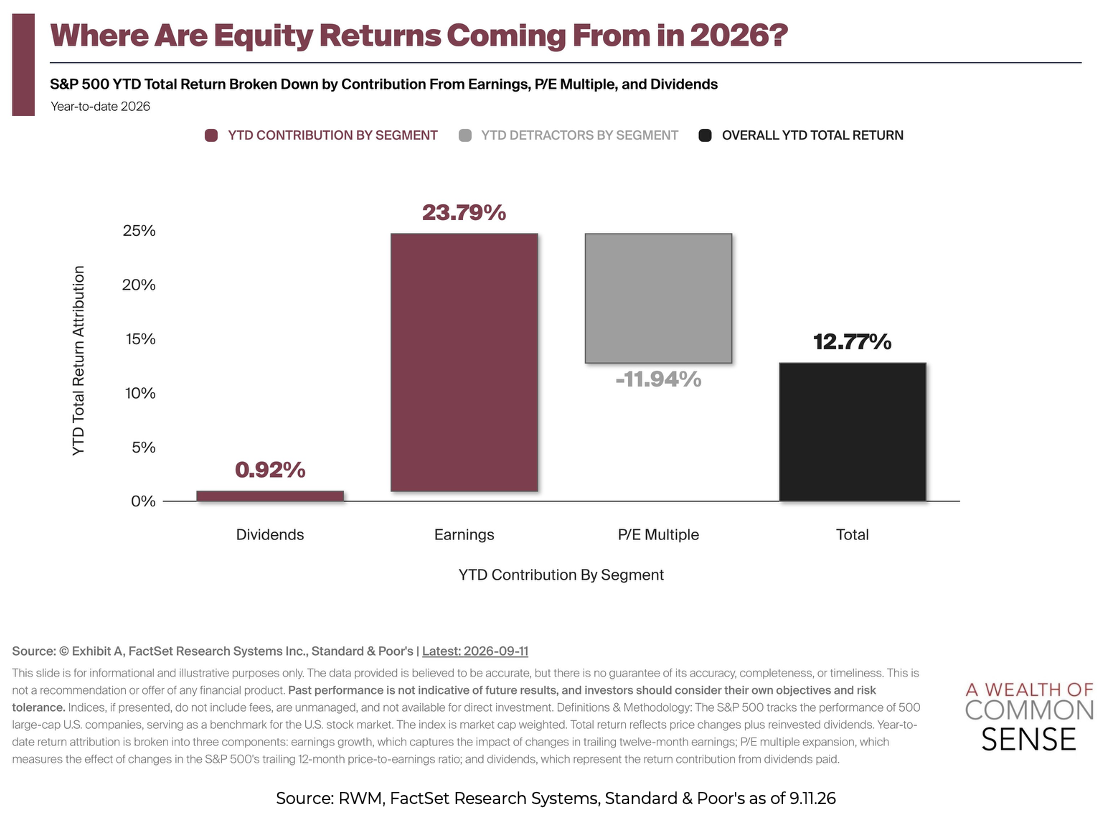
Beckham: Earnings, not multiple expansion, are doing the heavy lifting this year. Earnings growth has contributed 24% of the S&P’s 13% year-to-date return, while the P/E multiple has actually subtracted 11%.
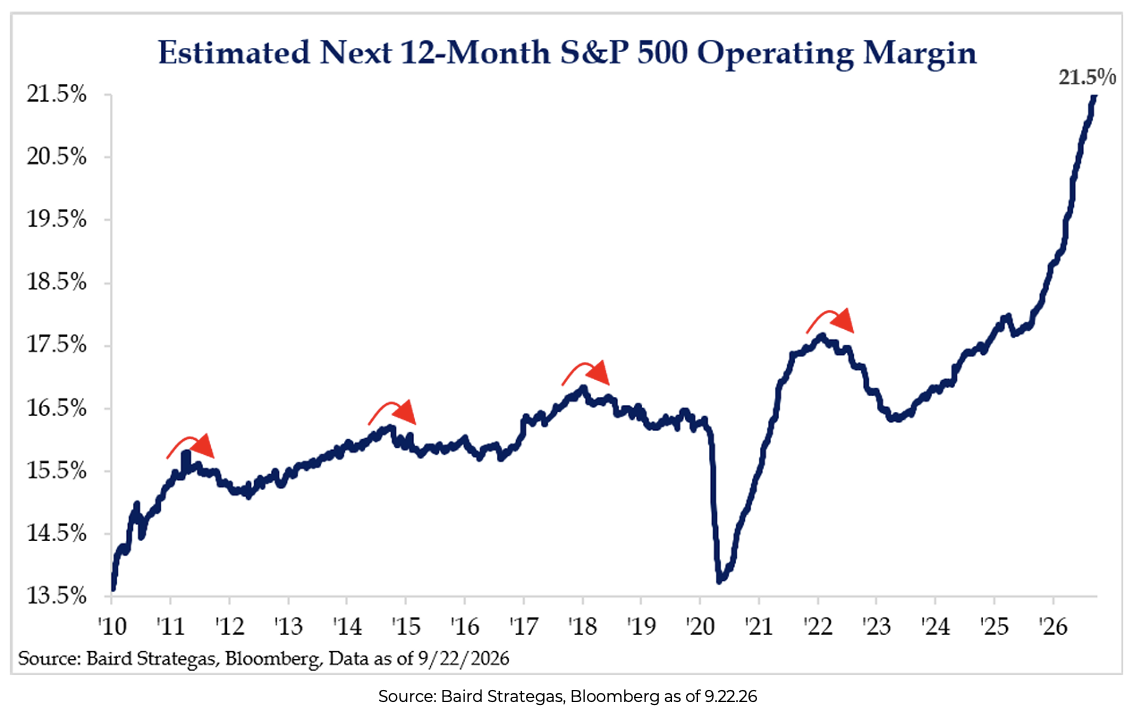
Dave: We continue to be impressed by the move in operating margins and, so far, have seen little evidence that the trend is slowing. The one thing that makes us somewhat cautious is the shape of the move. The chart looks increasingly parabolic, and one thing we have learned over the years is that parabolic moves are rarely sustained indefinitely.
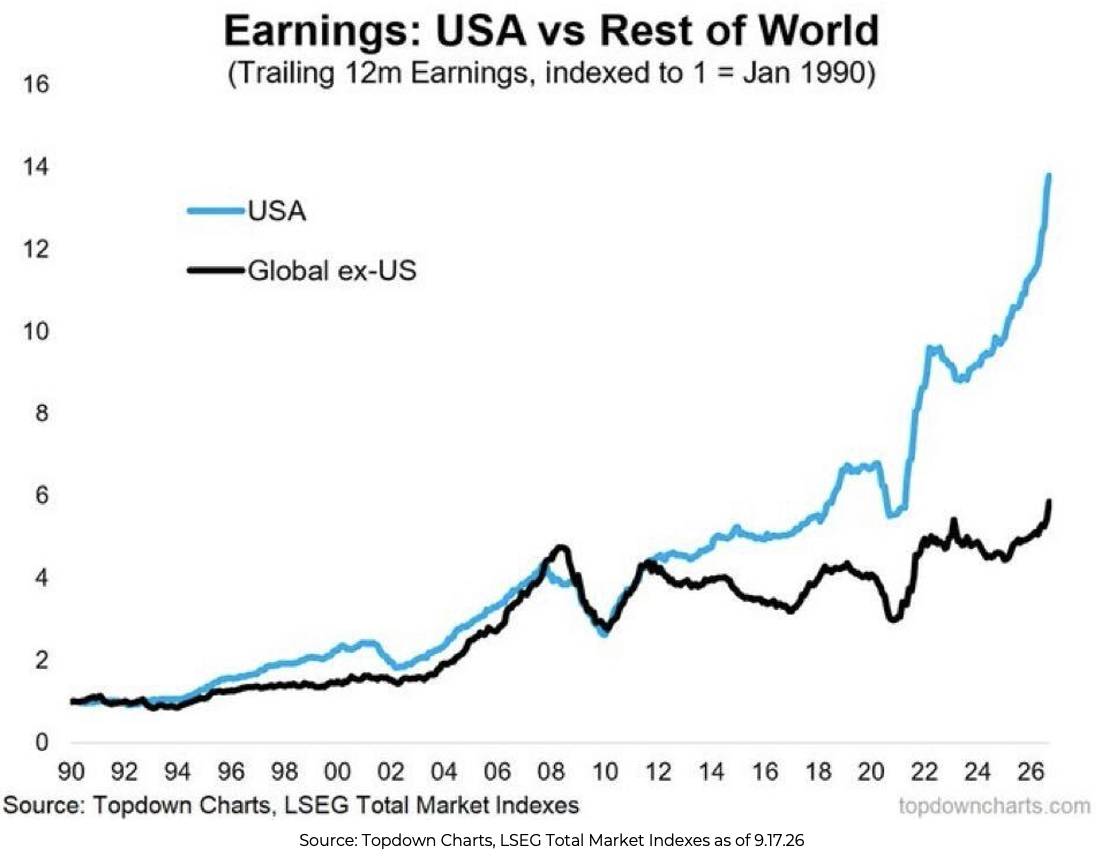
Brett: US corporate earnings have grown to almost 14x their 1990 level, more than double the roughly 6x posted by the rest of the world. That gap has only widened since the 2020 dip.
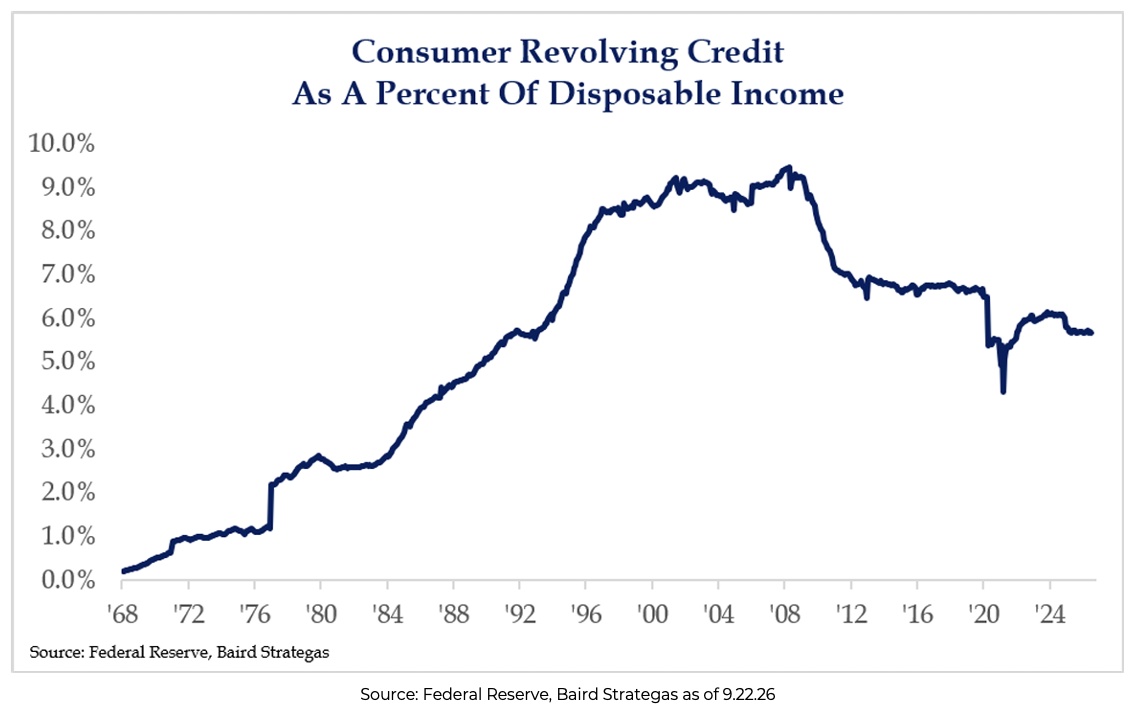
JD: Despite all of the negative factors that can be pointed to, the consumer remains resilient, and despite this resilience, we have not seen an uptick in the use of revolving credit relative to disposable income. It is unclear what would cause this trend to reverse, and as long as consumers have jobs and steady incomes, they generally continue to spend.
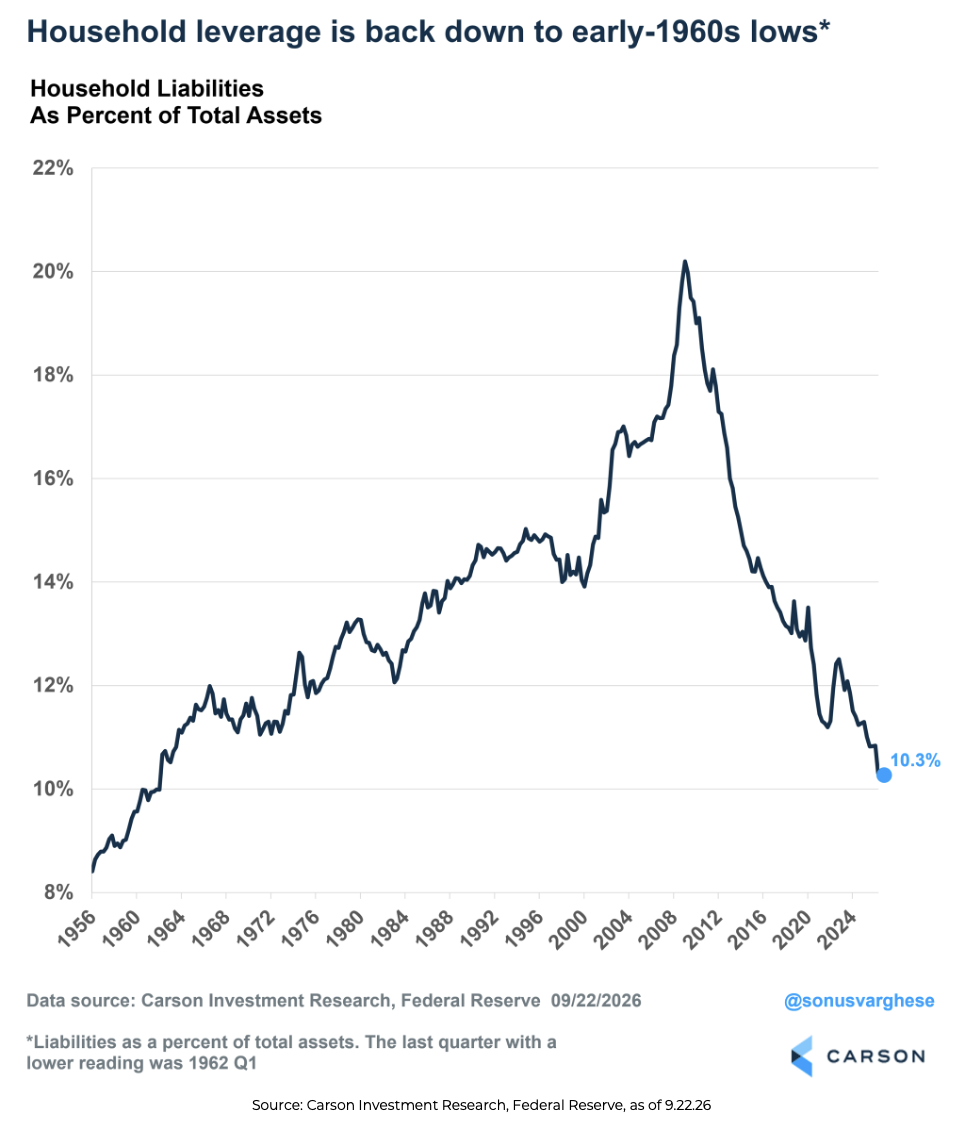
John: Household leverage is back down to ~10% of total assets, a level last seen in the early 1960s. That is less than half the ~20% peak hit during the 2008 financial crisis.
Disclosures
Past performance is not indicative of future results. This material is not financial advice or an offer to sell any product. The information contained herein should not be considered a recommendation to purchase or sell any particular security. Forward-looking statements cannot be guaranteed.
Projections or other forward-looking statements regarding future financial performance of markets are only predictions and actual events or results may differ materially.
This commentary offers generalized research, not personalized investment advice. It is for informational purposes only and does not constitute a complete description of our investment services or performance. Nothing in this commentary should be interpreted to state or imply that past results are an indication of future investment returns. All investments involve risk and unless otherwise stated, are not guaranteed. Be sure to consult with an investment & tax professional before implementing any investment strategy. Investing involves risk. Principal loss is possible.
Advisory services are offered through Aptus Capital Advisors, LLC, a Registered Investment Adviser registered with the Securities and Exchange Commission. Registration does not imply a certain level of skill or training. More information about the advisor, its investment strategies and objectives, is included in the firm’s Form ADV Part 2, which can be obtained, at no charge, by calling (251) 517-7198. Aptus Capital Advisors, LLC is headquartered in Fairhope, Alabama. ACA-2609-23.