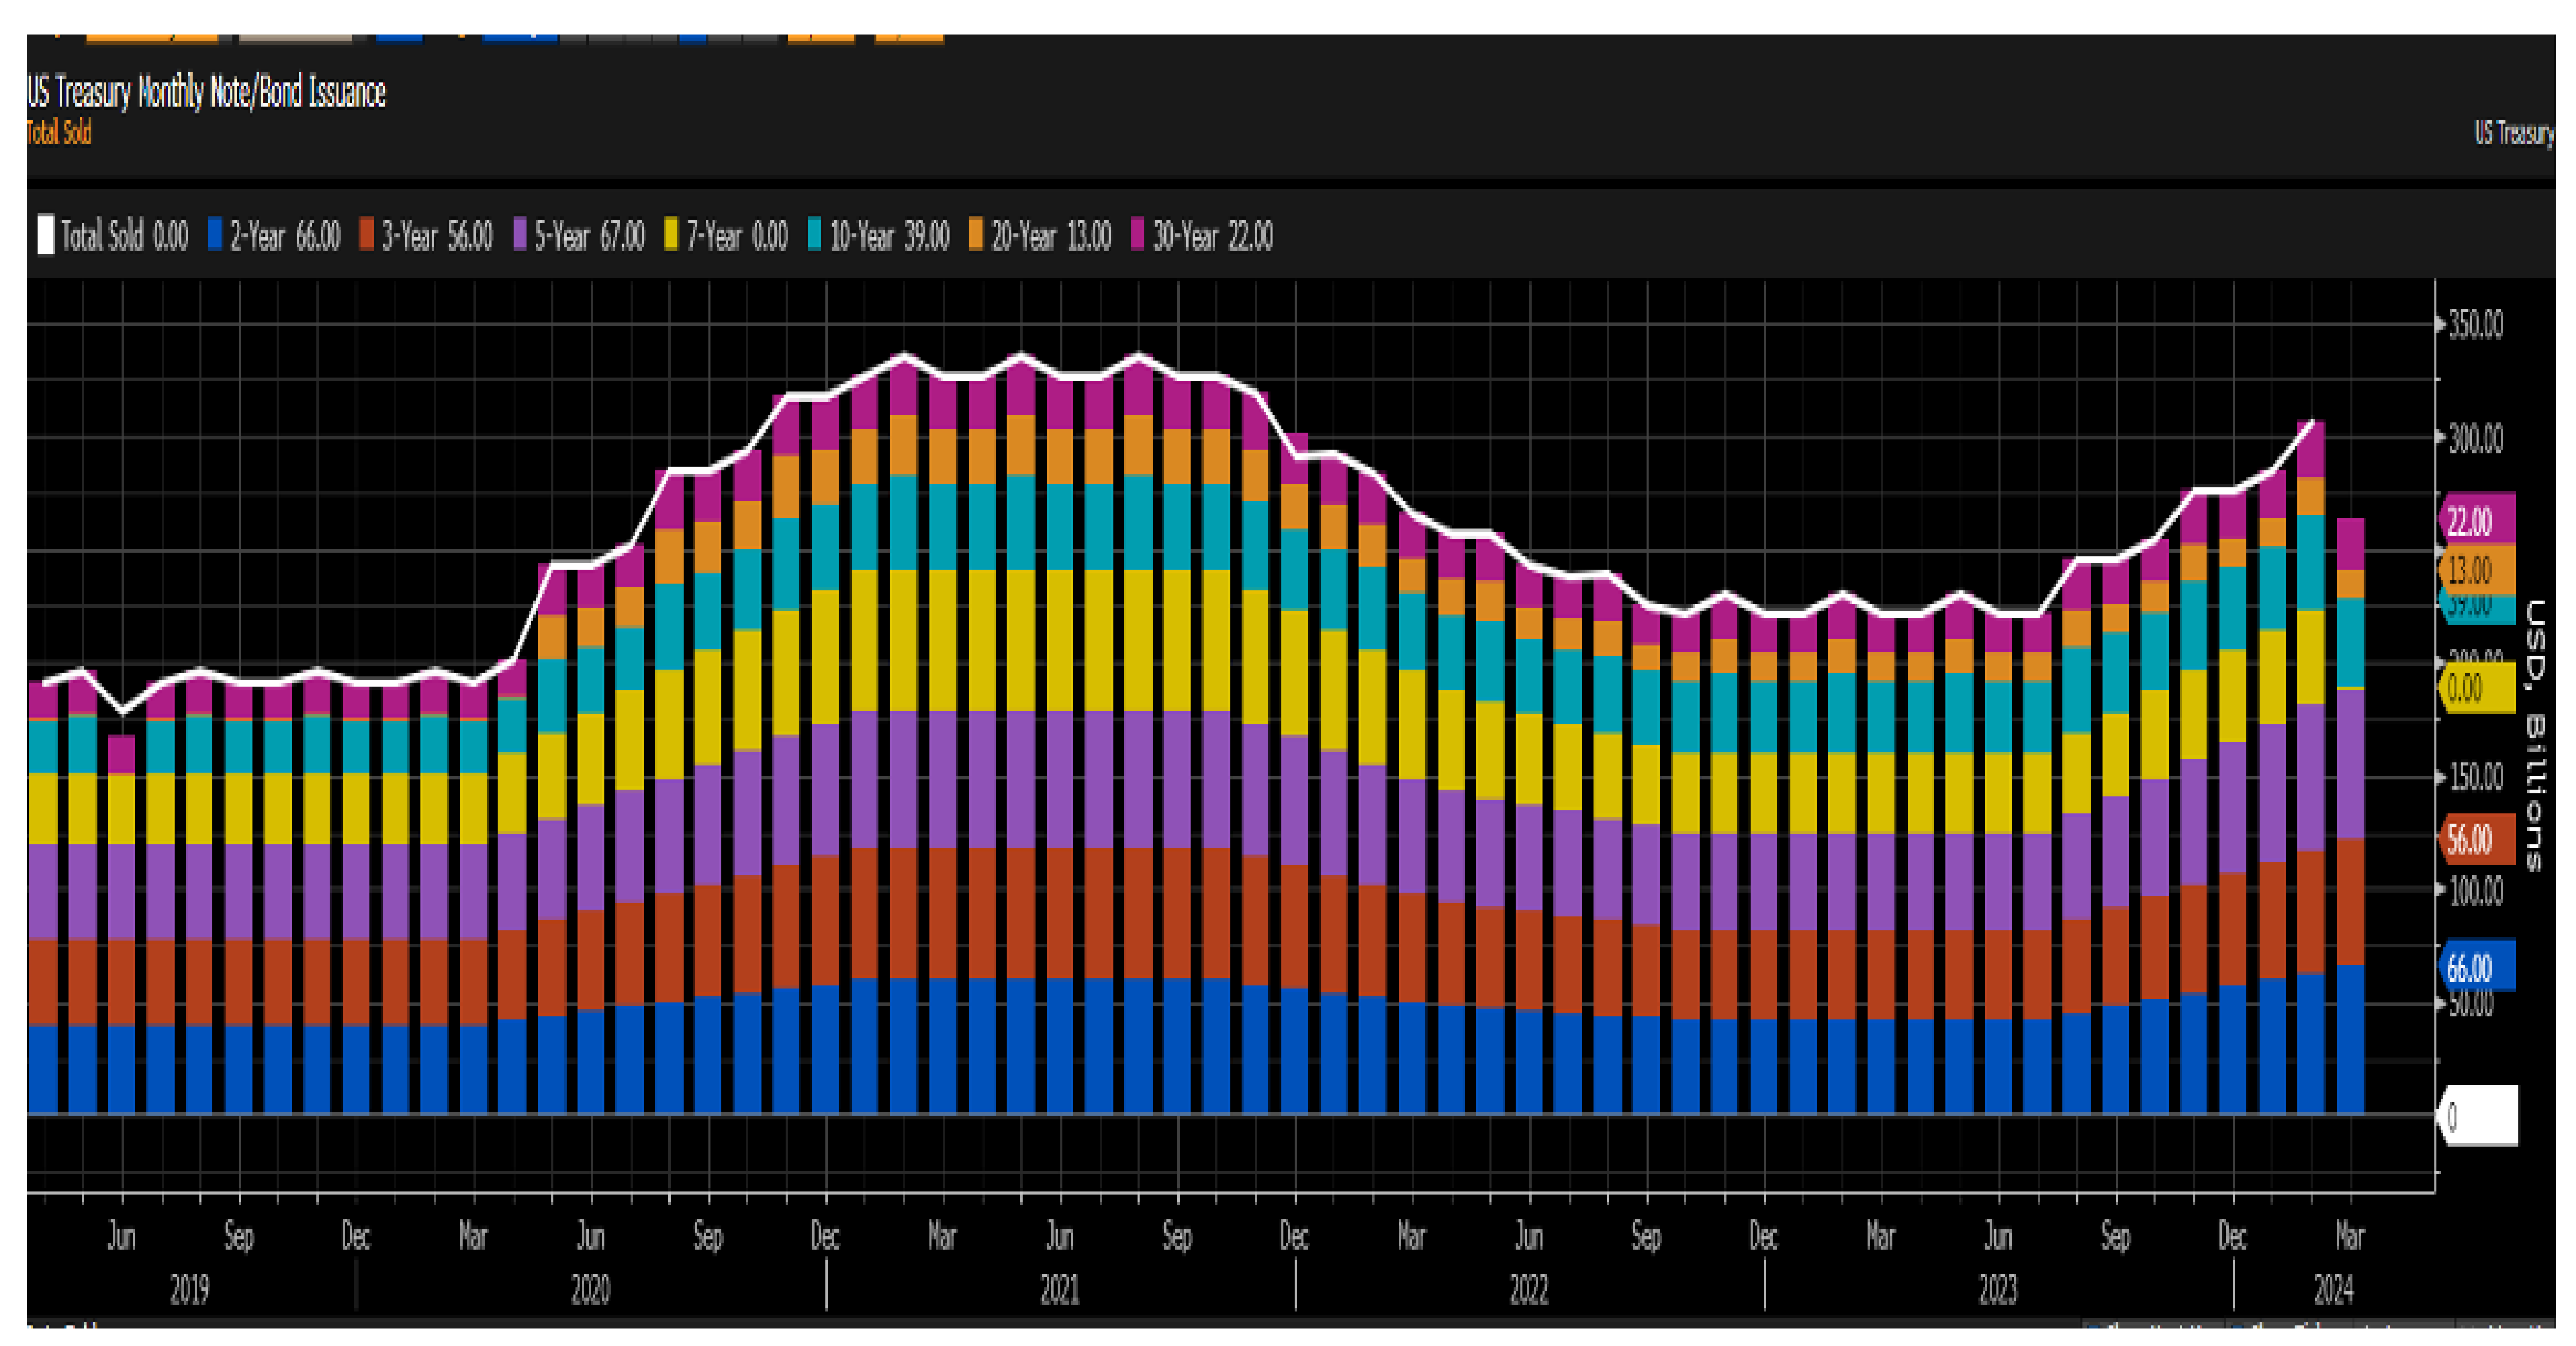
Treasury Issuance Back at Pandemic Levels
As we’ve noted over the last year, the current level of US fiscal deficits, given a strong economy and low unemployment, is uncharted territory. It was ironic that Phillip Swagel, director of the Congressional Budget Office, came out earlier this week and noted that the mounting US fiscal burden was on an “unprecedented” trajectory, risking a crisis similar to what the UK faced in Q4 of 2022 under Liz Truss.
 Source: Bloomberg as of 03.27.2024
We agree that there are three options at this juncture: cut entitlements (unlikely), cut defense spending (very unlikely), or allow real inflation to run greater than interest rates in the form of financial repression (likely). Looking at Treasury issuance data, we’re seeing issuance back to levels seen during the pandemic. While a chunk of recent issuance has been focused on the front end of the curve (where there is ample demand), at some point this debt (plus new debt) will have to be rolled out further on the yield curve.
On top of structural supply forces on the Treasury market, another key point from Powell’s testimony stood out: Powell noted that if we were to see the employment situation deteriorate, the Fed would lower rates – presumptively, even if inflation is still above target.
Structurally, more Treasury bonds hitting the market on top of a liberal interpretation of the inflation target raises our ongoing question of, at what level will the market take down all these Treasury bonds if central banks aren’t buyers?
ISDA Comments on the SLR
A couple of weeks back, ISDA came out with an article lobbying for a revision to SLR policy (SLR stands for Supplementary Leverage Ratio). It is the broadest capital requirement and is a measure of capital to total assets for financial institutions. It’s basically a Gross Leverage Ratio which enforces capital requirements on financial companies like banks.
Comments from ISDA:
“To facilitate participation by banks in U.S. Treasury markets – including clearing U.S. Treasury security transactions for clients – the Agencies should revise the SLR to permanently exclude on-balance sheet U.S. Treasuries from total leverage exposure, consistent with the scope of the temporary exclusion for U.S. Treasuries that the Agencies implemented in 2020.”
“It is important that banks have capacity to absorb a continued high volume of U.S. Treasury issuance, with the market projected to grow to exceed $35 trillion in the next five years, as well as to facilitate access to cleared U.S. Treasury markets (including cash as well as repurchase and reverse repurchase transactions (together, “repos”) and related derivatives markets.”
We see this request as a shift of the line in the sand. This could also be the answer to our question asked above: who is going to buy the debt? It does seem like the regulatory bodies are attempting to set a precedent of allowing banks the option to buy unlimited Treasury bonds, without the bonds dinging their capital ratios. This would incentivize banks to buy more Treasuries. We’d take it further and have reason to believe the next step would be regulating other industries like insurance companies and other entities (endowments, etc.) to hold a certain level of Treasuries.
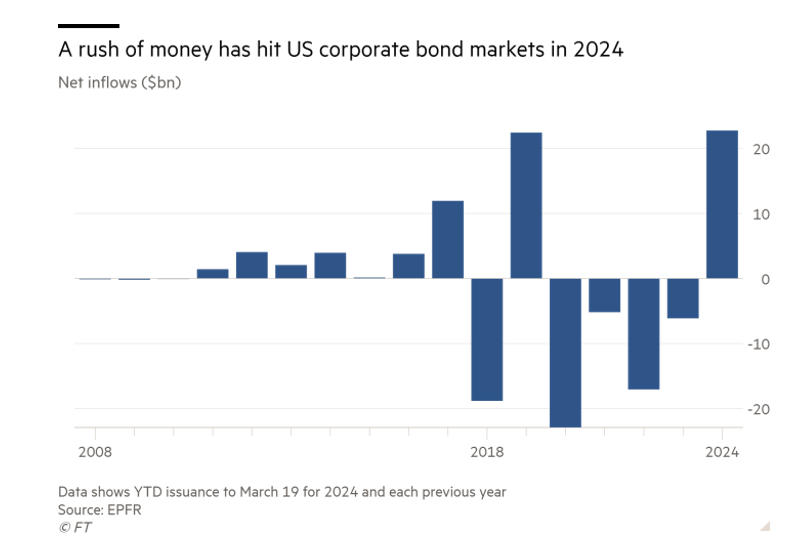
Flurry of Inflows to Corporate Bonds
2024 has brought a large inflow into corporate bond funds which has totaled ~$22.8bn thus far, according to fund tracker EPFR.
 Source: Financial Times as of 03.23.2024
This is the first positive start to a year since 2019 as higher interest rates have attracted investors to lock in higher yields. The flows have pushed up bond prices and compressed credit spreads; the extra interest paid by corporate borrowers relative to Treasury Bonds. Recent inflows have predominately flowed into investment-grade paper which has pushed spreads to a two-year low. In addition, spreads on high-yield debt are at 26-month lows and only a fraction above pre-GFC levels.
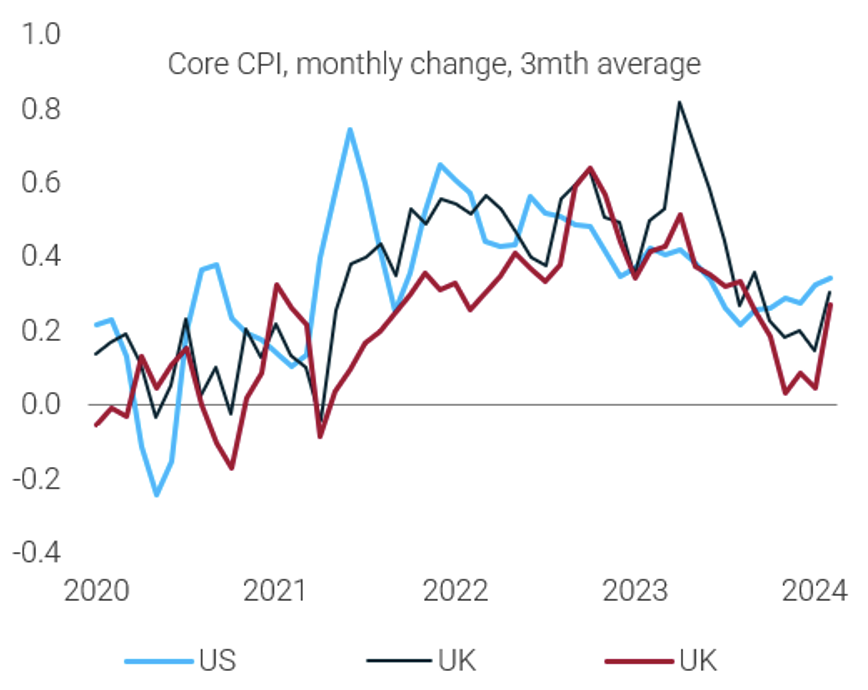
Inflation Moving In the Wrong Direction
While we know disinflation is not linear, we saw a significant decline in the rate of inflation over the past two years. Progress has come in fits and starts through the cycle. Recent data has been one of those “fits” where the uptick has put the Fed in a rather uncomfortable position.
 Source: TS Lombard as of 03.23.2024
Looking back, and given the breadth of previous price pressures and the interactions between various components of the CPI, perhaps this was to be expected (the last mile is hard). Ultimately the last 6 months have provided three months of progress followed by three months of disinflation stalls. Will markets extrapolate the last couple of CPI prints, or look past it and presume disinflation will continue?
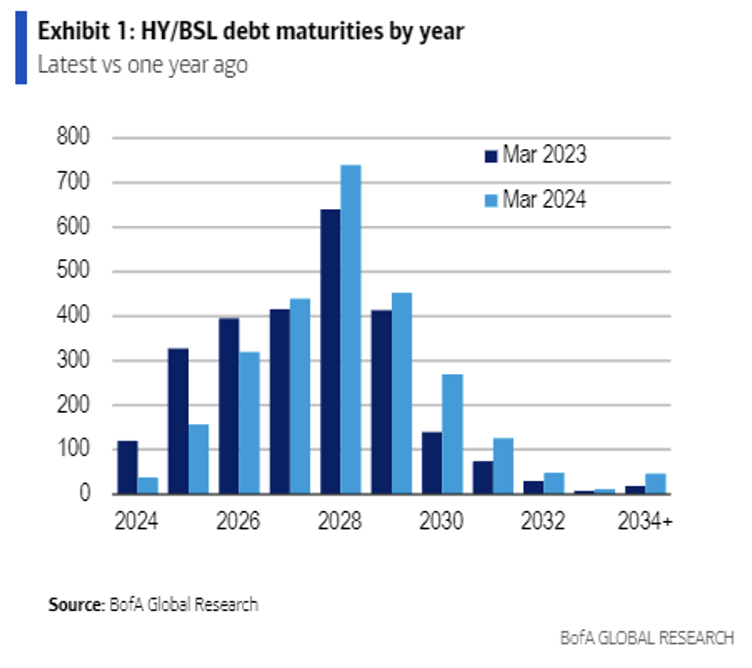
What “Maturity Wall”?
We’ve heard repeatedly over the last year about a “Maturity Wall” where lower-rated issuers would be faced with a scenario of refinancing debt into much higher yields. In fact, the contrary has happened as high yield and leveraged loan issuers have reduced their 2024-2026 maturity wall by about 40% from a year ago.
 Source: BAML as of 03.22.2024
Bank of America labeled the change as “This episode represents one of the most aggressive instances of maturity extension in the history of leveraged finance.” Narrow credit spreads have enabled these companies to refinance the debt at a modest 200bps increase in cost versus the 500bps cost speculated by many. While some issuers may face issues if rates stay elevated, the maturity wall was “less tall” than most expected.
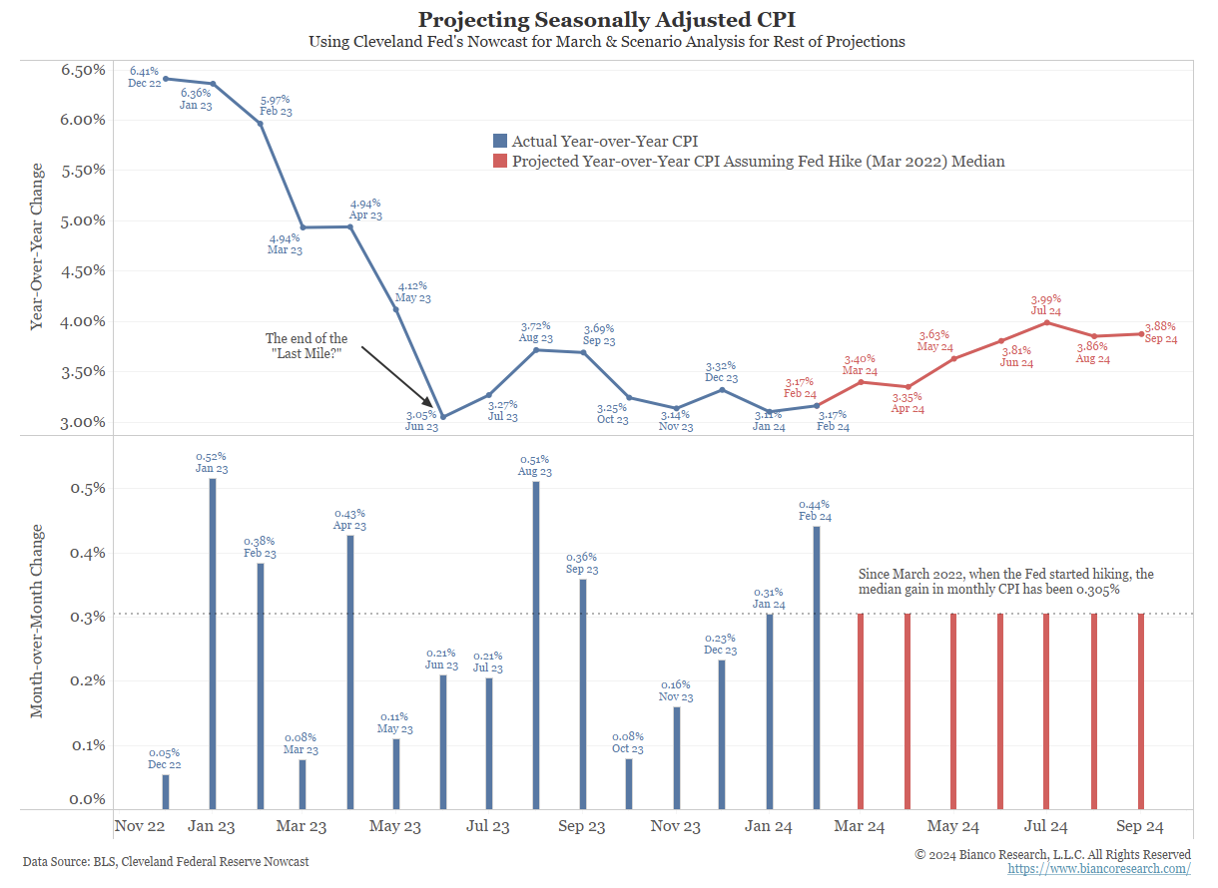
Direction of CPI Moving into Q2/Q3 2024
Following our commentary from last week post-FOMC, we continue to believe the Fed is going to settle for a higher-than-target inflation rate (2 points or so rather than exactly 2%). The next several months will put the Fed’s resolve to the test as it’s likely CPI data will remain stubbornly above 3% through the summer and into the election.
Bianco Research analyzed what that could look like moving into Q2 and Q3. The red bars in the bottom panel project a 0.305% month-over-month growth rate for CPI, which was the median monthly CPI gain over the last two years. The red line in the top panel shows what year-over-year CPI will average if monthly CPI continues around the median monthly gain of 0.305%. As you can see, it’s much higher than the Fed’s 2% target.
 Source: Bianco as of 03.27.2024
Even if we see PCE inflation (the Fed’s preferred gauge) settle in around 2.5% (still above target), we think it’s likely that the Fed will need material labor market weakness to justify rate cuts given current levels of inflation.
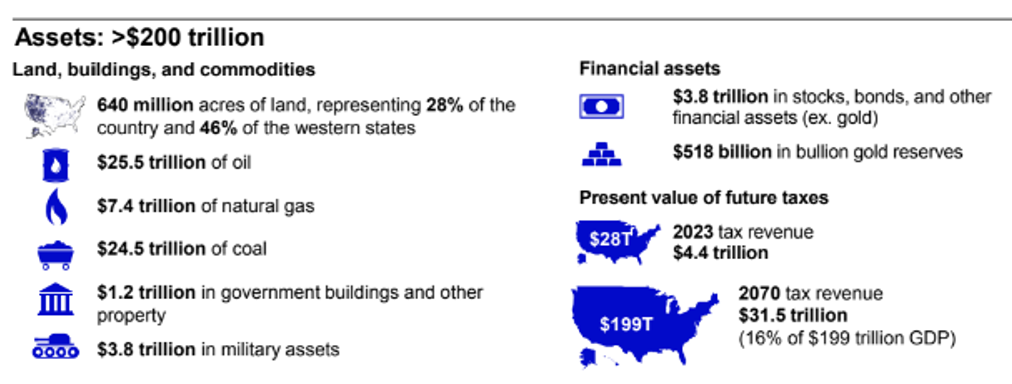
Underlying US Assets
We’ve heard just about every negative thing possible when it comes to gloom and doom concerning the US fiscal position. I will be the first to admit that it’s easy as a bond guy to be cranky and generally bearish on markets. Part of that has to do with the concave payout of a bond – capped upside, unlimited downside (credit), and inflation risk – and the other part is that when the economy is facing rocky times, yields move lower and there are more opportunities to make money when markets turn volatile.
The famous Warren Buffett saying “Don’t bet against America” is one that I always come back to. I thought the graphic below from Invesco did a nice job of quantifying some of the US assets that most bearish market commentators conveniently forget about.
 Source: Invesco as of 03.27.2024
The US is blessed with, arguably, the best natural resource pool in the world, the strongest military, defense of 2 surrounding oceans, the reserve currency, and personal/ business freedoms not available over most of the rest of the world. While times might be challenging here, you can bet in other parts they are even worse.
At the end of the day, as long as the US has the strongest economy and opportunity with (financial markets, innovation, rule of law) the reserve currency, it’s highly likely we will get through these times just like we always have!
Disclosures
Past performance is not indicative of future results. This material is not financial advice or an offer to sell any product. The information contained herein should not be considered a recommendation to purchase or sell any particular security. Forward-looking statements cannot be guaranteed.
This commentary offers generalized research, not personalized investment advice. It is for informational purposes only and does not constitute a complete description of our investment services or performance. Nothing in this commentary should be interpreted to state or imply that past results are an indication of future investment returns. All investments involve risk and unless otherwise stated, are not guaranteed. Be sure to consult with an investment & tax professional before implementing any investment strategy. Investing involves risk. Principal loss is possible.
Advisory services are offered through Aptus Capital Advisors, LLC, a Registered Investment Adviser registered with the Securities and Exchange Commission. Registration does not imply a certain level or skill or training. More information about the advisor, its investment strategies and objectives, is included in the firm’s Form ADV Part 2, which can be obtained, at no charge, by calling (251) 517-7198. Aptus Capital Advisors, LLC is headquartered in Fairhope, Alabama. ACA-2403-34.
