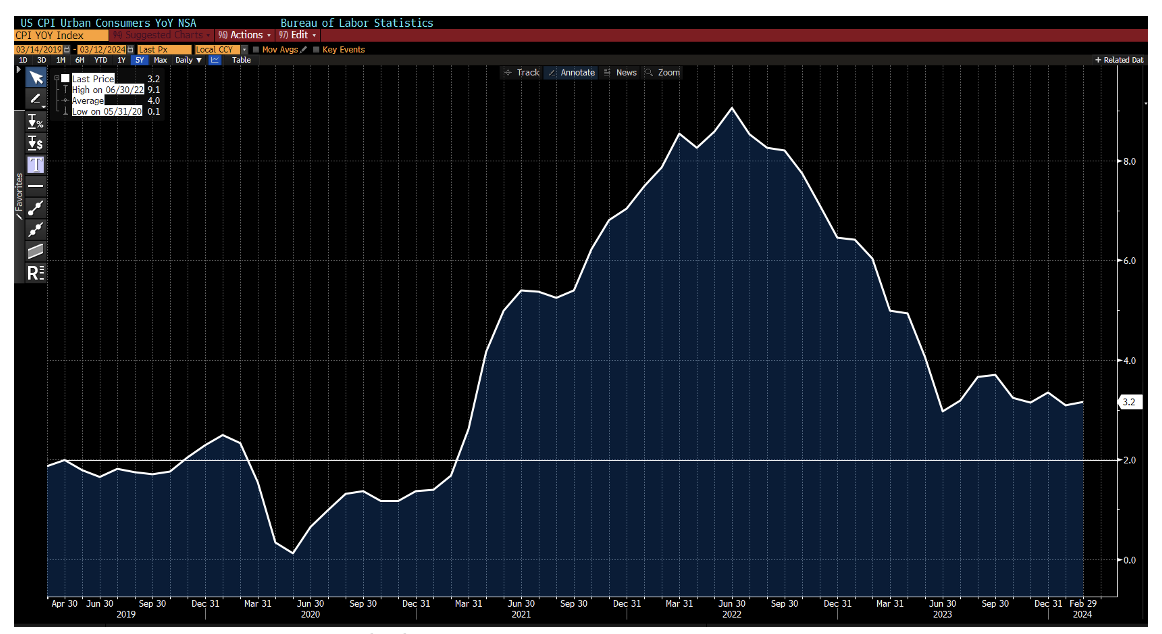
Inflation Stabilizing Above 3%
The U.S. CPI rose +0.4% m/m (3.2% y/y) & core (ex-food & energy) was +0.4% m/m (3.8% y/y) in February. The so-called “supercore” gauge slowed to 0.47% on the month, down from a red-hot 0.85% in January. The data is still uncomfortably high for the Fed.
 Source: Bloomberg as of 03.12.2024
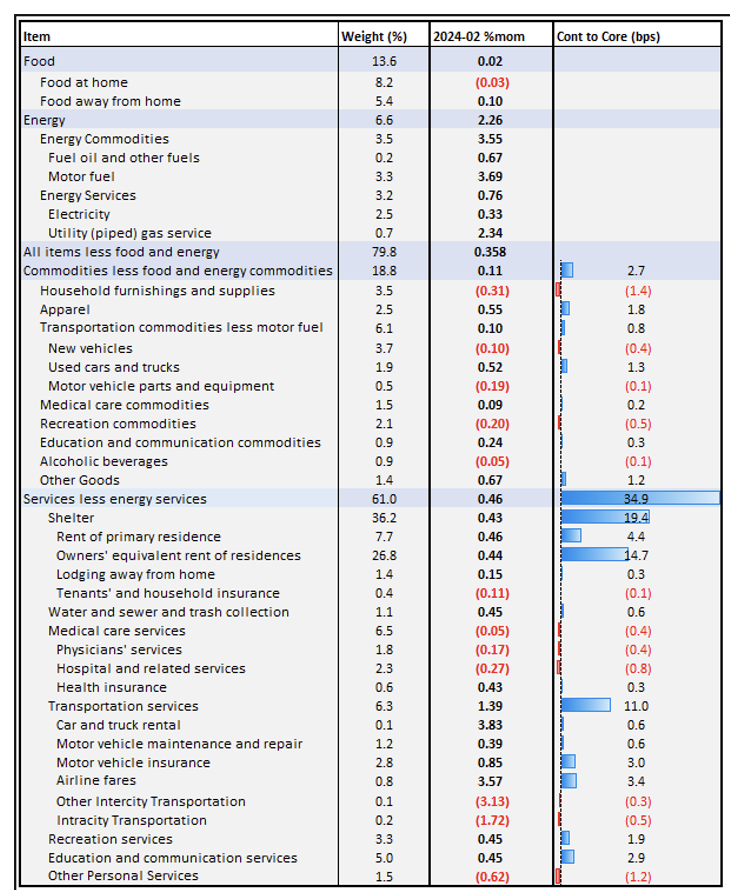
Breaking down the components, shelter costs continue to be the largest driver of inflation. Homeowner equivalent rent decelerated to 0.4% (after a notable jump to 0.6% in January). Airline fares and motor-vehicle insurance saw a bump higher. The jump in gasoline costs combined with shelter explains more than 60% of the overall increase. Food prices were unchanged for the month.
Looking ahead to next month, there is a very low comp of 0.1% that will be rolling off from March 2023. Considering the easy comp, next month’s CPI print will likely bring another strong year-over-year number.
Bottom line: We saw inflation drop precipitously from Summer of 2022 to Summer of 2023. Since then, inflation bottomed out but has remained considerably above the Fed’s 2% target.
While yesterday’s miss relative to expectations was minimal, the Fed was looking for further indications that inflation was moving closer to their 2% target. The lack of convincing evidence suggests the Fed may be on hold for longer than the market expected, as Committee members continue to wait for a clear-cut and well-established downward trend indicating the current level of rates is sufficient to reinstate price stability.
Inflation Components
Nearly half of CPI’s components are posting 0.3% or higher m/m increases, as the breakdown above highlights. We take that to mean INFLATION IS STICKY.
 Source: Citadel as of 03.12.2024
Why is inflation sticky?
- Consumers still have jobs and the labor market is still robust
- High-end consumers still have excess savings à net worths at all-time highs
- Low-end consumers are still willing to borrow -> have jobs
The points above (+ strong fiscal) are keeping aggregate demand strong. Like we’ve said in previous posts, we believe that as certain prices show a decline (i.e., furniture -0.3% m/m, appliances -0.9% m/m, sporting goods -0.6%), other prices rise (e.g., apparel 0.6%, personal care products 1.0%, admissions to theaters 0.8%, personal care services 1.3%) as the consumer’s dollar shifts around to other goods/ services. Consumer spending power is still strong.
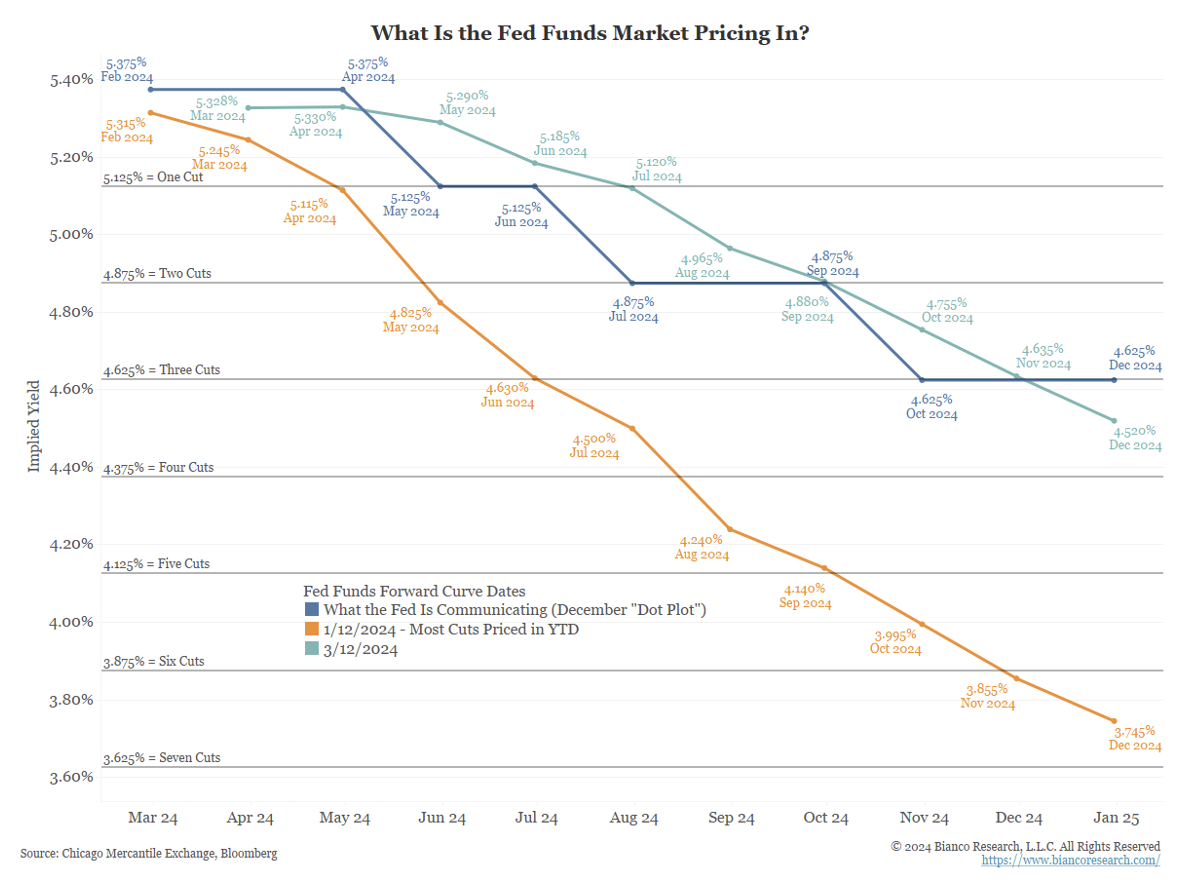
What is the Market Pricing Now?
We’ve consistently put out this chart over the last several months as we believed the market was overly optimistic for rate cuts early in 2024. Currently, only three or four rate cuts are priced in for 2024.
 Source: Bianco as of 03.12.2024
This is largely in line with the Fed’s projections from the December Summary of Economic Projections (DOTs). If we continue to see strong economic/ inflation data, we think the next move by the market could be to price in fewer/ no cuts for 2024.
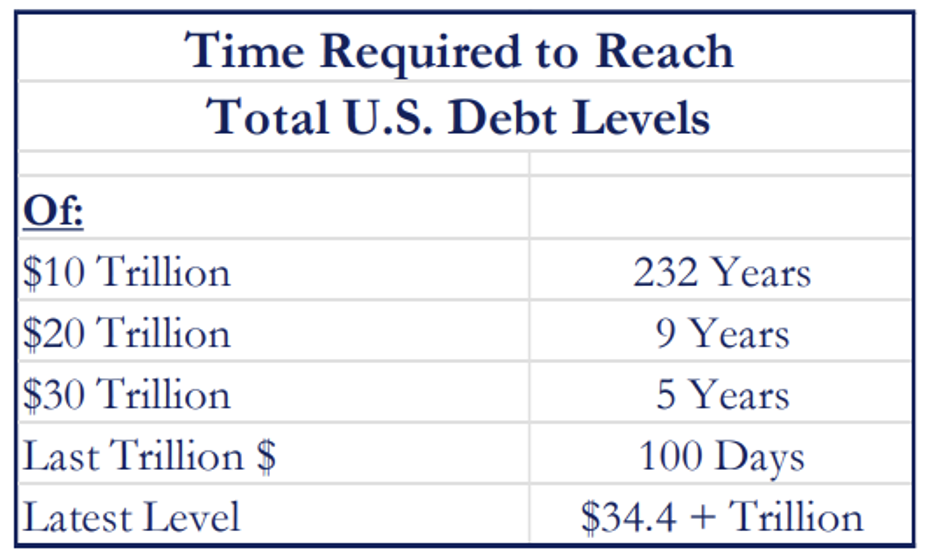
Tack on Another Trillion
It took the United States 232 years to accumulate its first $10 trillion in debt, nine years to accumulate its second, and five years to reach its third. The trip from $33 trillion to $34 trillion in debt was a short one, requiring only three months, from September to December of 2023.
 Source: Strategas as of 02.26.2024
What has been a surprise this cycle has been the “Big Fiscal” strategy the administration has been running, given full employment. With the curve inverted, rates have remained manageable with the 10-year at ~4% (very low term premiums).
We imagine Big Fiscal keeps going until the election. Looking past the election we expect both candidates will run similar fiscal policies just in different names. Simply put, $2 trillion+ deficits annually likely keep markets afloat and inflation sticky. This leads us back to our conviction in owning more stocks and less bonds.
Were the Last 15 years Normal or an Anomaly?
T. Rowe Price’s Sebastian Page put out a fantastic paper on real interest rates, and rate environments of the past. While his call to action was to buy value stocks, my interpretation was to simply own more stocks.
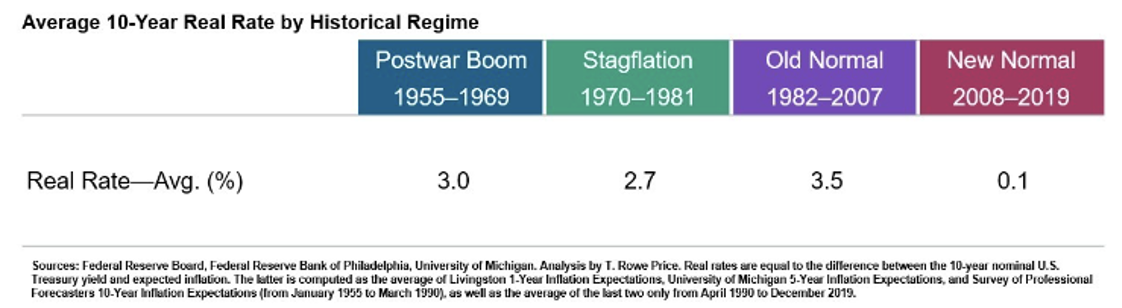 Source: T. Rowe Price/ Fed as of 03.12/.204. Paper on Real Rates
The paper concluded that the real rate environment experienced over the last ~15 years was abnormal. After the GFC we saw an era of extremely accommodative Central Bank policy (via low rates and QE). The economy sputtered around in a cycle of low growth, low rates, and low inflation. This era ended with the pandemic which they believe served as a reset, which will lead real rates back towards more historic norms (i.e., higher).
We’d agree that interest rates are simply the “Price of Time”, and investors should require additional compensation for taking on interest rate risk. If you believe that there is a time value to money, zero interest rates aren’t normal. Moving back to an environment of higher rates and growth might create some volatility but overall is typically a strong environment for equity returns compared to fixed income.
U.S. Debt Maturity Schedule
Given the magnitude of UST debt that is rolling off the next couple of years, we continue to believe this chart will remain relevant. The longer interest rates remain elevated, the higher the average cost of the debt will be.
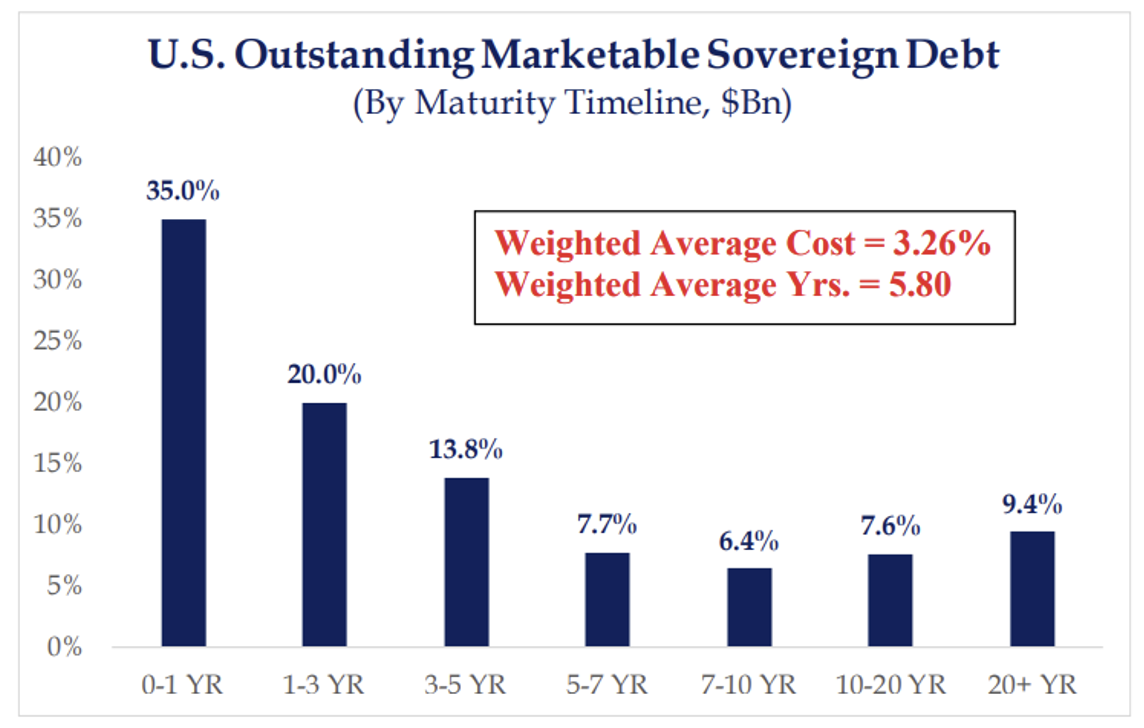 Source: Strategas as of 02.26.2024
As we highlighted in our last update, nearly 70% of US gov’t debt will rollover the next 5 years. Our biggest question is who will buy all the debt… and at what level?
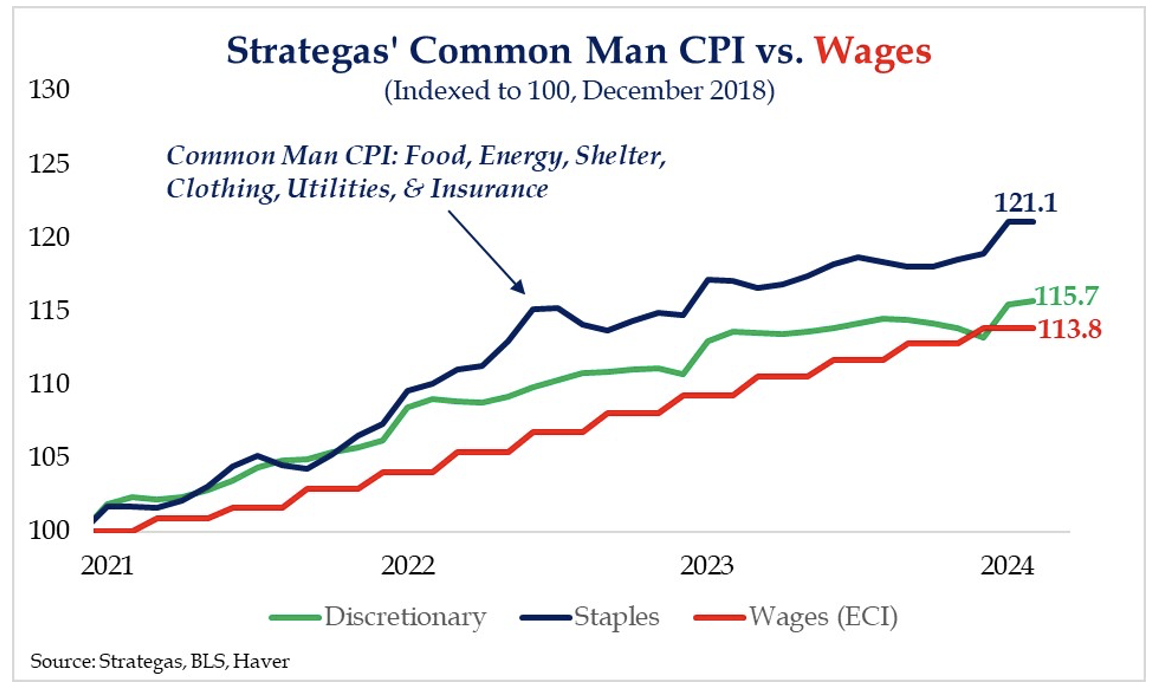
Strategas Common Man CPI Index
Strategas’ Common Man CPI rose 3.5% versus the headline CPI of 3.2%. Their index has exceeded the BLS reading in each of the last 7 months and 32 of the last 36 months.
 Source: Bianco as of 03.12.2024
This index is comprised of items people must buy – food, energy, shelter, clothing, insurance, and utilities – as opposed to items they might like to buy. It has outpaced a broad measure of wages (the Employment Cost Index) by over 7% in the last three years.
Regular readers know we often criticize the CPI calculation for its “pick and choose” method of how it reports data. We believe it understates real-world inflation, and the Strategas Common Man CPI Index confirms our suspicion.
Disclosures
Past performance is not indicative of future results. This material is not financial advice or an offer to sell any product. The information contained herein should not be considered a recommendation to purchase or sell any particular security. Forward looking statements cannot be guaranteed.
This commentary offers generalized research, not personalized investment advice. It is for informational purposes only and does not constitute a complete description of our investment services or performance. Nothing in this commentary should be interpreted to state or imply that past results are an indication of future investment returns. All investments involve risk and unless otherwise stated, are not guaranteed. Be sure to consult with an investment & tax professional before implementing any investment strategy. Investing involves risk. Principal loss is possible.
Advisory services are offered through Aptus Capital Advisors, LLC, a Registered Investment Adviser registered with the Securities and Exchange Commission. Registration does not imply a certain level or skill or training. More information about the advisor, its investment strategies and objectives, is included in the firm’s Form ADV Part 2, which can be obtained, at no charge, by calling (251) 517-7198. Aptus Capital Advisors, LLC is headquartered in Fairhope, Alabama. ACA-2403-22.
